Index funds, which were almost non-existent 50 years ago, now play a prominent role in global financial markets.
Indexation growth has been driven by the inability of active managers, in aggregate terms, to outperform passive benchmarks. This is not a new development, as it was first reported 90 years ago.
The increase in passive management is a consequence of active performance deficits.
These shortcomings can be attributed to three factors. The professionalization of investment management, the superior cost and the asymmetry of stock returns.
Since each of these factors is likely to persist, the advantage of indexation over active management is likely to persist as well.
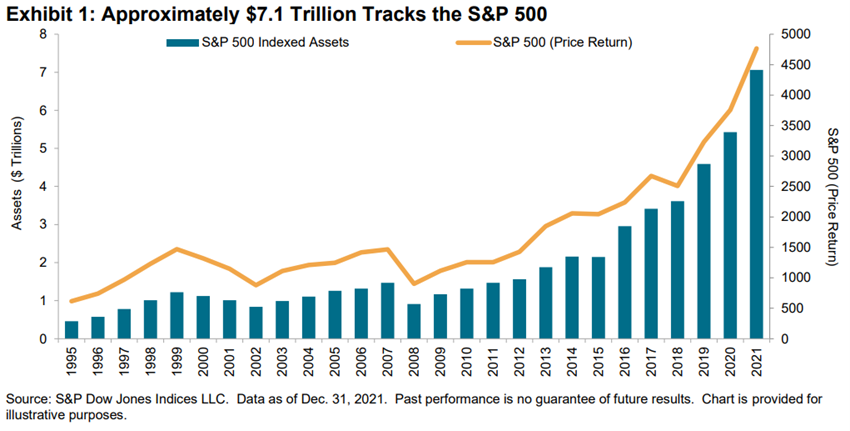
About $7.1 billion is pegged to the S&P 500
The following chart illustrates the growth of assets that follow the S&P 500, the most prominent index in the world’s largest stock market, but this trend was not limited to the U.S. (nor stocks):
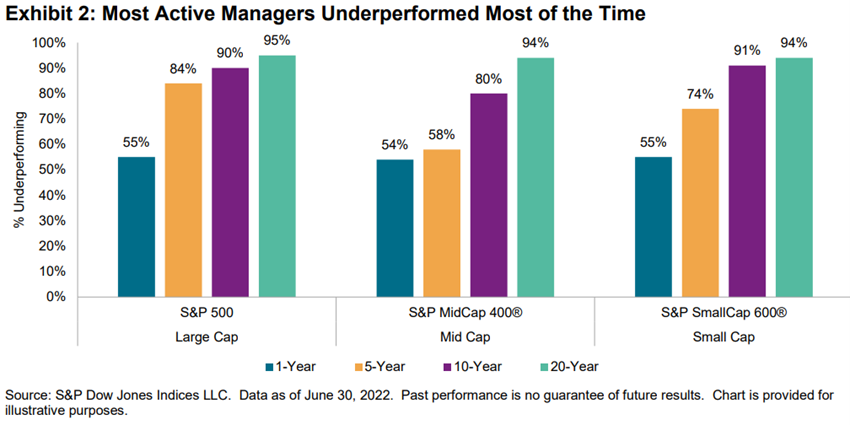
Most active hedge fund managers underperformed benchmarks
Most active funds underperformed benchmarks suited to their investment style.
This is not uncommon. In fact, throughout the history of the SPIVA database, poor performance is much more common than not.
In addition, the extension of the time horizon makes active management look even worse, not better.
In addition, it is notable that active fund managers of mid- and small-cap portfolios have struggled as much as their large-cap peers.
This is not an intuitive conclusion. In fact, it is sometimes argued that investors should index well-scrutinized, analysed, and relatively “efficient” large-cap stocks and use active managers in the less analysed mid- and small-cap arenas.
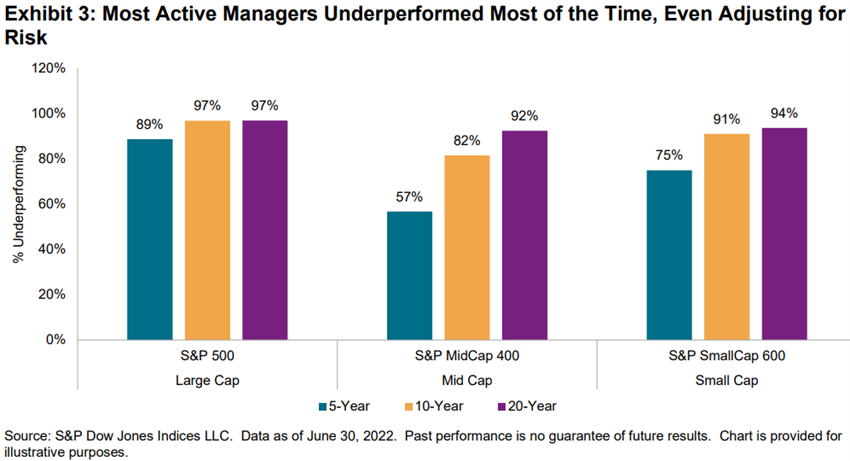
Most active fund managers underperformed most of the time, even adjusting for risk
Active managers sometimes argue that while they are not successful in outperforming indices, they benefit their clients by managing portfolio volatility and therefore improving risk-adjusted returns.
Generally speaking, this premise is incorrect. Most active portfolios are more volatile than the benchmarks they are compared to.
The SPIVA data on risk-adjusted performance is therefore comparatively dismal, as the following chart shows:
Ignoring fees mitigates, but does not eliminate, the underperformance of active funds
The SPIVA database focuses on investment funds, net of commissions, and critics sometimes argue that the poor performance of managers is entirely due to commission levels.
It is also fair to note that institutional active fund holders have substantial bargaining power, resulting in lower commissions and potentially better performance results than those achieved by individual investment fund investors
These objections are exact, but not decisive.
Even ignoring fees altogether, the following chart shows that most active fund managers still underperformed:

The performance of the top quartile of active funds did not persist
If most active fund managers underperform, it is theoretically possible that some managers may be consistently above average.
When an active manager outperforms his or her benchmark, to know whether this result is the product of genuine skill or just good luck, we might think that the genuine skill is likely to persist, while luck is random and will soon dissipate.
If performance were completely random, we would expect 25% of the top quartile managers in the first five years to be in the top quartile in the second five years.
That’s more or less what happened with large-cap managers, but their mid- and small-cap counterparts fell far short of that mark.

In fact, managers in the mid- and small-cap top quartile were more likely to move to the bottom quartile than to stay at the top.
Cost
Low cost is the simplest explanation for the success of passive management.
Since the passive portfolio has a proportional share of the capitalization of each stock, its portfolio will be identical to the aggregate portfolio of active fund managers. Before costs, therefore, passive and active wallets will see the same return.
However, the costs of active managers, for research, trading, management fees, etc., are inherently higher than those of passive managers. Thus, the actively managed average dollar should underperform the passively managed average dollar, net of costs.
To illustrate the importance of costs, it is enough to consider that the average expense ratio for active U.S. equity investment fund managers in 2021 was 0.68%, compared to just 0.06% for their passive competitors. This 62 bps difference gives investors an automatic advantage for passive versus active managers.
Additionally, the growing popularity of index funds, coupled with industry consolidation and economies of scale, has the potential to further reduce the costs of passive vehicles.
The returns of the S&P 500 constituent members are highly skewed
If stock returns were normally distributed, a randomly chosen stock would have an even probability of delivering above-average performance.
When the distribution is skewed, selection becomes much more difficult.
Of the 975 stocks that were constituents of the S&P 500 at some point between 2002 and 2021, only 253 outperformed the average. The probability that a randomly chosen stock would generate above-average performance, in other words, was 26%, not 50%.
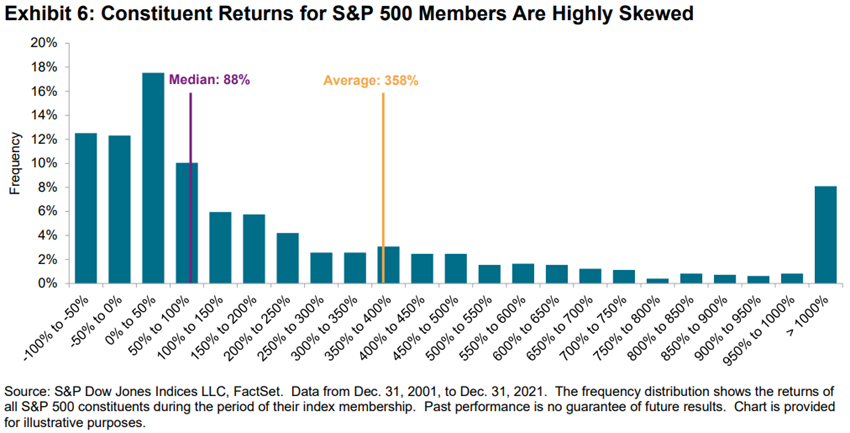
The fewer actions outperform the more difficult it is to actively manage.
Access here: https://www.spglobal.com/spdji/en/documents/research/research-shooting-the-messenger.pdf


