The richest regions on a per capita basis are North America, Japan, Oceania and Western Europe
The richest country in the world is the US, but the richest households are the Swiss, Japanese and the Dutch
This post is based on recent studies of global wealth published annually by Allianz.
Global Wealth Report, Allianz, 2019 – Investorpolis
In terms of global wealth by region, North America leads outstandingly, followed almost on par, by Western Europe and Asia ex-Japan
The following graph shows the value, share, and growth in the last 10 years of gross financial assets by region:
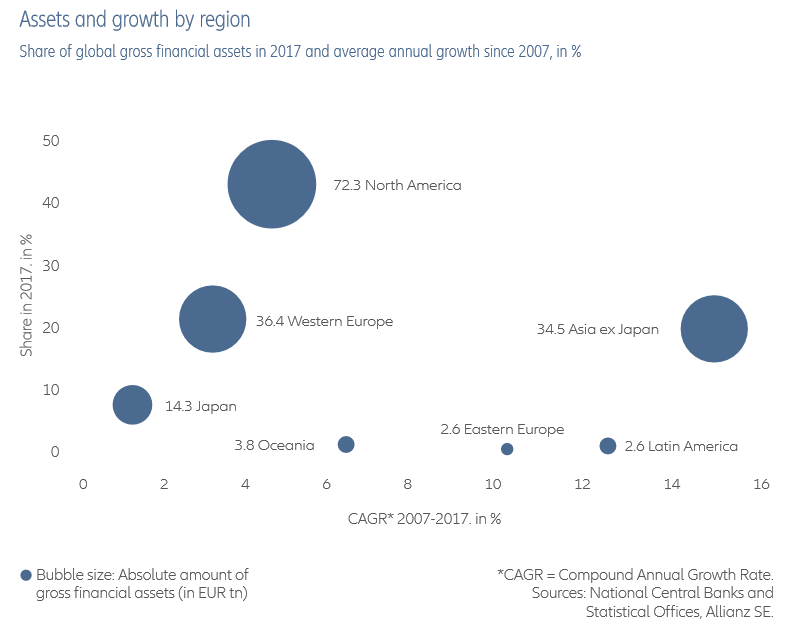
North America with €73,3 trillion accounts for 45% of the world’s wealth, followed by Western Europe and Asia with 20% each, Japan with 14%, Oceania with 4%, and Europe and East and Latin America with about 2.5%.
During this period, there was a strong growth in the developing regions, Asia ex-Japan, Eastern Europe and Latin America, and much more moderate pace in North America, Western Europe and Japan.
The richest regions on a per capita basis are North America, Japan, Oceania and Western Europe
The following graph shows the evolution of net financial assets per capita between 2007 and 2017 in the various regions:
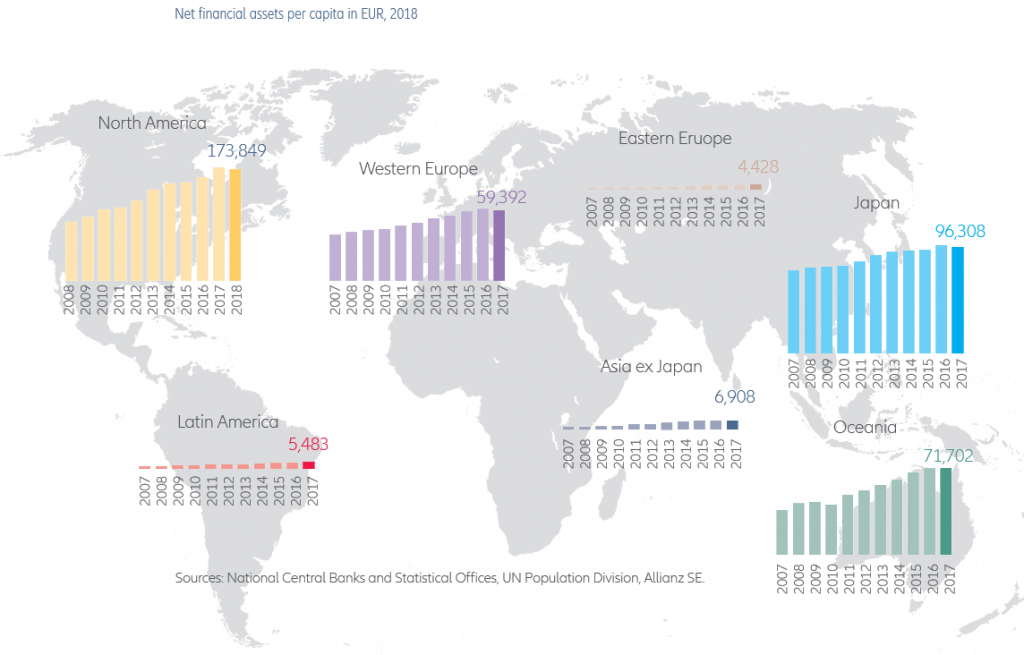
In terms of net financial wealth (deducted by debts) per capita at the regions level, North America leads with 173 thousand dollars, followed by Japan with 96 thousand dollars, Oceania with 71 thousand dollars, Western Europe with 59 thousand dollars, Asia ex-Japan with 7 thousand dollars., Latin America with $5,500 and Western Europe with $4,400.
However, the growth of world wealth in the last 10 years is stronger in emerging economies, especially in Asia ex-Japan, Latin America and Eastern Europe due to its population and increased productivity
The following graph shows the growth of net financial assets between 2007 and 2018 in the main regions:
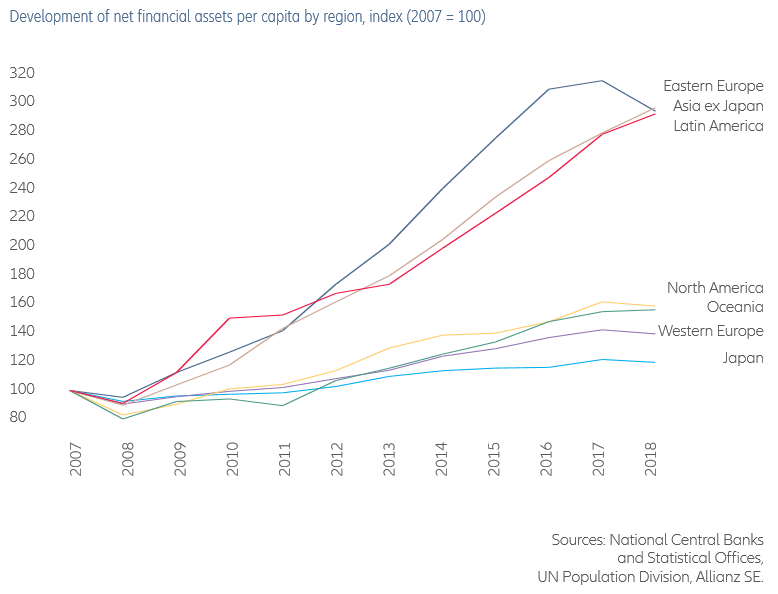
Emerging markets in Asia ex-Japan, Eastern Europe and Latin America have experienced huge growth in financial wealth per capita in the last decade, about 200%, compared with 40% in North America and Oceania, 25% in Western Europe and 10% in Japan.
This is the combined effect of a lower starting base being lower and a strong increase in productivity in these regions.
The richest country in the world is the US, but the richest households are the Swiss, Japanese and the Dutch
The following graph shows net financial assets per capita, in average and median terms, in the richest countries:
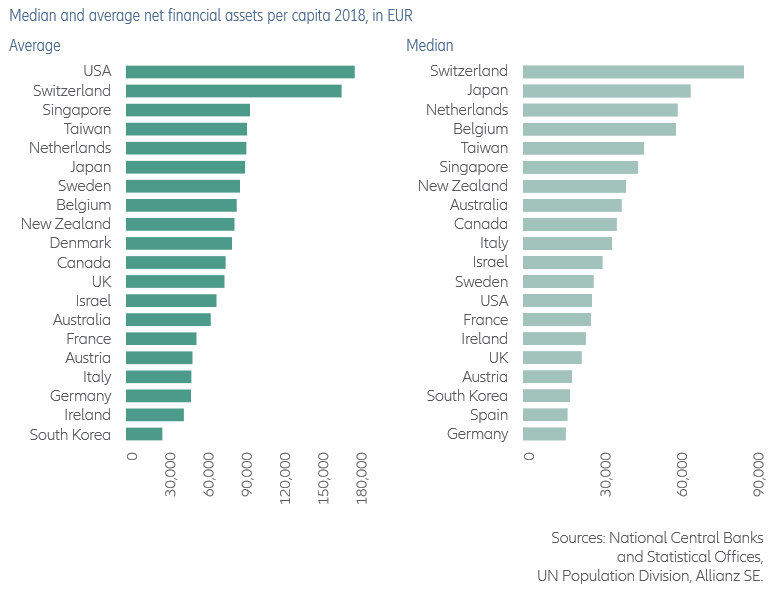
The US leads in terms of average net financial wealth of households with $180,000, ahead of Switzerland with $150,000 and a pool of several countries around $100,000, including Singapore, Taiwan, the Netherlands, Japan, Sweden, Belgium, New York Zealand and Denmark.
However, in terms of net financial wealth of half the households (of the median), Switzerland is the outstanding leader with $80,000, followed by Japan with $60,000 and with the Netherlands and Belgium just behind.
The average family wealth in the U.S. drops to less than $30,000, being surpassed by several countries with lower inequalities.
Global convergence in the last decade with strong growth in gross financial assets close to 10% per year in developing regions and between 1.4% and 3.4% in advanced regions, with impressive real increases in Asia ex-Japan
The following graph shows the average annual growth of gross financial assets in major global regions between 2008 and 2018, and how it decomposes in terms of inflation and real growth:
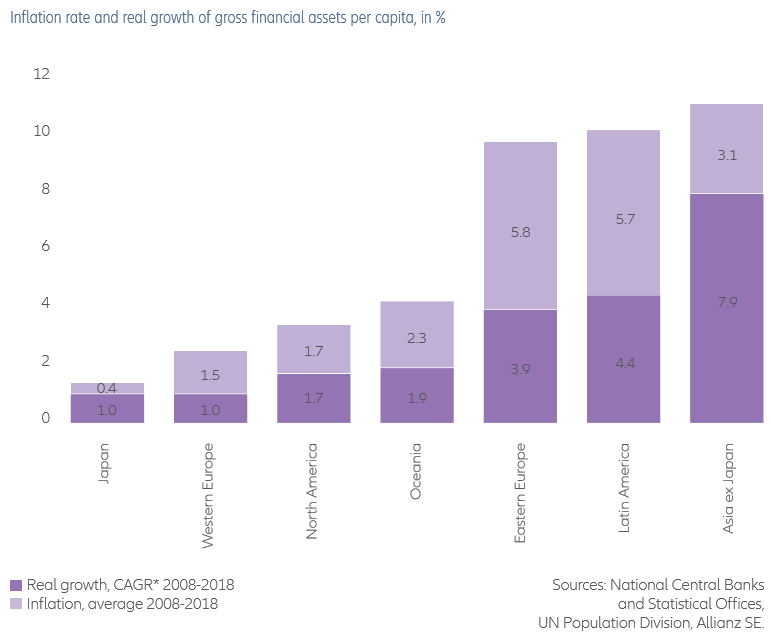
In this decade, the average annual growth of gross financial assets per capita was 11% in Asia ex-Japan, 10.1% in Latin America, 9.7% in Eastern Europe, well above the 3.4% in North America, 2.5% in Western Europe and 1.4% in Japan, thus registering convergence of developing countries.
Asia ex-Japan had an impressive real growth of 7.9% per year, while in Eastern Europe and Latin America this was not beyond 3.9% and 4.4% respectively.
In North America there was real growth of 1.7% per year, while Europe and Japan grew by only a modest 1% a year in real terms, reinforcing arguments that Europe may be moving towards Japanization.
Debt levels in terms of percentage of financial assets by regions have fallen in the last decade almost 10%, in all regions except Asia ex-Japan
The following graph shows the levels of liabilities as a percentage of financial assets by regions in 2018:
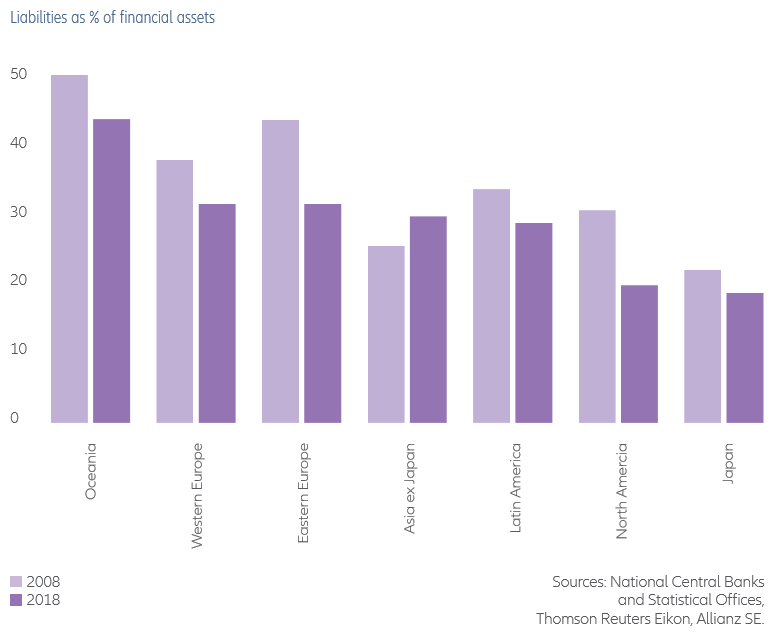
On a global scale, the level of indebtedness as a percentage of financial assets is 24.7% (versus 31.3% in 2018).
There has been a substantial reduction in the last 10 years in all regions except Asia-ex-Japan where it rose from 25.3% to 29.5%.
In Eastern Europe there was a drop to 31.3% and in Latin America to 28.6%.
In advanced countries this leverage ratio is 23.8%, being higher in Oceania with 43.4%, close to 30% in the USA and Western Europe and 18.6% in Japan.


