


The determinants of long-term stock market returns: the PER or even better the PE CAPE Schiller, the equity risk premium (ERP) and interest rates
The main determinants of the performance of stock market returns in the medium and long term
The importance of evaluation multiples such as PER and the little influence of some macroeconomic variables
The correlation between profitability and the evaluation multiples of the Shiller PE and PER
To make money in the trade what we need to do is “buy cheap and sell expensive”.
This truth also applies to investments, but with a single big difference. Time has a cost.
Buying today and selling a year from now at the same price makes us miss the rising cost of money that year.
In investments, this cost is reflected in the interest rate of bonds and the expected rate of returns of stocks.
The cheaper we buy, the more we make in business.
In other articles we have seen that it is not easy to choose the best moments of the markets or to make “market timing”.
The cost of trying to do it is so high that it’s not worth following that path.
In addition, investments in financial markets, either in stocks or bonds markets, present conditions that already make them sufficiently attractive.
However, it is worth investigating what factors increase the chances of success of our investments.
That is, “what can we do to buy cheaper”?
Knowing that markets have cycles and that they revert to the average what we want to know is whether we can identify the beginning of a very positive cycle or a bull market.
There is an unquestionable truth.
The principle of the best bull markets occurs after a big fall.
The deeper the previous fall or financial crisis, the greater the gains in its recovery.
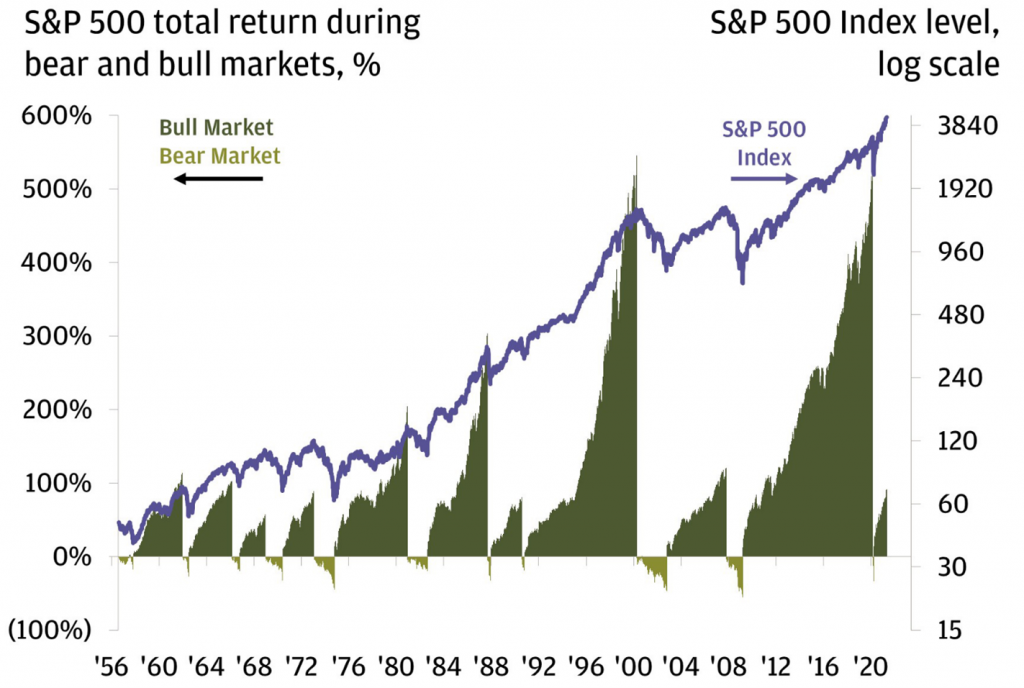
That is why many others consider that the best buying opportunities are in times of very deep crises.
“Buy when there’s blood on the streets, even if the blood is yours.” Victor Rothschild, 3rd Baron of Rothshild
In this article we will see if there are factors that allow us to identify whether the market is cheap or expensive.
To this end, we will analyze the relationships between the main stock market index, the S&P 500 index and some factors that may influence it.
The main determinants of the performance of market returns in the medium and long term
There are many studies and various theories on the main determinants or factors that best predict the performance of stock markets in the medium and long term.
The basic and irrefutable theory is that the stock market, like any other, is governed by the laws of supply and demand, so prices reflect this relationship.
Thus, the higher the demand for supply, the higher the prices and vice versa.
Both supply and demand are dynamic.
The offer is more stable, depending on the context of the business.
But more attractive market prices mean that more private companies are tempted to enter the market.
Demand is more volatile, depending on a multitude of factors such as the general economic context, especially wealth, employment and hosehold financial health.
But what is important is to know effectively what values determine the evolution of stock prices by joint action of supply and demand.
Over the years several theories have been advanced.
The theory of efficient markets of Paul Samuelson and his followers who consider the market price reflects at every moment the correct value and next to the stocks.
To that extent, past prices have no effect on future prices.
Market prices are “martingales”, a mathematical series in which the best predictor of the next number is the current number.
According to this theory, market prices follow a random path, in which future prices are those of today with a small positive or negative increase given by volatility.
The theory of the value of French and Fame and its followers that considers that the markets are not fully efficient, being possible to buy cheap to sell more expensive.
Studies show that these misadjustments and price deviations exist although without explaining why.
It was concluded that the price multiples on the book value (BV) and the price earnings ratio (PER) explain the future returns.
As prices are one of the factors of these valuation multiples, this theory gives consistency to the idea that the stock market reverts to the average.
Additionally, there are studies that point to the idea of “momentum”, in which investment is positively correlated with market returns.
When the stock market rises, investors and investment increase, creating a virtuous circle.
Vanguard published a study in 2012 that looked at the proportions of real-term returns fluctuations of stocks that were explained by various metrics between 1926 and 2011, concluding by the following correlation:
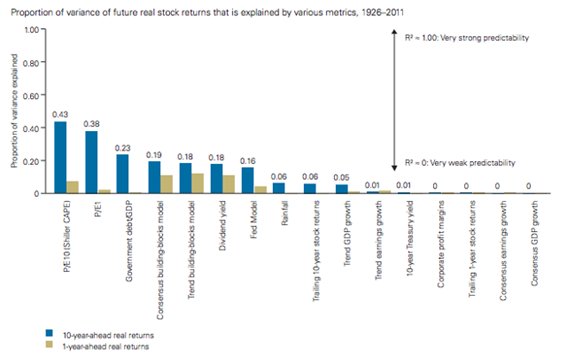
The correlations between the metrics of the evaluation multiples, such as CAPE (or Shiller PE) and PE and stocks returns variance, were significant and reasonably high, explaining about 40% of profitability (confirming Robert Shiller’s study).
Correlations of returns variance with debt-to-GDP ratio, analyst consensus models, trend models, dividend yield and the FED model (difference between earnings yields and treasury bonds yields) were low.
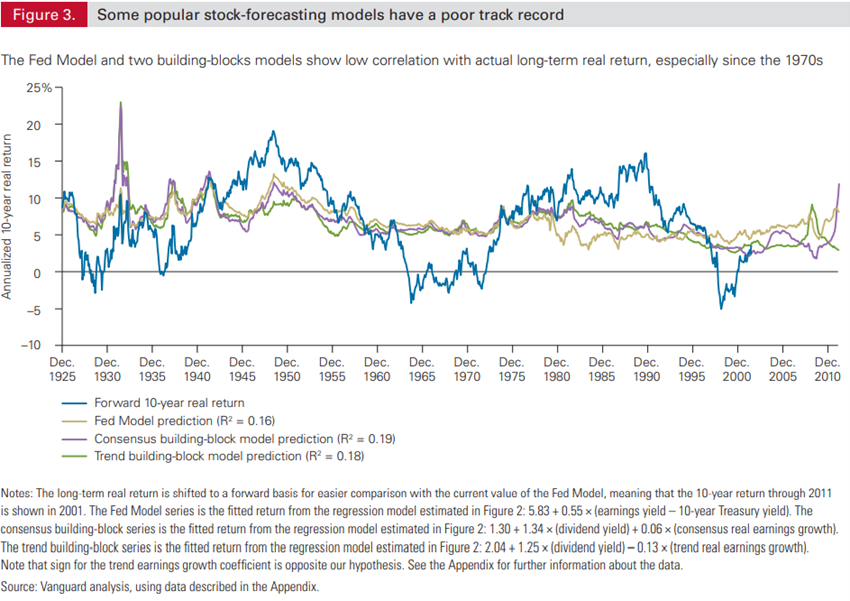
Finally, there was no correlation with past returns (in the short and long term), GDP (whether trend or current growth), earnings growth or profit margins, and yield rates of 10-year treasury bonds.
This study is found at the following link:
https://fairwaywealth.com/wp-content/uploads/Vanguard-Research-11-30-2014.pdf
It is worth mentioning that the influence of PER multiples on the S&P 500 index is also observed at the level of each individual stock.
In fact, there are many studies with the same purpose that focus on comparative analyses of individual stocks and validate these conclusions (after all, the index is no more than a set of 500 individual actions).
In these terms, it is very important to understand what influences and determines the PER.
This topic will be addressed in other articles on the valuation of the market and individual stocks.
The correlation between profitability and the evaluation multiples of the Shiller PE and PER
Shiller PE fixes one of the main problems of the simple PER multiple.
When there is a recession, stock prices fall, but the companies earnings also fall a lot, temporarily raising the PER, when it may be time to buy at lower prices.
Shiller’s PE divides the value of the index by the average of earnings of the companies of the last years adjusted by inflation, which softens those sudden effects.
The Shiller PER is known as the PER adjusted to the economic cycle because it considers the earnings of the last economic cycle instead of a single year, good or bad.
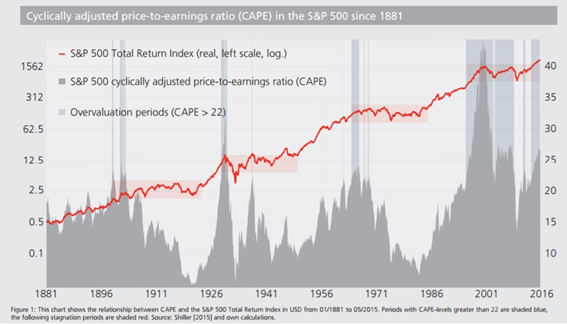
Star Capital published a set of studies in 2014 and 2016 developing Shiller’s study globally, extending it to various geographies.
In the following chart, for the S&P 500 between 1881 and 2016, we see that when the Shiller CAPE is very high (above 22) returns in the following decades are low (periods from 1900 to 1920, 1930 to 1950, 1960 to 1985 and 2000 to 1015):
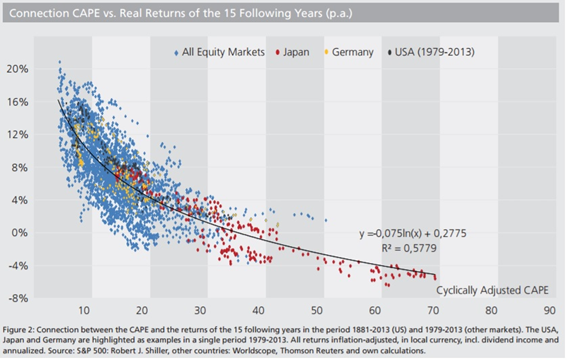
In terms of global stock markets, there is a strong inverse relationship between CAPE and returns for the following 15 years:
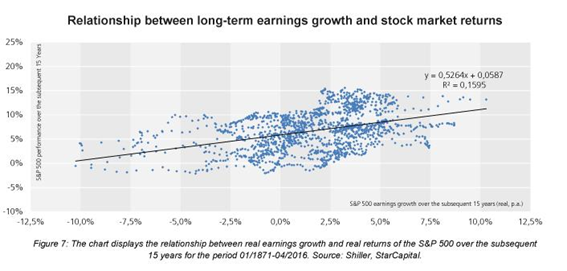
This study also showed that the correlation between company earnings and long-term yields (15 years) is low:
Another indicator closely followed by some asset managers, including Warren Buffett, is the relationship between the S&P 500’s stock market capitalization and US GDP:
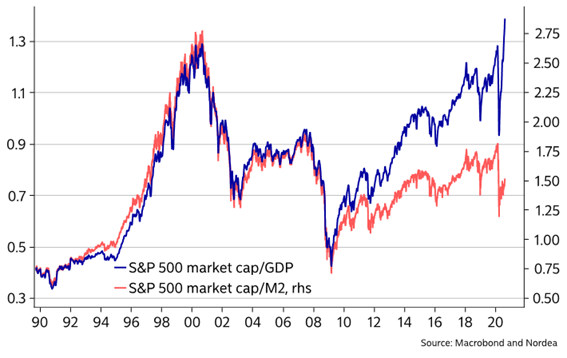
Proponents of this metric consider that the market is overvalued when this ratio is greater than 1 times and undervalued when it is below 0.7 times.
This indicator also has a strong correlation with the PER.
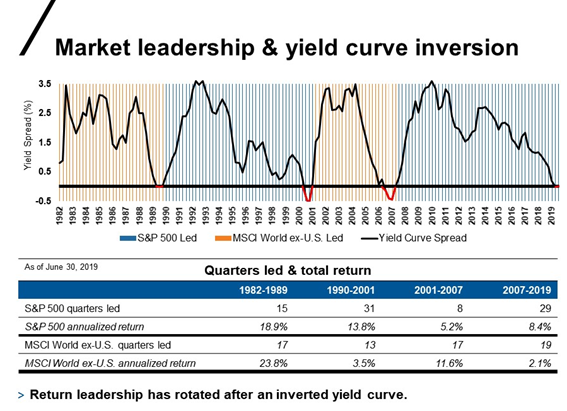
Finally, there are studies that point to the influence of the reversal of the slope of the U.S. interest rate curve (difference between the interest rates paid by the 10- and 2-year treasury) on the relative attractiveness or the comparative yields between the U.S. markets and the other developed markets:


