This is the second part of an article that develops the theme of inflation.
In the first part we saw how we should do the accounts for inflation, the costs of inflation and the inflationary spiral and the main measures of inflation.
In this second part, we will look at the main components of inflation, inflationforecasts and expectations, as well as the economic and investment consequences.
Main components of inflation
Inflation forecasts and inflationary expectations
Inflation forecasts based on indicators and models or economic studies
Inflationary expectations, implied market inflation or inflation estimated by economic agents
Central bank action to lower inflation
Risks of stagflation and recession
Implications of inflation for the management of our investments
Main components of inflation
In order to understand inflation, we must break it down and analyse the evolution of its main components.
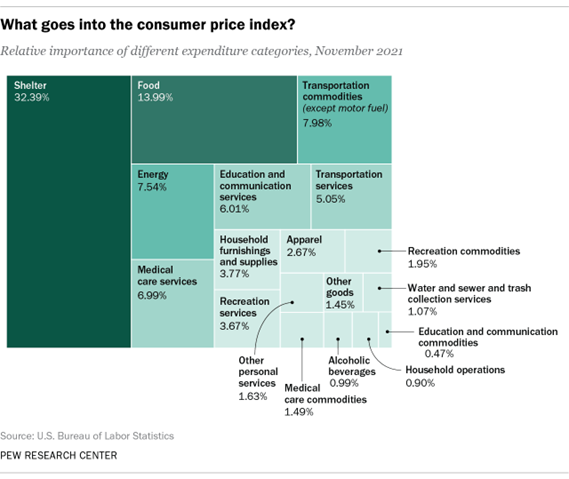
In the case of the US, expenditure in more than 200 categories, organized into eight large groups, comprising food and beverages, housing, clothing, transportation, medical care, recreation, education and communication, and other goods and services, and including in prices the respective taxes and fees, is considered.
The weights of the various components of inflation in the USA are as follows:
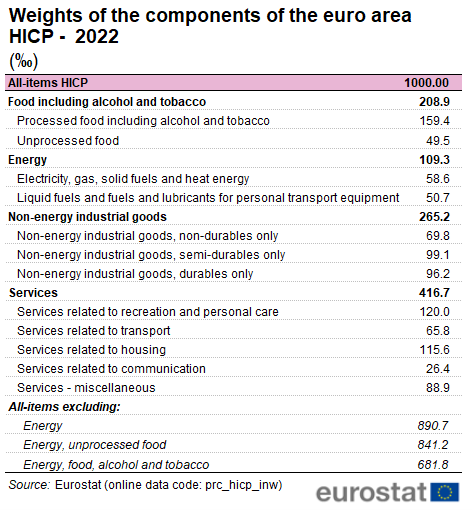
In the Eurozone, the various components of inflation have different weights:
Not only are the components different, but their price increases also differ in the various economies.
As a result, inflation decomposition and inflationary pressures are different.
Inflationary pressures in the U.S. are:
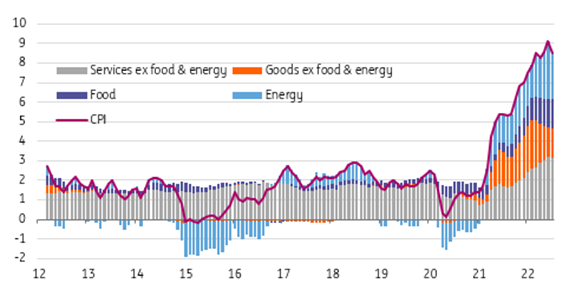
The biggest pressures are services, energy, food and other goods, the first showing a growing trend (particularly in terms of housing and health).
In the Eurozone, inflationary pressures are:
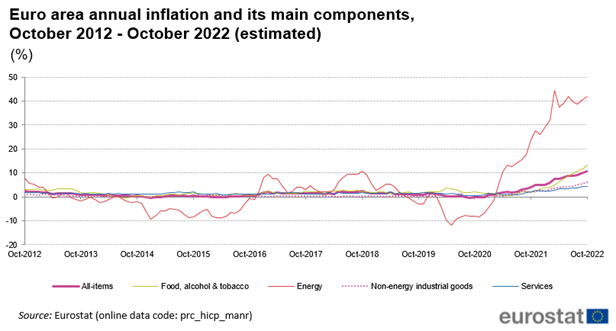
The biggest pressures are energy, food, other goods and, finally, services.
Inflation forecasts and inflationary expectations
As we said, it is very difficult to predict the evolution of inflation.
There are very volatile components and some economic effects take time to take effect (time lags).
There are two major types of inflation forecasts.
We have inflation predicted by international and national entities and bodies, based on economic and financial studies developed for this purpose, and which are supported by advanced indicators and/or projections of the evolution of the main components of inflation.
At the same time, there is also the expected inflation that is implicit in the financial markets and that resulting from surveys of economic agents, which are called inflationary expectations. These are very important to prevent or not the formation of an inflationary spiral.
Inflation forecasts based on indicators and models or economic studies
In relation to inflation projections resulting from studies the variety is large.
A useful and widely used advanced indicator is that of producer prices.
In the USA, producer prices have had the following evolution:
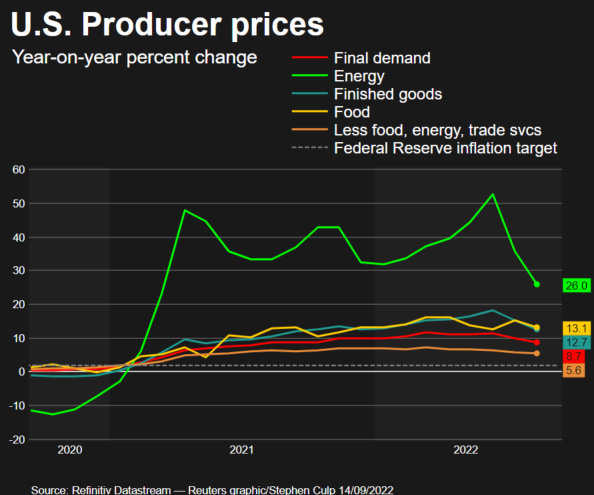
Producer prices in the U.S. are about 12% a year for most goods, as an exception to more than 20% in energy. The trend of the various components is downward.
In the Eurozone, producer price developments have been:
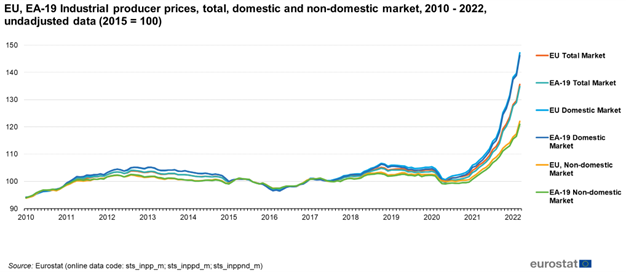
The price increase in the last year is much more pronounced, and the trend continues to rise.
Another indicator used is wage inflation, as we saw earlier.
In the U.S., wage developments have been:
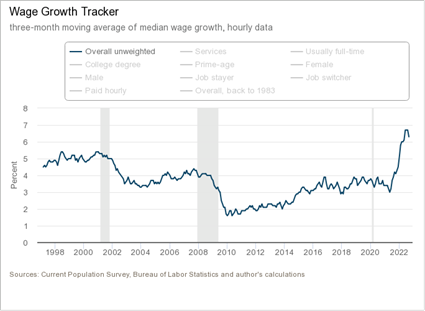
Wages have grown at almost 7% a year and seem to stabilize.
In the Eurozone, wages have evolved as follows:
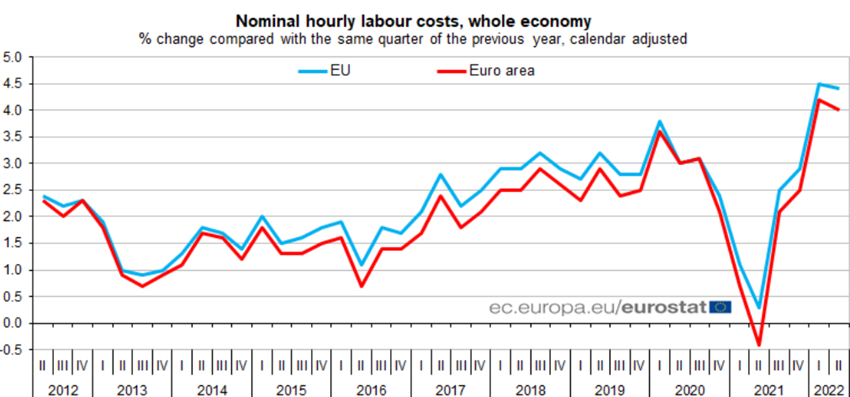
Wages have grown at 4% a year and also seem to stabilize.
There are also the most elaborate inflation projections made by the various official, international entities such as the IMF, the World Bank, the OECD and the European Union, and national ones, such as governments and central banks.
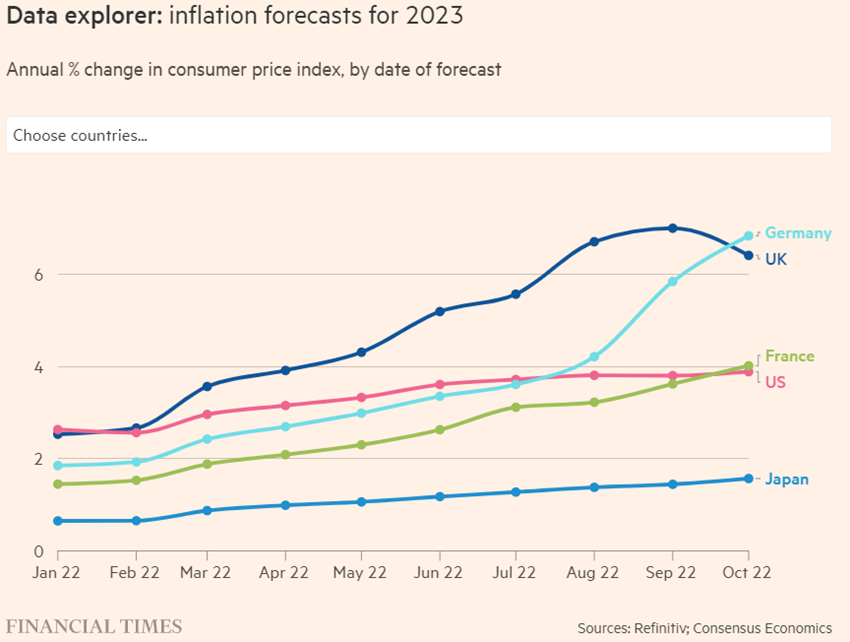
The Financial Times and Knoema maintain up-to-date databases on the inflation forecasts of various entities, which we can access at the following links:
https://www.ft.com/content/088d3368-bb8b-4ff3-9df7-a7680d4d81b2
https://pt.knoema.com/kyaewad/us-inflation-forecast-2022-2023-and-long-term-to-2030-data-and-charts
https://pt.knoema.com/zobdrl/euro-area-inflation-forecast-2019-2024-and-up-to-2060-data-and-charts
Inflationary expectations, implied market inflation or inflation estimated by economic agents
The current medium-term inflation forecasts implied in the market are:
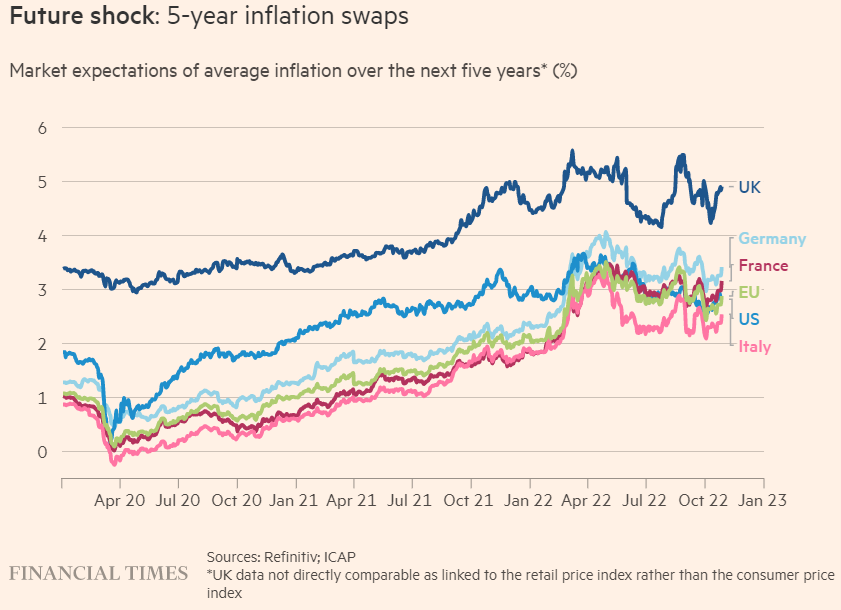
The average annual inflation forecast for the next 5 years is 2.5% in the Eurozone and US, 3% in Germany and almost 5% in the UK.
Expectations of average 5-year annual inflation rose through April as inflation increased, and has stabilized since then.
These forecasts are the result of market transactions made by investors that are based on estimates of the evolution of the main components.
In this way, there is close monitoring of indicators such as energy prices, food prices, rents, house prices, industrial production prices, etc.
The following graph shows the evolution of annual inflation and short- and long-term annual inflation expectations in the US since 1982:
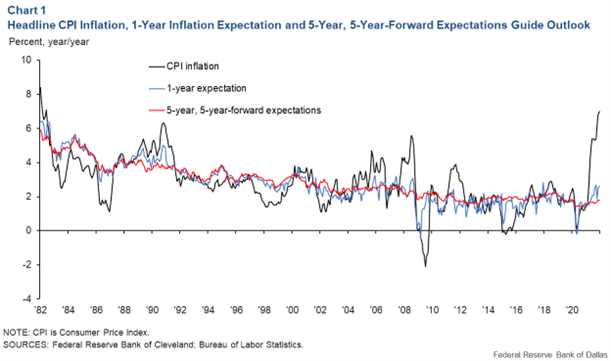
Short-term expectations are based on a model that uses market data and surveys. Long-term average annual inflation expectations – for a 5-year period starting in five years’ time – use market data.
Since 1986, inflation expectations have remained stable and anchored between 2% and 4%, despite the moments of increased volatility of annual inflation, such as in the early 1990s or between 2006 and 2008.
Central bank action to lower inflation
As we have seen, the economic policy most used to fight inflation is monetary, because the fiscal should be used to support and protect the most vulnerable from the effects of inflation and the economic slowdown.
To combat inflation, central banks must remove excess liquidity from the economy by raising interest rates and selling assets on their balance sheet, and thereby reducing the supply of currency.
Since the end of 2021, the FED has dramatically slowed the money supply growth:

Risks of stagflation and recession
The braking of high inflation reduces economic growth and can even lead to stout, more or less prolonged periods of high inflation accompanied by low growth.
Stagflation occurred between the two oil shocks of 1974 and 1983:
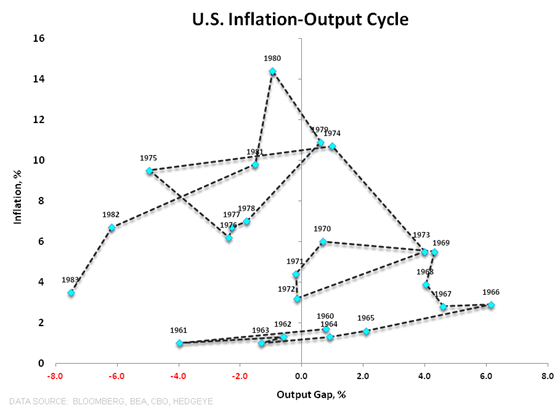
In this period of almost 10 years, inflation reached values between 5% and almost 15% and economic growth was very low, lower by 2% to 4% per year of the potential product.
There is also the possibility of economic recession if the effects on economic growth are stronger.
In the following chart we see that there was recession in periods when the interest rate of treasury bonds was below the inflation rate:
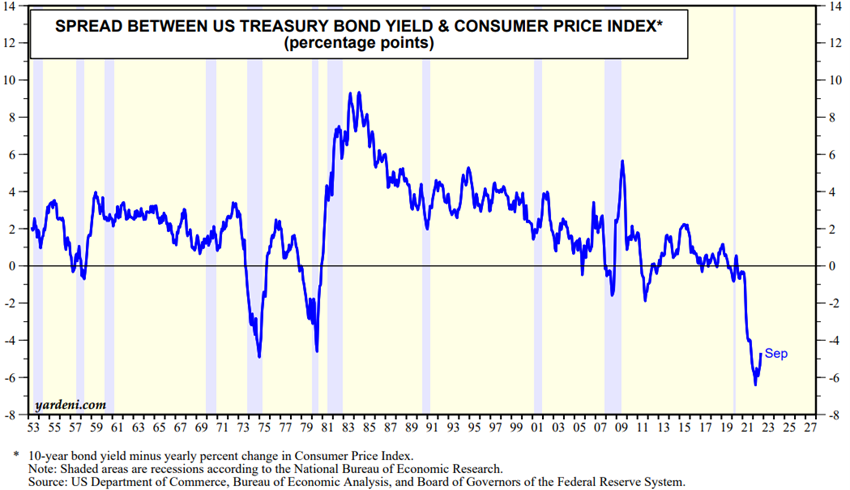
The current probabilities of economic recession are very variable.
In general, recession is considered inevitable in Europe, which has been hit hardest by the war in Ukraine.
For the US, there are studies that indicate that the probability of a recession is marginal, less than 1%, while others point to a probability of 97%, or a near certainty:
https://fred.stlouisfed.org/series/RECPROUSM156N
https://www.newyorkfed.org/medialibrary/media/research/capital_markets/Prob_Rec.pdf
https://www.conference-board.org/research/economy-strategy-finance-charts/CoW-Recession-Probability
Just as or more important than knowing if there will be recession is assessing its severity. To do this, it is necessary to look at its depth and duration, i.e. what the contraction of economic growth and employment will be and how long it will last.
Currently, it is considered that if there is a recession in the USA, the severity will not be great, given the starting situation in the labor market and the good financial capacity of families and companies.
In this way, to exist, it will be a soft and temporary recession. Moreover, this is precisely why the probability of recession is so low according to some models.
Implications of inflation for the management of our investments
We have already developed the implications of inflation in our investments in a great deal of depth.
In essence, the main impacts are increased volatility and the devaluation of investments in real and even nominal terms.
Rising interest rates and economic slowdown lower prices on financial assets, both bonds and stocks.
In bonds, the relationship between interest rates and prices is direct and inverse.
In stocks, in general, the relationship is also inverse, but indirect, through the decrease in revenues, compression of results, and increase in the cost of capital.
In previous articles we have seen how the various assets behave in an inflationary and interest-raising context and how we should act in this framework.
In a synthetic way, the recommendation covers three vectors of action.
First, stay on course and avoid impulsive behavior, that is, not make drastic changes to investments.
Second, rebalancing, especially because volatility is too high.
Third, revisit asset planning and allocation, analyse the impact on financial capacity and risk tolerance, and reassess the situation accordingly.
Fourth, make small adjustments to investments, replacing part of the exposure to the most volatile assets with an increase in the most stable ones, such as some growth-to-value rotation, exchanging speculative credit risk for better quality credit, etc.


