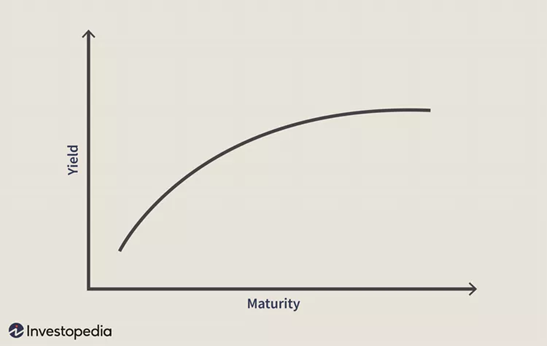
A yield curve is a line that plots the yields, or interest rates, of bonds that have the same credit rating but different maturity dates.
In other words, yield curves plot the interest rates on bonds of equal credit and of different maturities.
The U.S. Treasury yield curve refers to a line chart that represents the yields on short-term Treasuries compared to yields on long-term Treasuries.
The chart shows the relationship between interest rates and maturities of U.S. Treasury fixed-income securities.
The Treasury yield curve is also called the maturity structure of interest rates.
The slope of the yield curve can predict future changes in interest rates and economic activity.
There are three main forms of yield curve, a normal upward sloping curve, an inverted downward curve, and a flat curve.
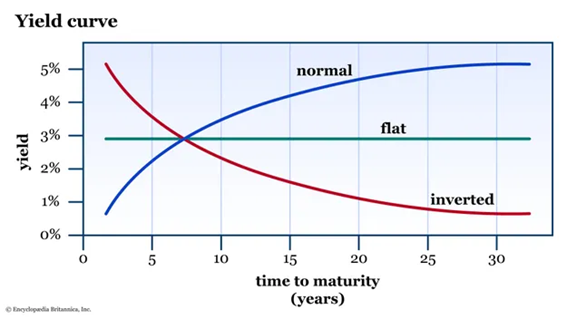
The normal curves point to economic expansion and the downward curves point to economic recession.
Yield curve rates are posted on the U.S. Treasury Department’s website each trading day.
A normal yield curve shows low yields for shorter-dated bonds and then increases for longer-dated bonds, tilting upward.
This curve indicates that longer-term bond yields continue to rise, responding to periods of economic expansion.
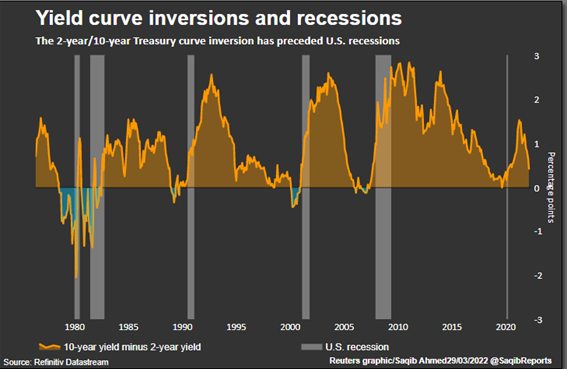
An inverted yield curve tilts downward, with short-term interest rates exceeding long-term rates.
This yield curve corresponds to periods of economic recession, in which investors expect yields on longer-dated bonds to tend to fall in the future.
In an economic downturn, investors looking for safe investments tend to buy longer-term bonds instead of short-term bonds, increasing the price of longer bonds and lowering their yield.
A flat yield curve reflects similar yields over all timeframes, implying an uncertain economic situation. Some intermediate maturities may have slightly higher yields, which causes a slight hump to appear along the flat curve. These bosses are usually for medium-term maturities, from six months to two years.
Investors can use the yield curve to make predictions about the economy to make investment decisions.
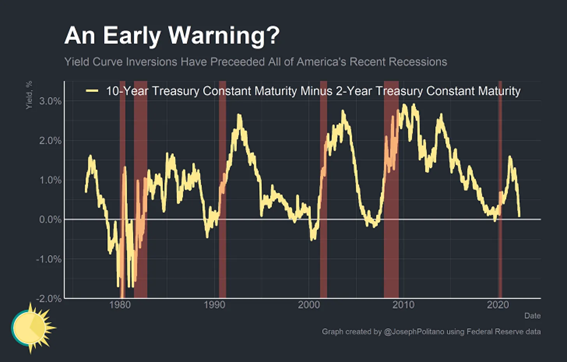
If the bond yield curve indicates an economic slowdown, investors can move investments to defensive assets that traditionally behave better during a recession.
If the yield curve becomes steep, it could signal future inflation. In this scenario, investors can avoid long-term bonds whose yield will erode as prices rise.
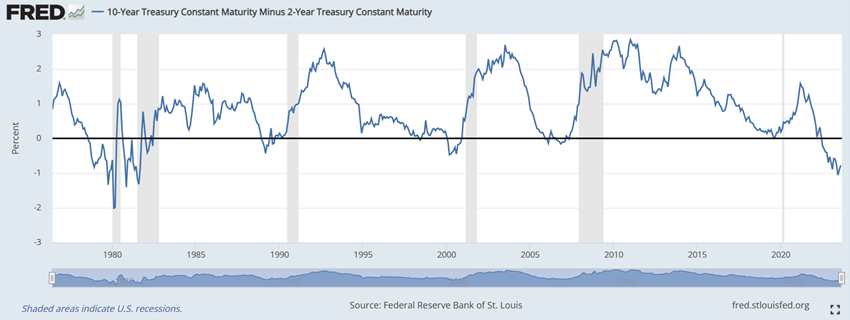
Access: https://home.treasury.gov/policy-issues/financing-the-government/interest-rate-statistics


