


In the very long run emerging equities markets performance has been much lower, but in the last 50 years the situation has completely changed. More recently they seem to be in a transition phase, closely following the pace of economic growth.
The emerging equity markets, from Asia ex-Japan, Latin America, and Eastern Europe, performed excellently between 1990 and 2010, far surpassing developed markets, giving rise to anachronisms such as BRIC, MINT, etc.
This was associated with higher economic growth and productivity gains rates in global and per capita terms because of rising commodity prices, increased world trade, changes in systems and models of economic development, such as greater liberalism, industrialisation and urbanization, and improvements in the functioning of financial markets.
This process seems to have been interrupted from 2014, with the economic slowdown and productivity declines. In 2020, there were signs of some recovery, especially in China.
The evolution of demography and the low cost of productive factors continue to provide a more favourable framework than that of developed countries, but the foundations of the past will not be sufficient. For performance to be sustainable again, increased globalisation, greater economic liberalism and the growth of the services sector will be necessary.
The economic dominance exercised by the East in the first 1850 years seems to be back our days.
In the last century, the annual returns of emerging markets equities have fallen well short of those of developed markets, but since 1970 the situation changes.
Overall, from the mid-1980s onwards the performance of equity emerging markets was higher than the one of developed markets, especially during positive market cycles, but suffered more marked losses during crises.
The emerging markets are not all the same as they looked before, because now there are different dynamics in the largest countries: started with BRIC, went through MINT, etc. and China, India, Asia EM ex- China, Russia, Eastern Europe, Brazil, and Mexico, rest Latin America (consumers and producers, raw materials, and industries).
What is to be expected of emerging markets?
The economic dominance exercised by the East in the first 1850 years seems to be back our days.
The following graph gives us an overview of the distribution of the world economic product by regions in these 2 millennia:
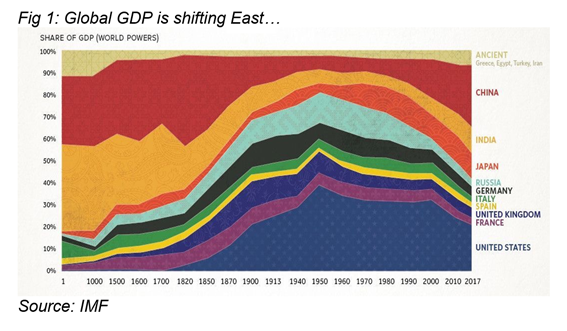
Economic history teaches us that at the beginning of civilization Asia held economic power, exerting its influence in the world with the routes of the sea, and then of the spices, possessing India and China 70% of the world’s product.
From 1500, Europe, with some peace, the epic of discoveries and the construction of empires, namely France and the United Kingdom, began to gain power, which came to be reinforced with the Industrial Revolution in 1770.
The independence and creation of the United States at the end of the 18th century, a new, vast, and rich country in various natural resources, led from an early age to a position of increasing preponderance, reinforced with its role in the 2nd Industrial Revolution and later by avoiding the aftermath of the great world wars that ravaged Europe.
The most powerful economic growth moved back to the East from 1950, with Japan’s post-war recovery, known as the Japanese miracle, and the industrialization, urbanization, and introduction of China’s economic liberalism in 1980 with the reforms of Deng Xiaoping.
The next chart shows GDP developments by regions over the most recent 50 years:
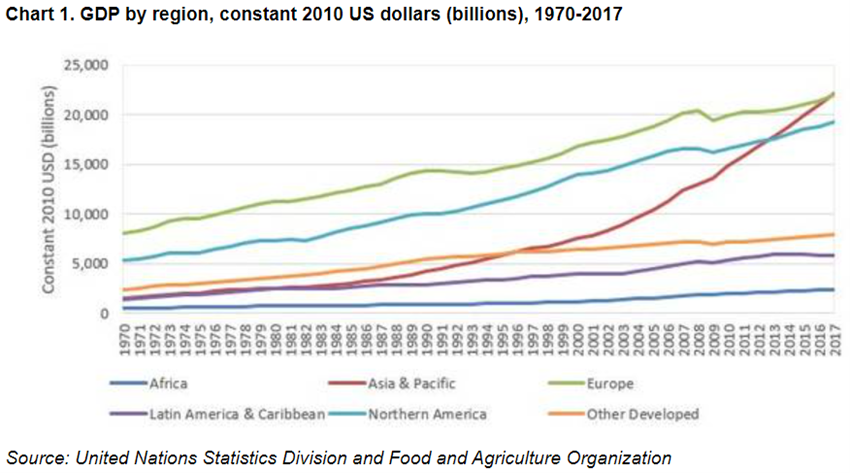
What stands out most is the great convergence and even overtaking of the economic product, at constant prices, from Asia and the Pacific vis-à-vis the USA and Europe in the early 2010s, starting from a much lower position in 1970.
In the last century, the annual returns of emerging markets equities have fallen well short of those of developed markets, but since 1970 the situation changes.
The following chart shows the returns of investment in emerging and developed equity markets between 1900 and 2013:
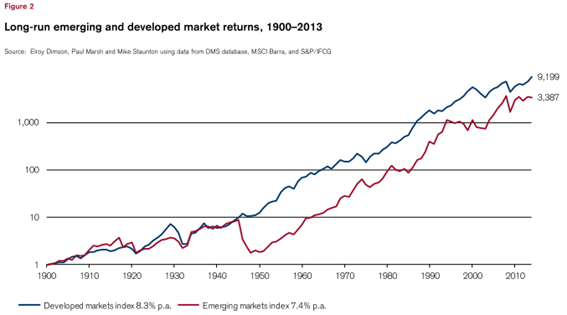
In this 113-year period, a dollar invested in developed markets would have resulted in $9,199 versus $3,387 in emerging markets, more than a third, although developments were not linear.
Emerging equity markets performed very much in the same way as developed markets between 1900 and 1945, although both with a weak record, but a significant record loss in the first 5 years after the war. After 1950, phase with a more significant appreciation of the world’s equity markets, emerging markets resumed an upward trend, although without convergence until the mid-1970s, a time from which they perform better.
The following chart shows the annual returns for 10-year periods of emerging markets between 1936 and 2017:
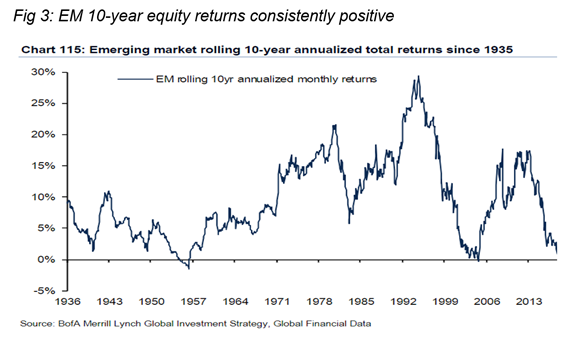
Average annual returns for 10-year periods until the end of the 1950s were low, being even negative in the 10 years after World War II, but from then on they increased and peaked at 30% per year around 1995. They then started a movement of decline up to 0% in 2005, when they resumed the rise to values of 15% in 2013, after which they recorded another abrupt drop in insignificant annual returns.
The following graph shows that in the last 50 years, the performance of emerging markets has been higher than in other regions:
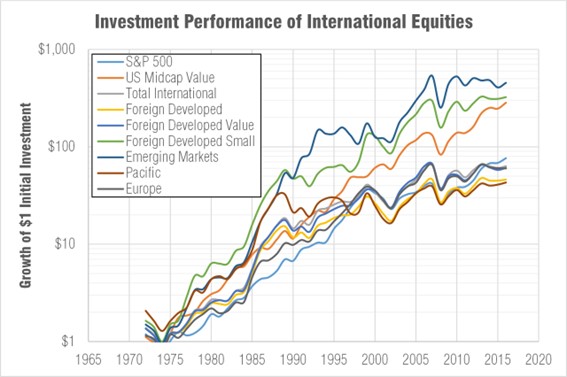
Emerging equity markets recorded a higher capital growth than the remaining equity markets between 1970 and 2016.
The higher returns of emerging markets were associated with higher volatilities:
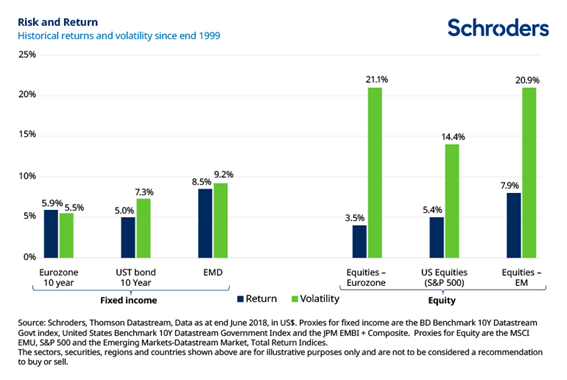
The chart above compares the returns and volatility or risk in the US, Europe, and Emerging equity markets (right) and fixed income markets (left) between 1999 and 2018.
We see that in this period emerging markets recorded higher returns, but also higher risk when compared to the US markets. In terms of the equity markets, the average annual returns of emerging markets were 7.9%, surpassing 5.4% in the US and 3.5% in Europe, but volatility was 20.9%, up from the US 14.4% and virtually equal to the European one.
Overall, from the mid-1980s onwards the performance of equity emerging markets was higher than the one of developed markets, especially during positive market cycles, but suffered more marked losses during crises.
The factors that worked in the past, such as abundance of human capital, social climbing, or enrichment, are not enough.
The following graph shows the relative evolution between emerging and developed equity markets between 1988 and 2019:
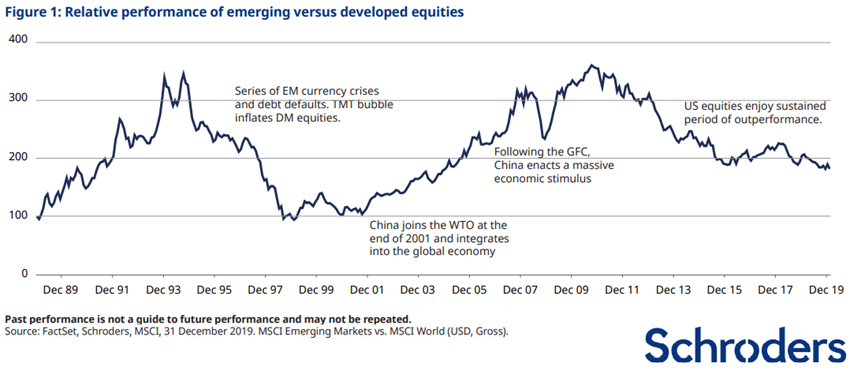
In this period equity emerging markets performed almost the double of developed markets in dollars. The appreciation of emerging markets was 4 times higher between 1988 and 1996, but then lost almost all the advantage until the tech bubble. From 2002 on, they again recorded a very sharp appreciation, once again 4 times more until 2012, losing their advantage again until 2015, when they stabilized.
The comparison between emerging markets and the US equity market evolution is still also contrasting:
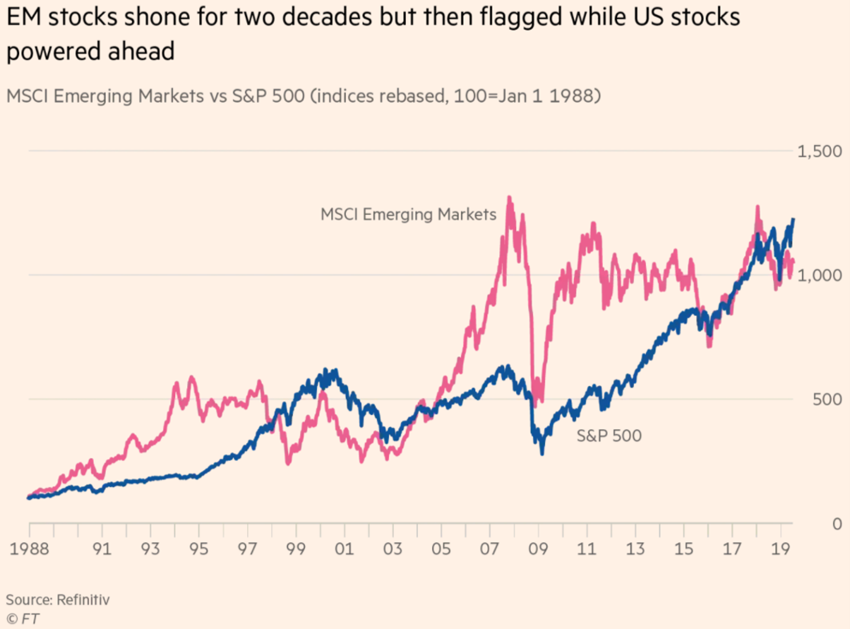
Overall, equity emerging markets were more profitable during positive cycles, although they suffered greater losses in crises, such as the great technology bubble of 2000 and the Great Financial Crisis of 2007, showing that they were much more volatile.
However, this reality has changed in the most recent positive cycle. The recovery from the last crisis from 2009 showed a better performance of emerging markets compared to the US market until 2011, but while it continued an upward trajectory, the emerging markets slide lined and even regressed in 2015, and then resumed the rise.
The chart allows a better view of the lag in the performance of emerging markets compared to those developed in this last cycle:
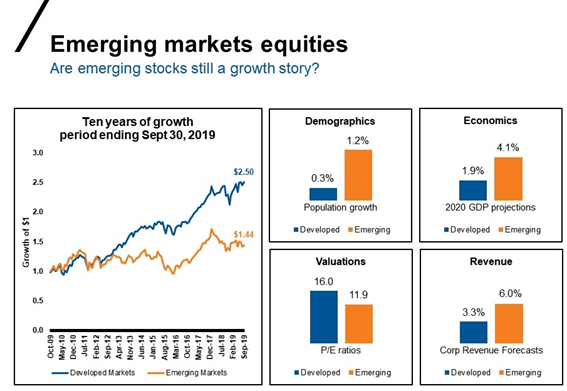
Over the past 10 years, equity developed markets have increased by 150% while emerging markets have only grown by 44%.
The following graph shows the evolution of emerging markets the US, and the other developed countries (comprising Europe-Australasia-Middle East) indices in this period:
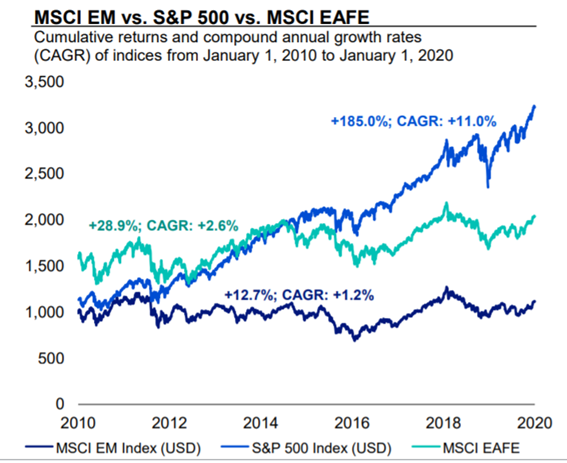
Between 2010 and 2020, the US had average annualized returns of 11% corresponding to an accumulated appreciation of 185%, while the rest of the developed world had returns of 2.6% and cumulative appreciation of 16.2%, and emerging markets were left for even more modest performances, annualized average returns of 1.2% and accumulated 12.7%. This has clearly been a strong US cycle, and weak emerging ones.
The following graph shows the performance of equity markets at the level of major developed and emerging economies between 2007 and mid-2018:
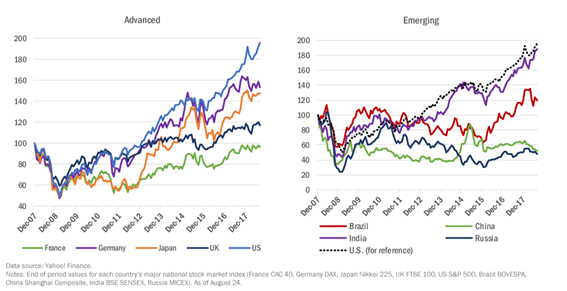
Regarding emerging markets, we see their poor performance in this period resulted mainly from China and Russia, two heavyweights in the index, countries with very weak performances, without even recovering the 2007 levels. India is the only economy that performed strongly, at the level of the US.
In developed countries we see the extraordinary performance of the US, as well as the good recovery of Germany and Japan, in contrast to the weakness of the UK and France.
The different performance of two of the main emerging markets is well evidenced in the following chart covering the period 2000-2018:
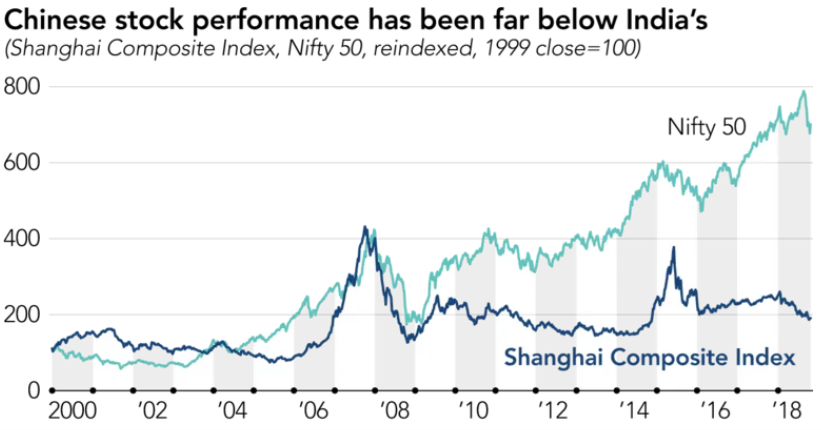
Developments in the major equity market indices of these economies show that India and China have similar performances until 2009, a year from which India sees a high progression and China stabilizes.


