• About us
    • Who we are
    • Mission
  • Contacts
  • English
    • Português (Portuguese (Portugal))
    • Español (Spanish)
    • Français (French)
  • Login
  • Register
Investorpolis
Advertisement
  • Home
  • Investing Series Guide
    • All
    • I. Goal Based Investing
    • II. Compounding & Inflation
    • III. Assets Risks & Returns
    • IV. Efficient Diversification
    • IX. Sustainable Investing and ESG
    • V. The Investor
    • VI. Assets and Investments
    • VII. Index Funds
    • VIII. Successful Investing
    • XI. Other Topics
    Simple Portfolio Series (DIY) Part 2: The Traditional Portfolio 60/40, what it is, for whom, and its performance

    Simple Portfolio Series (DIY) Part 2: The Traditional Portfolio 60/40, what it is, for whom, and its performance

    Simple or Lazy Portfolio Series (DIY): Part 1 – Overview

    Simple or Lazy Portfolio Series (DIY): Part 1 – Overview

    Choosing Mutual Funds Series: Part 5 – Funds availability and currency of investment

    Choosing Mutual Funds Series: Part 5 – Funds availability and currency of investment

    Maximize time invested in the stock market instead of market timing: Part 2. Impossibilities and losses (cont.)

    Maximize time invested in the stock market instead of market timing: Part 2. Impossibilities and losses (cont.)

    Maximizing time invested in the stock market instead of market timing: Part 1 – Biases and losses

    Maximizing time invested in the stock market instead of market timing: Part 1 – Biases and losses

    ESG Investing Series: Part 9 – Developments and models of corporate governance regulation in the world

    ESG Investing Series: Part 9 – Developments and models of corporate governance regulation in the world

    Trending Tags

      • I. Goal Based Investing
      • II. Compounding & Inflation
      • III. Assets Risks & Returns
      • IV. Efficient Diversification
      • V. The Investor
      • VI. Assets and Investments
      • VIII. Successful Investing
      • IX. Sustainable Investing and ESG
      • X. Kits and Tips
      • XI. Other Topics
    • Wealth and Investing
      • All
      • Investing
      • Wealth
      How Women invest: Part 2 – The results are equivalent to those of men, but with significant differences in investment management

      How Women invest: Part 2 – The results are equivalent to those of men, but with significant differences in investment management

      Outlook 2023: Part 5 – 2023 will be a transitional year with two halves

      Outlook 2023: Part 5 – 2023 will be a transitional year with two halves

      Outlook 2023: Part 4 – In changing economic cycle, policies, and market sentiment, valuation matters become more than ever

      Outlook 2023: Part 4 – In changing economic cycle, policies, and market sentiment, valuation matters become more than ever

      Outlook 2023: Part 3 – 2022 was bad for investments, but was not the same for everything

      Outlook 2023: Part 3 – 2022 was bad for investments, but was not the same for everything

      Outlook 2023: Part 2 – Investment losses in 2022 cost so much that sometimes we forget about previous gains

      Outlook 2023: Part 2 – Investment losses in 2022 cost so much that sometimes we forget about previous gains

      Outlook 2023: Part 1 – 2022 was a bad year for investments, but we can’t lose the medium and long-term perspective

      Outlook 2023: Part 1 – 2022 was a bad year for investments, but we can’t lose the medium and long-term perspective

      Trending Tags

        • Investing
        • Wealth
      • Retirement & Savings
        • All
        • Retirement
        • Savings
        Retirement Series: How much money do we need to live through retirement?

        Retirement Series: How much money do we need to live through retirement?

        Retirement Series: Part 1 – Overview – A backwards view

        Retirement Series: Part 1 – Overview – A backwards view

        How many years do our public or social pensions last?

        What is the replacement rate of retirement pensions?

        How many years will we live in retirement?

        Planning for a good financial life in retirement

        Trending Tags

          • Retirement
          • Savings
        • Tools
          • All
          • Calculators
          • Publications
          • Sites and apps
          Morningstar Rating for Funds

          Morningstar Rating for Funds

          Morningstar’s European Active/Passive Barometer

          Morningstar’s European Active/Passive Barometer

          Morningstar’s U.S. Active vs. Passive Barometer

          Morningstar’s U.S. Active vs. Passive Barometer

          The Power of Dividends: Past, Present, and Future, Hartford Funds, 2021

          The Power of Dividends: Past, Present, and Future, Hartford Funds, 2021

          OECD Corporate Governance Factbook 2021

          OECD Corporate Governance Factbook 2021

          G20/OECD Principles of Corporate Governance, 2015

          G20/OECD Principles of Corporate Governance, 2015

          Trending Tags

          • calculators
          • Calculators
          • Publications
          • Sites and apps
        • More
          • All
          • Best of
          Best Of Mutual Funds Series: Dividend Stocks for Investors Outside the U.S.

          Best Of Mutual Funds Series: Dividend Stocks for Investors Outside the U.S.

          Best Of Mutual Funds Series: Dividend Stocks for U.S. Investors

          Best Of Mutual Funds Series: Dividend Stocks for U.S. Investors

          Best Of Mutual Funds Series: Investment Grade Bonds, Indexed, for Eurozone Investors

          Best Of Mutual Funds Series: Investment Grade Bonds, Indexed, for Eurozone Investors

          Best Of Mutual Funds Series: US Bonds, Indexed, for US Investors

          Best Of Mutual Funds Series: US Bonds, Indexed, for US Investors

          Best Of Mutual Funds Series: Passive, US Large Stocks, for Non-US Investors

          Best Of Mutual Funds Series: Passive, US Large Stocks, for Non-US Investors

          Best Of Mutual Funds Series: Passive Large US Stocks for US Investors

          Best Of Mutual Funds Series: Passive Large US Stocks for US Investors

          Trending Tags

            • Best of
            • Reviews
            • Snapshots
            • Others
          No Result
          View All Result
          • Home
          • Investing Series Guide
            • All
            • I. Goal Based Investing
            • II. Compounding & Inflation
            • III. Assets Risks & Returns
            • IV. Efficient Diversification
            • IX. Sustainable Investing and ESG
            • V. The Investor
            • VI. Assets and Investments
            • VII. Index Funds
            • VIII. Successful Investing
            • XI. Other Topics
            Simple Portfolio Series (DIY) Part 2: The Traditional Portfolio 60/40, what it is, for whom, and its performance

            Simple Portfolio Series (DIY) Part 2: The Traditional Portfolio 60/40, what it is, for whom, and its performance

            Simple or Lazy Portfolio Series (DIY): Part 1 – Overview

            Simple or Lazy Portfolio Series (DIY): Part 1 – Overview

            Choosing Mutual Funds Series: Part 5 – Funds availability and currency of investment

            Choosing Mutual Funds Series: Part 5 – Funds availability and currency of investment

            Maximize time invested in the stock market instead of market timing: Part 2. Impossibilities and losses (cont.)

            Maximize time invested in the stock market instead of market timing: Part 2. Impossibilities and losses (cont.)

            Maximizing time invested in the stock market instead of market timing: Part 1 – Biases and losses

            Maximizing time invested in the stock market instead of market timing: Part 1 – Biases and losses

            ESG Investing Series: Part 9 – Developments and models of corporate governance regulation in the world

            ESG Investing Series: Part 9 – Developments and models of corporate governance regulation in the world

            Trending Tags

              • I. Goal Based Investing
              • II. Compounding & Inflation
              • III. Assets Risks & Returns
              • IV. Efficient Diversification
              • V. The Investor
              • VI. Assets and Investments
              • VIII. Successful Investing
              • IX. Sustainable Investing and ESG
              • X. Kits and Tips
              • XI. Other Topics
            • Wealth and Investing
              • All
              • Investing
              • Wealth
              How Women invest: Part 2 – The results are equivalent to those of men, but with significant differences in investment management

              How Women invest: Part 2 – The results are equivalent to those of men, but with significant differences in investment management

              Outlook 2023: Part 5 – 2023 will be a transitional year with two halves

              Outlook 2023: Part 5 – 2023 will be a transitional year with two halves

              Outlook 2023: Part 4 – In changing economic cycle, policies, and market sentiment, valuation matters become more than ever

              Outlook 2023: Part 4 – In changing economic cycle, policies, and market sentiment, valuation matters become more than ever

              Outlook 2023: Part 3 – 2022 was bad for investments, but was not the same for everything

              Outlook 2023: Part 3 – 2022 was bad for investments, but was not the same for everything

              Outlook 2023: Part 2 – Investment losses in 2022 cost so much that sometimes we forget about previous gains

              Outlook 2023: Part 2 – Investment losses in 2022 cost so much that sometimes we forget about previous gains

              Outlook 2023: Part 1 – 2022 was a bad year for investments, but we can’t lose the medium and long-term perspective

              Outlook 2023: Part 1 – 2022 was a bad year for investments, but we can’t lose the medium and long-term perspective

              Trending Tags

                • Investing
                • Wealth
              • Retirement & Savings
                • All
                • Retirement
                • Savings
                Retirement Series: How much money do we need to live through retirement?

                Retirement Series: How much money do we need to live through retirement?

                Retirement Series: Part 1 – Overview – A backwards view

                Retirement Series: Part 1 – Overview – A backwards view

                How many years do our public or social pensions last?

                What is the replacement rate of retirement pensions?

                How many years will we live in retirement?

                Planning for a good financial life in retirement

                Trending Tags

                  • Retirement
                  • Savings
                • Tools
                  • All
                  • Calculators
                  • Publications
                  • Sites and apps
                  Morningstar Rating for Funds

                  Morningstar Rating for Funds

                  Morningstar’s European Active/Passive Barometer

                  Morningstar’s European Active/Passive Barometer

                  Morningstar’s U.S. Active vs. Passive Barometer

                  Morningstar’s U.S. Active vs. Passive Barometer

                  The Power of Dividends: Past, Present, and Future, Hartford Funds, 2021

                  The Power of Dividends: Past, Present, and Future, Hartford Funds, 2021

                  OECD Corporate Governance Factbook 2021

                  OECD Corporate Governance Factbook 2021

                  G20/OECD Principles of Corporate Governance, 2015

                  G20/OECD Principles of Corporate Governance, 2015

                  Trending Tags

                  • calculators
                  • Calculators
                  • Publications
                  • Sites and apps
                • More
                  • All
                  • Best of
                  Best Of Mutual Funds Series: Dividend Stocks for Investors Outside the U.S.

                  Best Of Mutual Funds Series: Dividend Stocks for Investors Outside the U.S.

                  Best Of Mutual Funds Series: Dividend Stocks for U.S. Investors

                  Best Of Mutual Funds Series: Dividend Stocks for U.S. Investors

                  Best Of Mutual Funds Series: Investment Grade Bonds, Indexed, for Eurozone Investors

                  Best Of Mutual Funds Series: Investment Grade Bonds, Indexed, for Eurozone Investors

                  Best Of Mutual Funds Series: US Bonds, Indexed, for US Investors

                  Best Of Mutual Funds Series: US Bonds, Indexed, for US Investors

                  Best Of Mutual Funds Series: Passive, US Large Stocks, for Non-US Investors

                  Best Of Mutual Funds Series: Passive, US Large Stocks, for Non-US Investors

                  Best Of Mutual Funds Series: Passive Large US Stocks for US Investors

                  Best Of Mutual Funds Series: Passive Large US Stocks for US Investors

                  Trending Tags

                    • Best of
                    • Reviews
                    • Snapshots
                    • Others
                  No Result
                  View All Result
                  Investorpolis
                  No Result
                  View All Result
                  Home Investing Series Guide

                  How to evaluate stocks? Part 1: The factors that influence stock prices

                  21 de March, 2021
                  in Investing Series Guide, VI. Assets and Investments
                  Reading Time: 11 mins read
                  0 0
                  0
                  Como se avaliam as ações? Parte 1: Os fatores que influenciam os preços
                  Share on FacebookShare on Twitter

                  Stock prices and EPS, EY, DY, PER, PEG and PE CAPE Shiller

                  As stocks are shares of the capital of companies, thus giving the right to distributable economic earnings, the main valuation metrics focus on estimating these earnings and modeling the relationship between stock prices and the companies earnings

                  The main indicators are the Earnings Per Share (EPS) and the Price Earnings Ratio (PER) multiples

                  The most used multiple by the market for these comparisons is the Price Earnings Ratio (PER), given by the quotient between the share price and the earnings per share

                  There are also other widely used indicators for evaluating stocks, more dynamic than the PER: the Shiller CAPE PE and “Price Earnings Growth” (PEG) multiples 

                  As we will also see in another post that will tackle this subject there are two great methods or models of analysis and evaluation of equities: the fundamental and the technical.

                  The fundamental analysis method seeks to calculate a stock’s fair price based on estimating the ability to generate economic results.

                  The technical analysis method seeks to obtain a stock value through their historical statistical behavior of the evolution of its prices or similar stocks, researching patterns and frequencies, therefore using mostly graphs.

                  In this post we will focus exclusively on the main indicators of evaluation of fundamental analysis.

                  As stocks are shares of the capital of companies, thus giving the right to distributable economic earnings, the main valuation metrics focus on estimating these earnings and modeling the relationship between stock prices and the companies earnings

                  As we have seen, being a shareholder is being an investor who participates in corporate profits.

                  The stock quotes, of a set of stocks, or of the stock market index are determined by a multitude of factors, from the specific factors, inherent and that influence the activity of the companies themselves, and other external ones and that result from the economic environment, financial markets, and stock markets in general.

                  As is evident and is shown for the 500 largest US companies that make up its main stock market index, the S&P 500, in the long run there is a direct relationship between stocks valuation (left scale and blue line) and the companies’ earnings (right and line and orange):

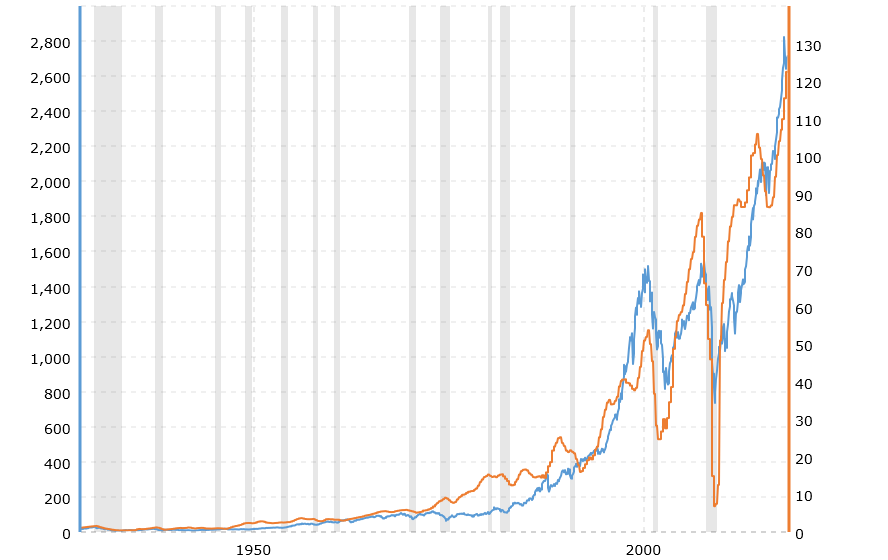
                  Source: Macro Trends, 1927-2020

                  In the previous chart, we see that while there is a good correlation between stock prices and the earnings per share of the companies that make up the S&P 500, it is not perfect. There is an evolution in the trend and in the long term, but with variations and deviations in shorter timeframes.

                  To simplify we can say that in determining the price of the stock or stocks there are two essential factors: a rational and quantifiable objective, given by the evolution of the companies’ earnings, and another more subjective, emotional or market feeling.

                  It is from the combination of these two factors that the various indicators or evaluation metrics are constructed.

                  The main indicators are the Earnings Per Share (EPS) and the Price Earnings Ratio (PER) multiples

                  Obviously, the most followed and used indicator is the earnings per share of companies or the “Earnings per Share” (EPS).

                  Analysts, managers, and investors follow very closely the information and communications of companies and those of all other financial community agents about earnings or others that influence them.

                  The peak focus and analysis happen at the quarterly presentation of earnings by companies. On these occasions, companies typically track earnings per share with details of revenues and costs for the quarter, as well as a view or prospects on revenues and earnings for the following quarter. 

                  The earnings presentation season begins in the second week of April, July, October and January and runs over three weeks in the US and begins in the last week of those months and lasts for two weeks in Europe.

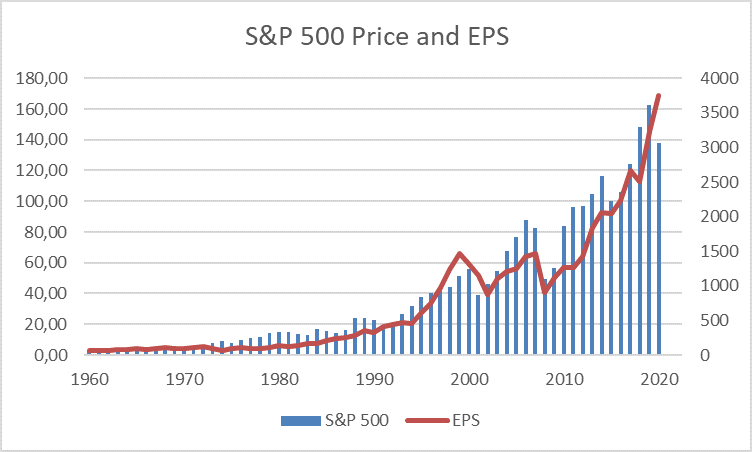
                  In the following chart we see the evolution of the S&P 500 index and its index in the period between 1960 and 2020: 

                  Another way to look at the EPS is to divide it by the share unit value, that is, by making the quotient between the earnings and the share price. This percentage gives us an implied rate of return on the stock investment or “Earnings yield” (EY).

                  For example, if the EPS is 5 u.m. and the quote is 100 u.m. that rate is 5%. This is already an indicator that allows you to make comparisons between companies or compare the same company at different times.

                  In the following chart we see the evolution of the S&P 500 and its EY over the past 20 years, as well as an analyst outlook for 2021:

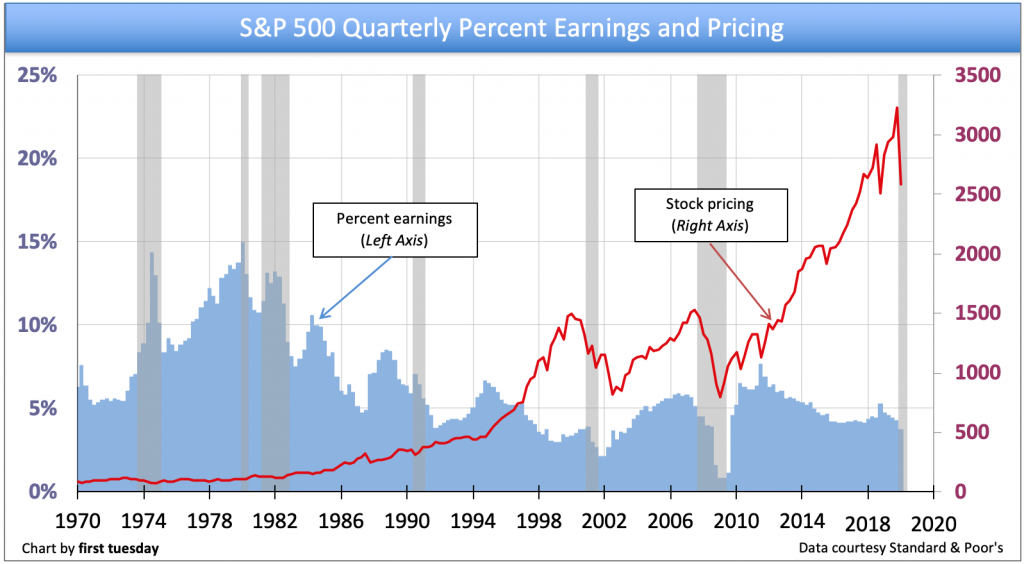
                  We see that the sharp rise the S&P index since 2012 has not been accompanied by a rise in earnings yields, on the contrary, as it has been falling to 5% levels.

                  This rate of return on shares is more comprehensive than any used in the past, but that has lately fallen into some disuse, the dividends rate of return.

                  The following chart shows the evolution of the S&P 500 ‘Earnings yield’ and dividend yields between 1960 and 2020:

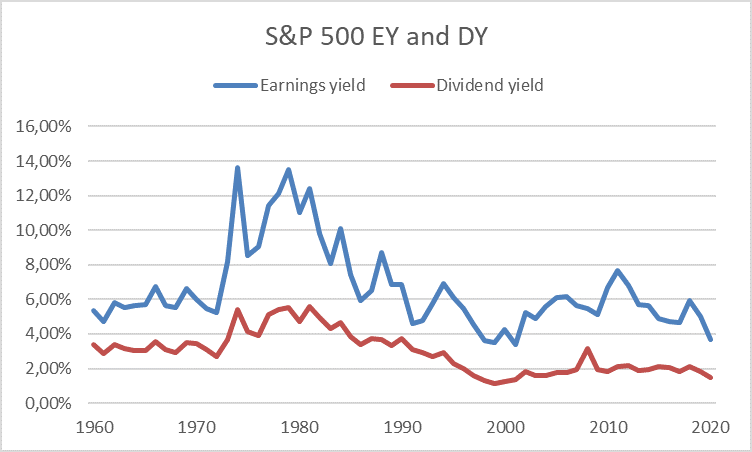
                  There were essentially two reasons why the interest in the “Dividend Yield” has been declining.

                  First, there are companies that generate a lot of earnings, but do not distribute them in the present, reinvesting them in the business, instead. They are usually companies with a strong pace of growth, with an expectation that these investments will produce higher future earnings, and by this way, better dividends.

                  Second, in the past most companies have adopted a standard or a rule of distribution of earnings in dividends, which is the only retribution made to shareholders. Today it is no longer so, since many companies repurchase their own shares, which is a form of distribution of value because there are fewer shares in circulation for the same business value.

                  This stocks rate of return is useful in various circumstances, such as for comparisons between stocks or the same stock in different periods and even for comparison with the rate of return of other assets, in particular bonds.

                  The following chart shows the implied yield rate of return of S&P 500 companies and the 10-year Treasury bond yield rate between 1960 and 2020:

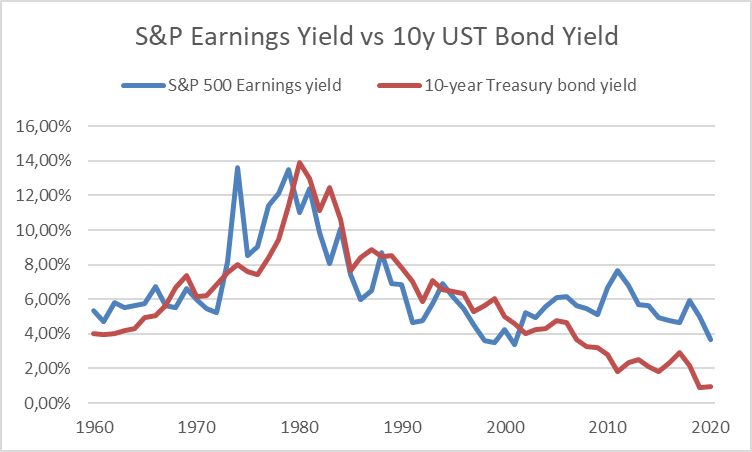
                  We see that since 2002 the Earnings yield has been higher than the Bond yield with a difference that currently is about 4%.

                  The most used multiple by the market for these comparisons is the Price Earnings Ratio (PER), given by the quotient between the share price and the earnings per share

                  This can be read as the number of years that the investor is willing to wait for the earnings generated by the company to pay for his investment. For example, if a stock is trading at a PER of 12 means that the company takes 12 years of earnings to pay the share price at that time.

                  The following chart shows the evolution of the PER between 1872 and 2020 for the S&P 500:

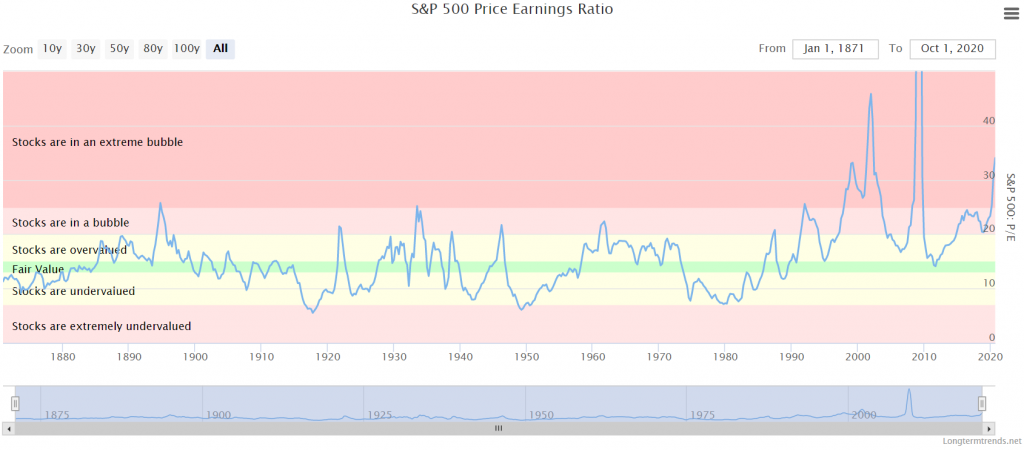
                  Source: Longtermtrends

                  In this period, the average PER was about 15x.

                  The following chart shows the evolution of the S&P 500 PER for a more recent period between 1995 and 2020: 

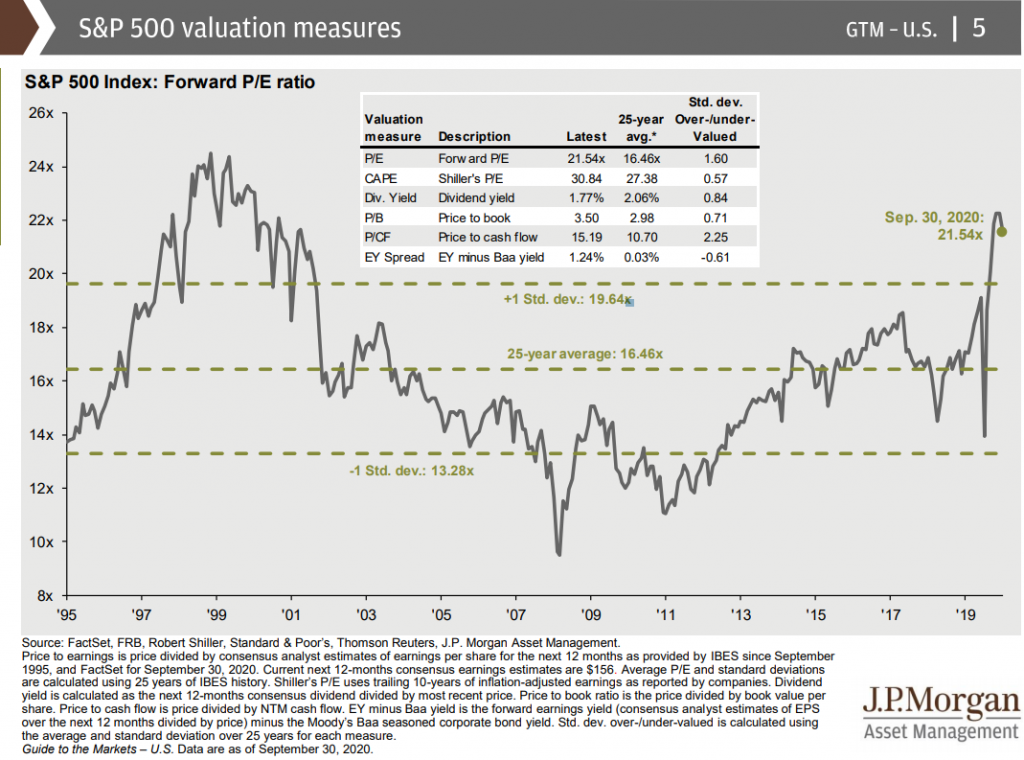
                  Source: Guide to Markets, JP Morgan, September, 30, 2020

                  In the last 10 and 25 years the average PER was about 16.5x, currently at 21.6x.

                  During this period, the PER reached a minimum of 9x at the end of the Great Financial Crisis in 2009 and a maximum of 25x at the height of the technological bubble in 1999.

                  The following graph shows the evolution of the PER by the main regions or geographic markets from 1990 to 2018:

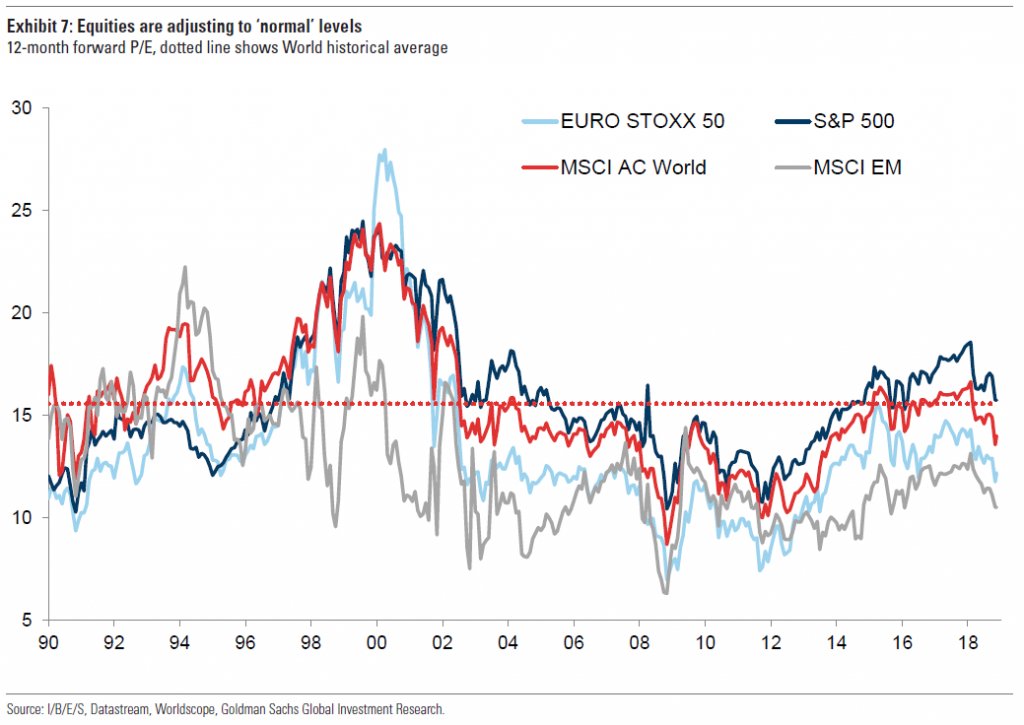
                  The PER’s of the various regions follow the same trend, but with significant deviations in some periods. At the beginning of 2018, the US S&P 500 PER is almost 50% higher than MSCI for Emerging Markets, and is 30% above the Eurozone’s main index, the Eurostoxx 50.

                  There is of course a relationship between Price, PER, and Earnings per Share (EPS) that is given by:

                  Price = PER x EPS.

                  It is obvious that the lower the PER the better to buy (the fewer years of earnings to pay for the share). In favourable market conditions investors are willing to accept a higher PER, and vice versa.

                  The most frequently used measure in the valuation of individual or market stocks is the PER. It is an absolute indicator that does not consider the context.

                  The biggest criticism of the PER is that it is a static indicator, which fails to consider growth, both economic in general (time comparations) or companies with each other (peers-to-peer comparations).

                  There are also other widely used indicators for evaluating stocks, more dynamic than the PER: the Shiller CAPE PE and Price Earnings Growth Growth (PEG) multiples 

                  There are two other relevant indicators that take into account the framework: the economic, with Shiller’s Cyclically Adjusted Price Earnings, and growth, with the price multiple on the growth of the Price Earnings Growth (PEG) results. Combining these two indicators is richer, more dynamic and foresight.

                  The Shiller CAPE is a widely used alternative indicator that responds to those criticisms because it considers the economic context.

                  The CAPE or the PER adjusted to the economic cycle of Nobel laureate Robert Shiller has proved to be a very effective measure in the assessment of equity markets from 1881 to date.

                  It is defined as the price divided by the moving average of the 10-year inflation-adjusted earnings.

                  In its original version Shiller presented it as follows:

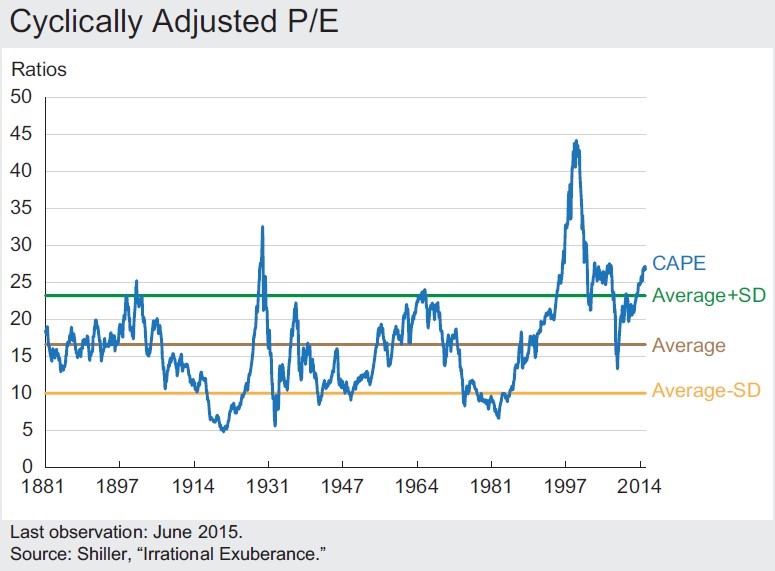
                  It showed that the average CAPE between 1881 and 2014 was just over 15x. 

                  The bands marked by a standard deviation that translated into a CAPE interval of 10x and 23x, indicated the limits for evaluation whether the market was cheap or expensive. In the Great Depression and in the technological bubble the values exceeded the upper limit, as well as that after the 1st and 2nd World Wars and in the oil crises of the seventies and eighties the market was below the lower limit.

                  The following chart combines the evolution of stock prices and earnings of companies in the S&P 500 index, in real terms, with that of CAPE PE, in the same period: 

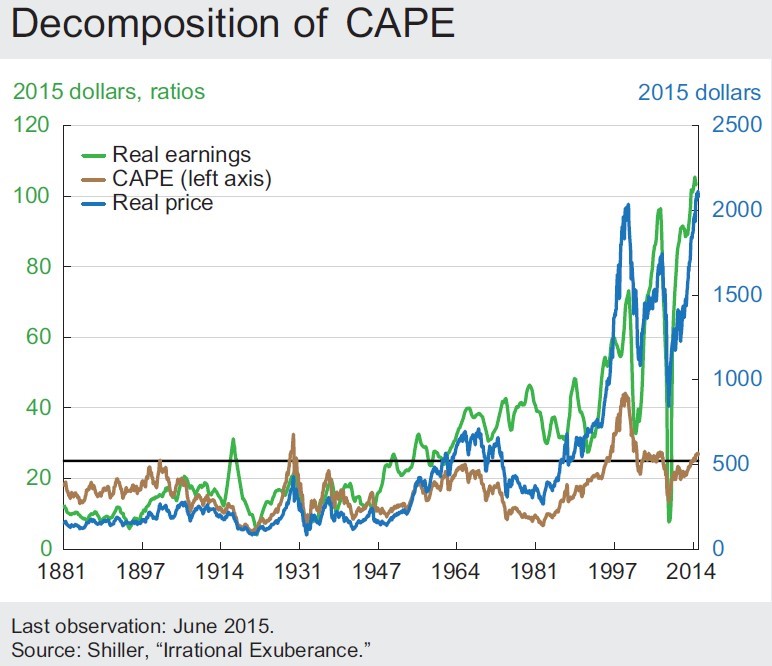
                  The Shiller CAPE reaches extreme values when the market reveals a lack of harmony between its price levels and the earnings growth rates of the last 10 years. The main moments were the periods previously marked. These moments were reversed over time, through the mean reversion.

                  In the following chart we see the Shiller’s CAPE of the S&P 500 for a longer and more recent period, between 1872 and 2020:

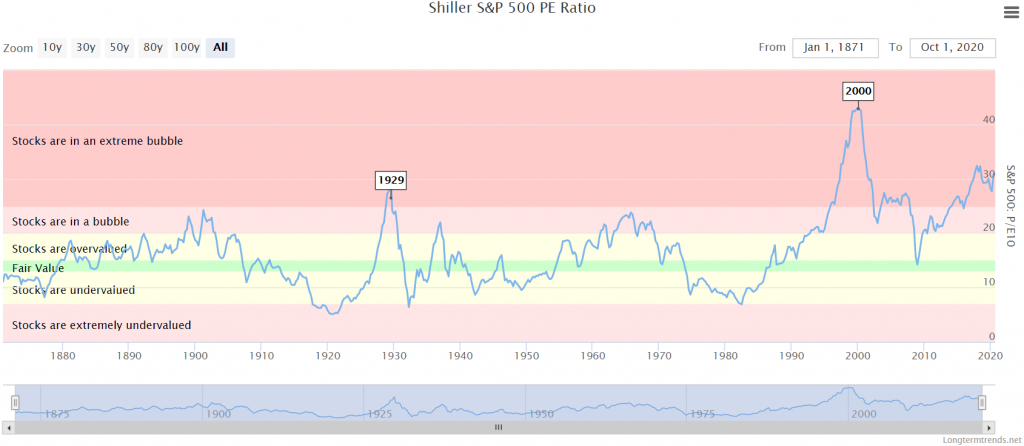
                  Source: Longtermternds

                  The Shiller CAPE has an average value of 14x throughout the period, but in the last 10 to 25 years it has been significantly above average, with values of about 20x or even more. Currently the value is close to 30x.

                  Another alternative indicator that also meets those criticisms and is widely used is PEG, which results from the quotient between the PER and the average earnings growth rate (usually for a period of five years).

                  Not all companies grow and generate earnings at the same speed and what matters to the investor are the earnings generated. Companies with strong growth typically quote at a higher PER, and the PEG corrects these discrepancies.

                  If a company now has a 20x PER and records a 100% growth in EPS, if everything else stays constant, the company’s PER next year will be half, or 10x.

                  The following graph shows the evolution of PER and PEG (with growth in analyst consensus earnings) for the S&P 500 index between 2006 and 2018:

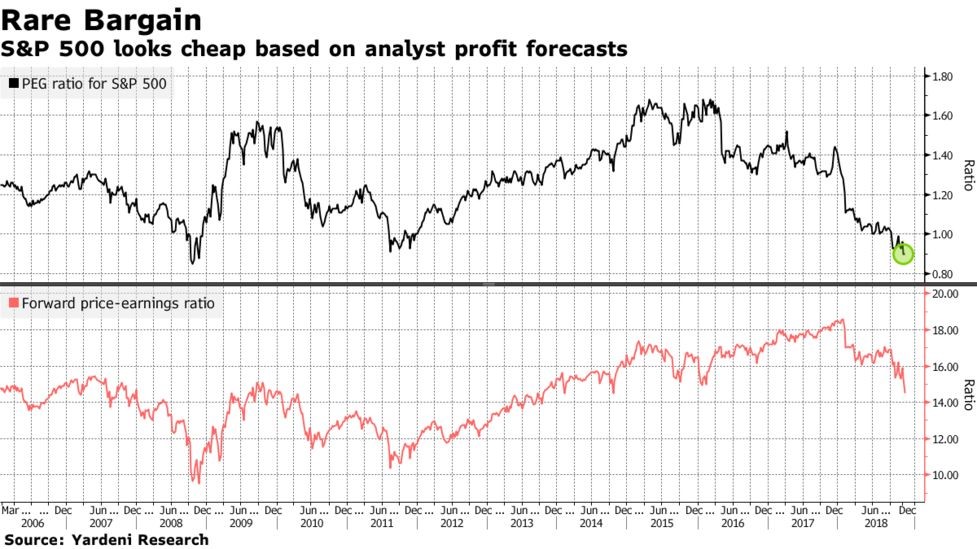
                  Although the S&P 500 PER was at high in late 2017, its PEG multiple was historically very low, about 0.9 and close to 2008 lows.

                  As we have seen these two indicators correct the PER with the earnings growth rate of the results. Schiller’s CAP uses the rate of the last 10 years and PEG normally uses that of the next 5 years. To some extent, the first is retrospective and the second prospective. 

                  Previous Post

                  How to evaluate bonds? Part 1: The factors that influence bond prices

                  Next Post

                  Will there be a new era for emerging stock markets? Part I – Performance

                  Investadmin

                  Investadmin

                  Related Posts

                  Simple Portfolio Series (DIY) Part 2: The Traditional Portfolio 60/40, what it is, for whom, and its performance
                  Investing Series Guide

                  Simple Portfolio Series (DIY) Part 2: The Traditional Portfolio 60/40, what it is, for whom, and its performance

                  28 de January, 2023
                  Simple or Lazy Portfolio Series (DIY): Part 1 – Overview
                  Investing Series Guide

                  Simple or Lazy Portfolio Series (DIY): Part 1 – Overview

                  28 de January, 2023
                  Choosing Mutual Funds Series: Part 5 – Funds availability and currency of investment
                  Investing Series Guide

                  Choosing Mutual Funds Series: Part 5 – Funds availability and currency of investment

                  24 de January, 2023
                  Maximize time invested in the stock market instead of market timing: Part 2. Impossibilities and losses (cont.)
                  Investing Series Guide

                  Maximize time invested in the stock market instead of market timing: Part 2. Impossibilities and losses (cont.)

                  21 de November, 2022
                  Maximizing time invested in the stock market instead of market timing: Part 1 – Biases and losses
                  Investing Series Guide

                  Maximizing time invested in the stock market instead of market timing: Part 1 – Biases and losses

                  21 de November, 2022
                  ESG Investing Series: Part 9 – Developments and models of corporate governance regulation in the world
                  Investing Series Guide

                  ESG Investing Series: Part 9 – Developments and models of corporate governance regulation in the world

                  15 de August, 2022
                  Next Post
                  Haverá uma nova era para os mercados acionistas emergentes?   Parte I – O desempenho

                  Will there be a new era for emerging stock markets? Part I - Performance

                  Leave a Reply

                  Your email address will not be published. Required fields are marked *

                  Trending

                  How Women invest: Part 2 – The results are equivalent to those of men, but with significant differences in investment management

                  How Women invest: Part 2 – The results are equivalent to those of men, but with significant differences in investment management

                  2 de March, 2023
                  Outlook 2023: Part 5 – 2023 will be a transitional year with two halves

                  Outlook 2023: Part 5 – 2023 will be a transitional year with two halves

                  17 de February, 2023
                  Outlook 2023: Part 4 – In changing economic cycle, policies, and market sentiment, valuation matters become more than ever

                  Outlook 2023: Part 4 – In changing economic cycle, policies, and market sentiment, valuation matters become more than ever

                  17 de February, 2023
                  Outlook 2023: Part 3 – 2022 was bad for investments, but was not the same for everything

                  Outlook 2023: Part 3 – 2022 was bad for investments, but was not the same for everything

                  16 de February, 2023
                  Investorpolis

                  We developed this blog because we believe that only a small learning effort is needed to make a big change in the decisions and results of our investments and financial assets.

                  Main categories

                  • Investing Series Guide
                  • Wealth and Investing
                  • Retirement & Savings
                  • Tools
                  • More

                  Newsletter

                  Sign to our mailing list to receive updates direct to your inbox!

                  *We don’t spam

                  • Privacy Policy
                  • Cookie Policy
                  • Contacts

                  © 2021 - Investorpolis / Powered by Delta Soluções

                  • pt-pt Português
                  • fr Français
                  • es Español
                  • en English
                  • Home
                  • Investing Series Guide
                    • I. Goal Based Investing
                    • II. Compounding & Inflation
                    • III. Assets Risks & Returns
                    • IV. Efficient Diversification
                    • IX. Sustainable Investing and ESG
                    • V. The Investor
                    • VI. Assets and Investments
                    • VII. Index Funds
                    • VIII. Successful Investing
                    • X. Kits and Tips
                    • XI. Other Topics
                  • Retirement & Savings
                    • Retirement
                    • Savings
                  • Wealth and Investing
                    • Investing
                    • Wealth
                  • Tools
                    • Calculators
                    • Publications
                    • Sites and apps
                  • More
                    • Best of
                    • Reviews
                    • Snapshots
                    • Others
                  • About us
                    • Who we are
                    • Mission
                  • Login
                  • Sign Up
                  • Cart

                  © 2021 - Investorpolis / Powered by Delta Soluções

                  Welcome Back!

                  Login to your account below

                  Forgotten Password? Sign Up

                  Create New Account!

                  Fill the forms bellow to register

                  All fields are required. Log In

                  Retrieve your password

                  Please enter your username or email address to reset your password.

                  Log In
                  We use cookies on our website to give you the most relevant experience by remembering your preferences and repeat visits. By clicking “Accept All”, you consent to the use of ALL the cookies. However, you may visit "Cookie Settings" to provide a controlled consent.
                  Cookie configurationCookie PolicyAcceptReject
                  Manage consent

                  Privacy Overview

                  This website uses cookies to improve your experience while you navigate through the website. Out of these, the cookies that are categorized as necessary are stored on your browser as they are essential for the working of basic functionalities of the website. We also use third-party cookies that help us analyze and understand how you use this website. These cookies will be stored in your browser only with your consent. You also have the option to opt-out of these cookies. But opting out of some of these cookies may affect your browsing experience.
                  Advertisement
                  Advertisement cookies are used to provide visitors with relevant ads and marketing campaigns. These cookies track visitors across websites and collect information to provide customized ads.
                  Analytics
                  Analytical cookies are used to understand how visitors interact with the website. These cookies help provide information on metrics the number of visitors, bounce rate, traffic source, etc.
                  Functional
                  Functional cookies help to perform certain functionalities like sharing the content of the website on social media platforms, collect feedbacks, and other third-party features.
                  Necessary
                  Necessary cookies are absolutely essential for the website to function properly. These cookies ensure basic functionalities and security features of the website, anonymously.
                  Others
                  Other uncategorized cookies are those that are being analyzed and have not been classified into a category as yet.
                  Performance
                  Performance cookies are used to understand and analyze the key performance indexes of the website which helps in delivering a better user experience for the visitors.
                  SAVE & ACCEPT

                  Add New Playlist

                  Are you sure want to unlock this post?
                  Unlock left : 0
                  Are you sure want to cancel subscription?