Introductory note: The value and caveats of the generalizations of the 8 mega caps or the FAANGM
What are mega-caps 8 – their origin in the FAANGM and its variants
The market caps or capitalization of Mega caps
The main growth indicators of Mega caps
When we talk about investing in the US stock market, we are increasingly talking about two markets, the total market with the 8 mega capitalizations – Apple, Microsoft, Google (Alphabet), Amazon, Facebook, (Meta), Netflix, Nvidia and Tesla (or the Magnificent 7 that excludes Tesla, or the FAANGM, which also excludes Netflix), and the market without these companies.
This is because these sets of mega stocks have a very large weight in the market, they usually move in the same way, and sometimes differently, from the market in general.
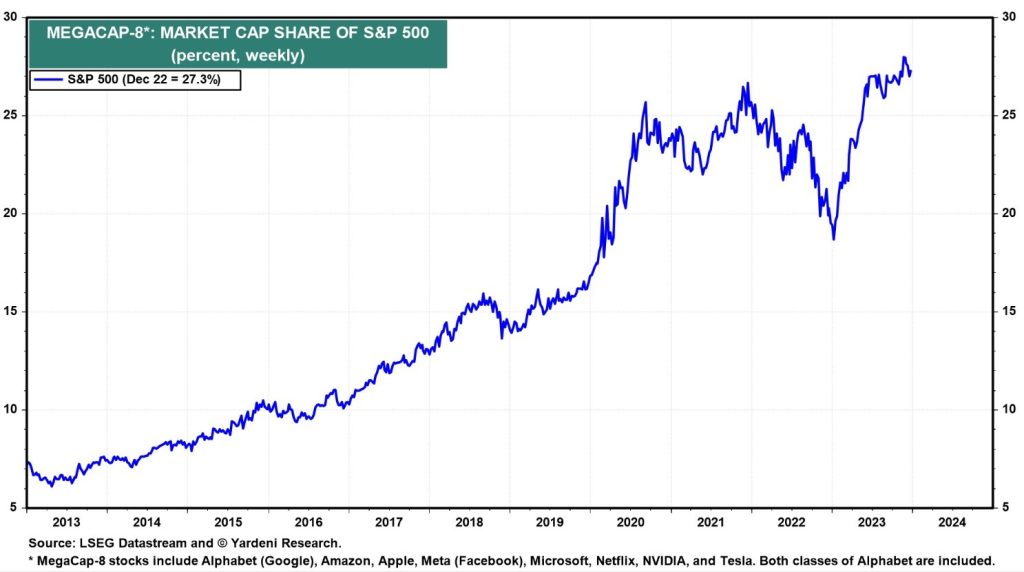
In addition, due to their size, relevance and notoriety, these stocks, (referred to as true monsters or heavyweights, “behemoth”), are part of most of the portfolios of individual and institutional investors.
That is why these stocks have a strong influence and impact on the various indices, North American and worldwide, to the point of being called the market’s leading stocks/directors (“bellwethers”).
All this justifies a careful and differentiated analysis of the segments with and without these actions.
In fact, what has been pulling the S&P 500 index this year has been the performance of the 8 mega caps.
The S&P 500 performed 24% in 2023, but if we exclude the 8 mega-caps that, on average, are up more than 90%, the performance would have been less than 10% (which was the valuation of the S&P 500 index “equal weighted”, quite different from the “cap weighted”).
This behavior did not happen last year, when many of these stocks behaved much worse than the global market.
Last year, when the stock market lost 20% going into a bear market, the 8 mega-caps also performed very badly, in general, although with large differences between them.
That year 2022 was the exception, as these mega caps have been much outperforming for many years.
In fact, since the years following the rebound from the Great Financial Crisis, especially since 2014, large-cap and technology stocks have outperformed the rest:
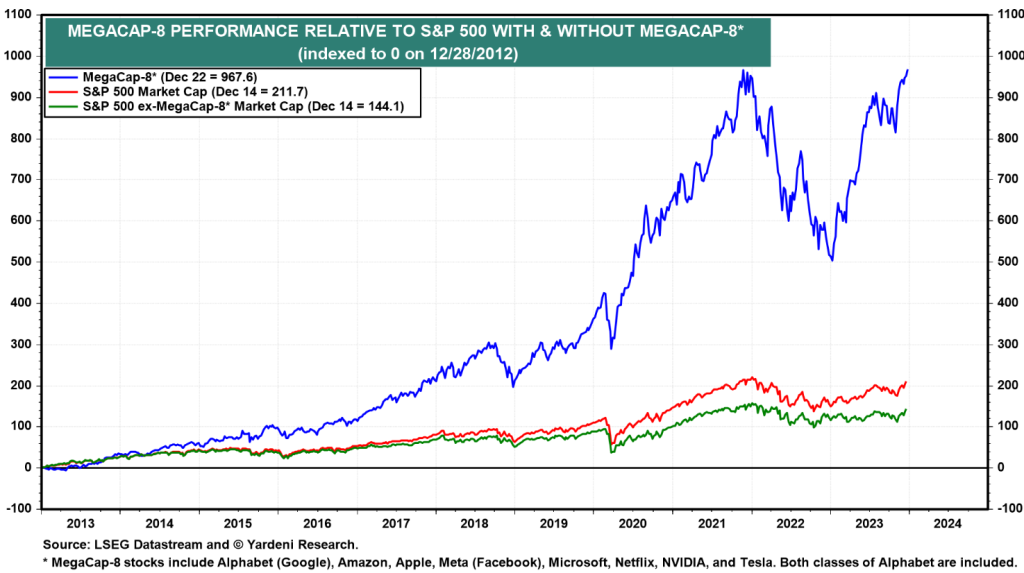
Although these are high-growth companies, this set of stocks is considered by many experts and investment managers to be a more defensive investment.
This characteristic makes them attractive at the current time of transition in the economic cycle, of low growth, and of falling inflation and interest rates, but with still high levels.
These are actions with size, quality and lasting and sustainable competitive advantages (“MOAT”) to face moments of some uncertainty.
Their weight and ambivalence to perform well in the different phases of economic cycles makes them unique.
Due to its importance and implications in the market for equity investments in general, a specific analysis of this topic is justified, which will be done in a series of articles.
In the first one we will see what the 8 mega caps are and their main characteristics.
In the second, we will address its weight and contribution to the main stock indexes.
In the third, we will analyze the valuations of the stock market with and without mega caps and how we can invest in the mega caps market segment or in the segment without mega caps.
We believe that this topic is so important that we address it in greater and greater depth in articles on the quarterly market outlook.
This series on mega caps follows on from another series of articles in which we addressed the topic of investing in different company capitalizations in the US and Europe.
Introductory note: The value and caveats of the generalizations of the 8 mega caps or the FAANGM
In this analysis we will use the information and data about the 8 Mega caps and the FAANGM, sometimes interchangeably, because they are more available and are the most discussed.
It is clear that the companies that make up either of these two sets have many things in common, but they are not homogeneous, so we have to be careful about generalisations.
No two companies are ever the same or even close.
We are talking about similar but different companies, which can lead to discrepancies in behavior.
The homogeneity of FAANGM results from the fact that they are companies in the technological sector, closely linked to web development, of great consumption, of the largest scale and dimension, with strong innovation and above all growth, and leaders in the stock market.
The diversity is even the result of the evolution of the acronym itself, and the variations that are used from the original FANG to the more recent MAMAA, MAGMA and “Magnificient Seven”.
The 8 mega caps are less homogeneous because the central criterion is the size of the capitalization, the leadership of the stock market and its weight, which is volatile.
However, more importantly and despite the simplifications, these sets represent an unquestionable reality, which is discussed and followed almost daily.
What are mega-caps 8 – their origin in the AMANGM and its variants
Jim Cramer and Bob Lang popularized the term FANG as an acronym for Facebook, Amazon, Netflix, and Google — four of the largest and best-known tech stocks in 2013.
In 2017, Cramer added Apple to the group, becoming FAANG.
Then Microsoft was added, another big tech, with a market capitalization of billions of dollars only surpassed by Apple, resulting in FAANGM.
FAANGM’s shares grew rapidly during the mid-2010s to the end of the 2010s, becoming increasingly influential in the stock market.
More recently, this concept has been extended to two more companies, Nvidia and Tesla, which make up the current 8 mega caps.
The FAANGM and, to a certain extent, the 8 mega caps have in common the fact that they are innovative companies with great technological content (one of the main differentiating elements of Tesla from competitors is precisely its self-driving software).
It should be noted that the presence of technology companies in the mega caps of the S&P 500 is a recent reality.
The gradual shift in the composition of the largest S&P 500 weightings from 1980 to 2020 illustrates the notable decline in the oil industry’s economic influence in favor of the dominance of companies linked to Internet development:
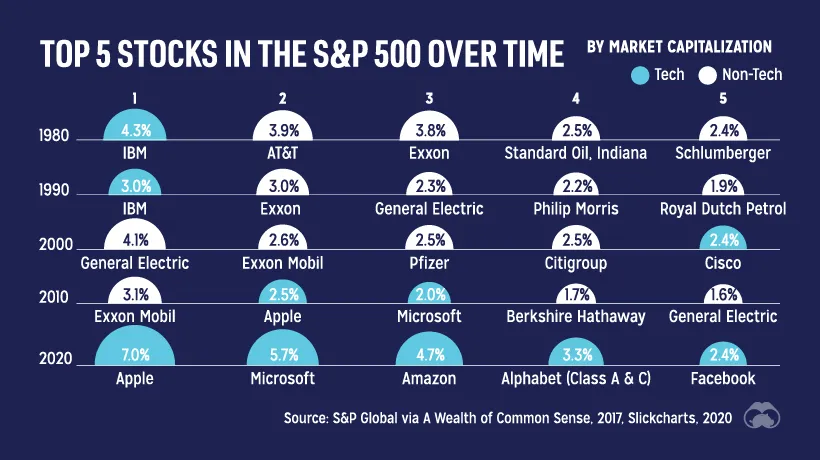
In the following link we can see the evolution of the “podium” of the 10 mega caps of the S&P 500 over time, between 1980 and 2020:
The market caps or capitalization of Mega caps
The evolution of the capitalization of the current 8 mega caps since 2013 was as follows:
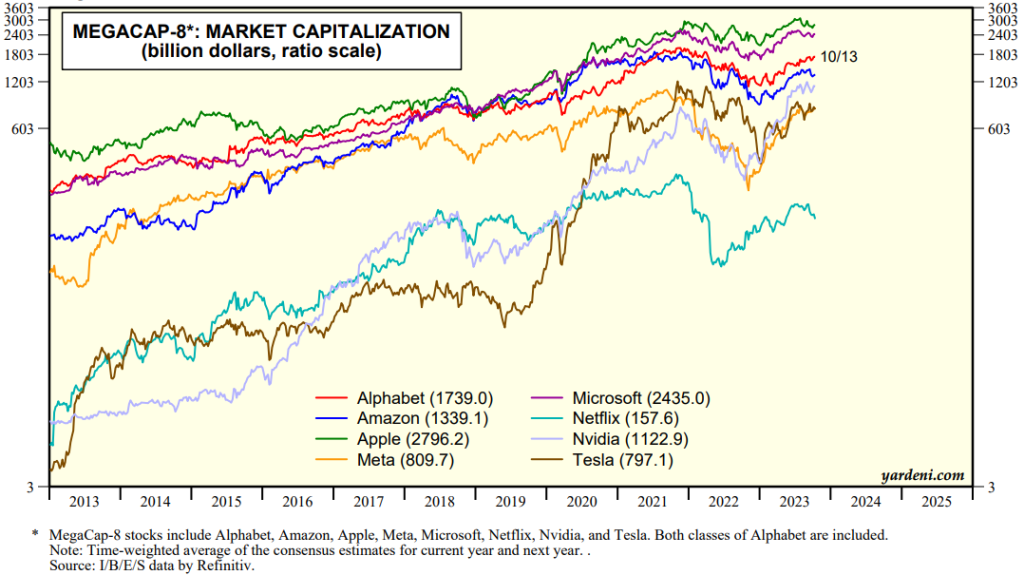
In 2013, Apple alone exceeded the capitalization of $0.5 trillion. Currently, 5 companies have more than $2 trillion in capitalization, of which three are above $2 trillion.
In these 10 years, the growth of Apple, Microsoft, Google, Amazon and Facebook (except in 2022) has been very similar, while the growth of Nvidia and Tesla has been much higher.
The main growth indicators of Mega caps
Analysts’ estimates of revenue growth and short- and long-term earnings for the 8 mega caps are as follows:
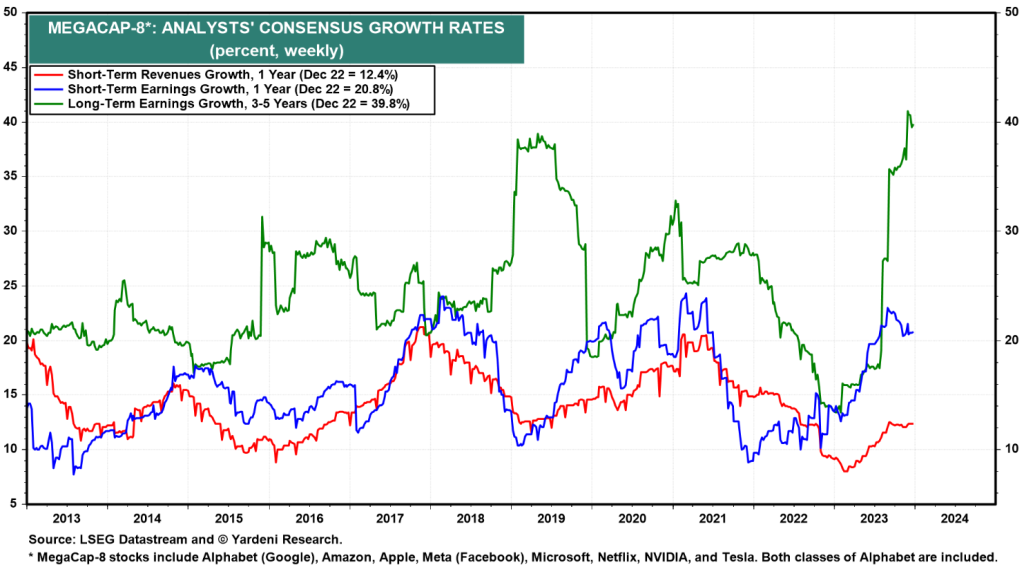
Analysts forecast annualized earnings growth of 20.8% for next year and 39.8% for the next 5 years.
It is perfectly clear that analysts err a lot due to over-optimism in long-term forecasts, which are much higher than short-term forecasts.
Revenue is expected to grow by 12.4% in 2024.


