• About us
    • Who we are
    • Mission
  • Contacts
  • English
    • Português (Portuguese (Portugal))
    • Español (Spanish)
    • Français (French)
  • Login
Investorpolis
[xyz-ips snippet="Banners-Publicitarios"]
No Result
View All Result
No Result
View All Result
Investorpolis
No Result
View All Result
Home Wealth and Investing Investing

The Attraction of Investing in the 8 Mega Caps (or the FAANGM): Part 2 – The Performance of the S&P 500 with and without Mega Caps

27 de December, 2023
in Investing, Wealth and Investing
Reading Time: 7 mins read
0 0
0
The Attraction of Investing in the 8 Mega Caps (or the FAANGM): Part 2 – The Performance of the S&P 500 with and without Mega Caps
Share on FacebookShare on Twitter

The weight of Mega caps in indices

Distortions of market/index performance and depth (“breath”)

Distortions in the valuation of market multiples

This is the second article dedicated to investing in the 5 to 8 mega caps, or in the FAAMG (and its variants), considering their weight in the main indices of the US market, namely the S&P 500 and the Nasdaq.

The reality is that the big five responsible for the vast majority of US stock market gains in 2023 are Apple (+36% this year), Microsoft (+37%), Alphabet (+39%), Amazon (+44%) and Nvidia, which is up 159% in relation to AI.

Without these stocks, the main U.S. stock market index, the S&P 500, including dividend payments, would rise just 1.5% this year

If we exclude contributions from the other two largest tech companies – Meta (+120%) and Tesla (+66%) – the S&P 500 would be slightly negative for the year.

The impact and contribution of these stocks on the global market has been so strong that they are increasingly referred to as the “Magnificent Seven” (excluding Netflix).

This is the second article about the 8 mega caps or the FAANGM and their influence and importance for the stock market.

In the previous article we made a brief general presentation, highlighting the history of its growth and appreciation.

In this article we will look in more detail at the weight, contribution and importance in market indices, as well as the distortions caused in market analysis if we do not take into account the effects of these heavyweights.

The weight of Mega caps in indices

As we have seen in previous articles, the vast majority of the main indices that make up these companies are weighted by capitalization, including the US S&P 500 and the Nasdaq, and consequently the global MSCI World or ACWI.

The weight of the current 8 largest capitalizations in the S&P 500 is at 27.2%, all-time highs:
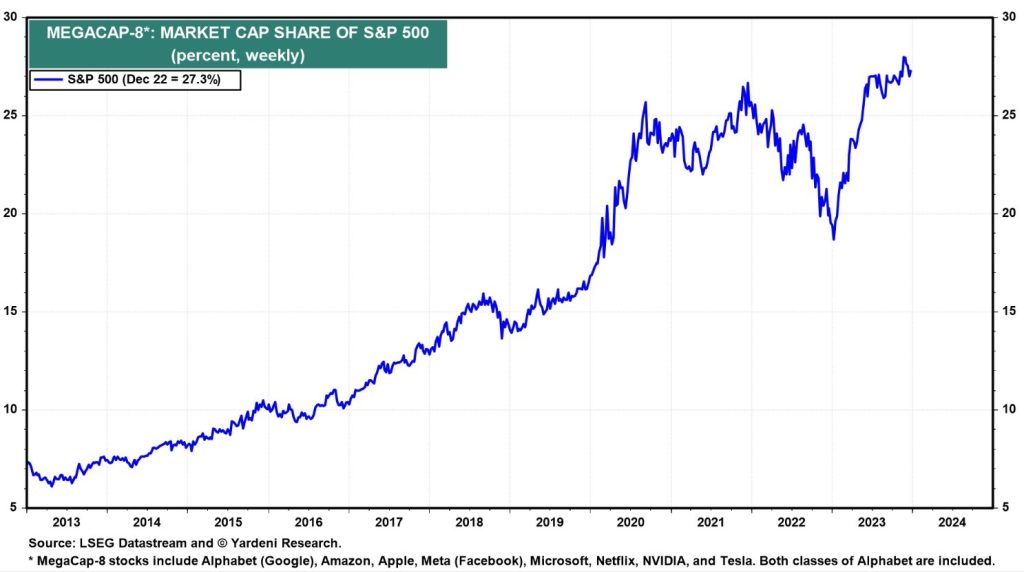
The weights of the 8 companies are as follows: Apple (7.2%), Microsoft (6.9%), Amazon (3.3%), Nvidia (2.9%), Alphabet (4.3%, in both series), Facebook (1.9%). Tesla (1.7%) and Netflix 0.5%.

The concentration in the S&P 500 of the 5 largest companies is also at all-time highs, reaching almost 25%:
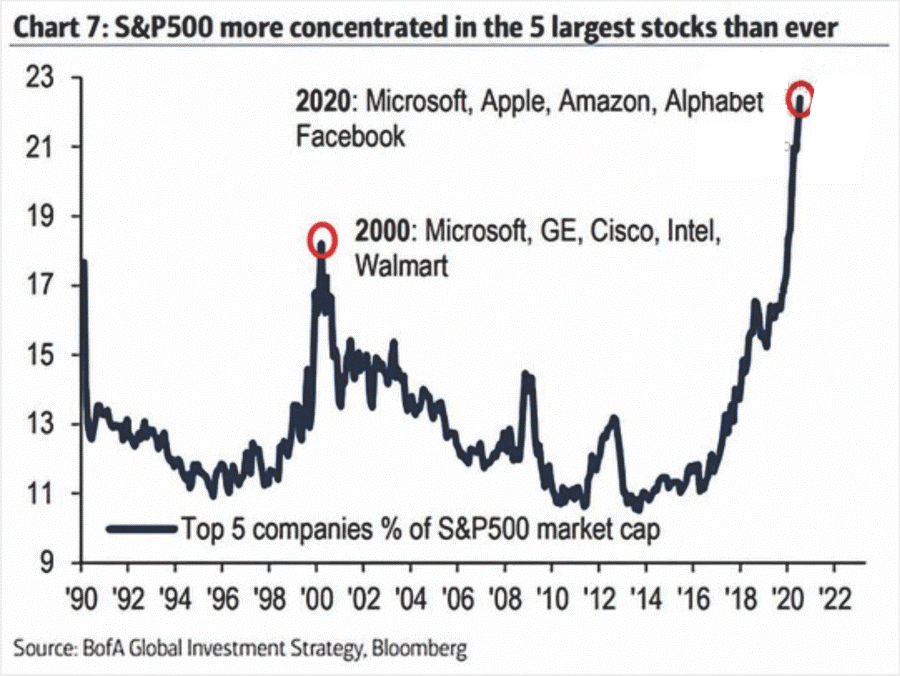
At the same time, as a cause and consequence, these stocks have performed exceptionally well over the past 10 years, vastly outperforming the market as a whole.

The combined effect of high market concentration and the extraordinary performance of these mega stocks has consequences and implications that are not always realized, in terms of the direction of the markets and the valuation of the markets, which can distort the reality of the global market significantly.

Distortions of market/index performance and breadth

The first possible distortion of reality is that of the performance of the global market, as the strong contributions and weights of these stocks in the indices can distort the situation.

This question is very relevant because we often talk about the performance of the market in general, in the day, in the week, in the month, in the year, in the last 3, 5 or 10 years, without considering the effect, or the contribution, of these mega caps.

It is often the case that the positive performance of the market is mainly due to these companies, and the average of the remaining hundreds of stocks are underperforming.

This situation can induce many errors or biases in the analysis of the behavior and sentiment of the market in general.

This means that we may think that everything is fine when in fact only a small sample of the market is fine and the rest is bad.

Therefore, it is necessary to analyze the performance of the market with and without these mega stocks.

The following chart shows the evolution of the S&P 500, the 8 mega caps and the S&P 500 excluding the 8 mega caps since 2013:
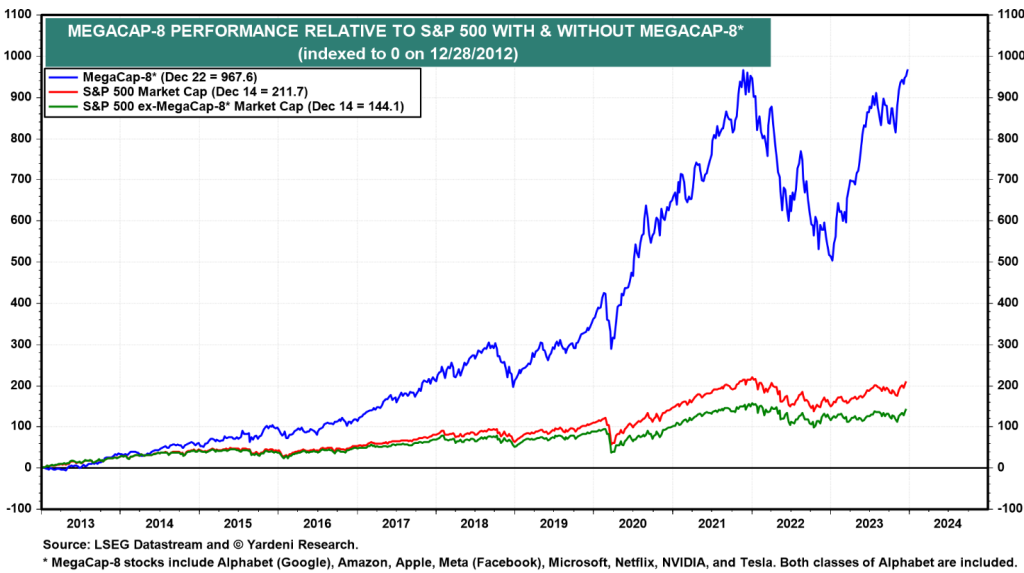
Since the end of 2012, the S&P 500 index has gained 189.4%, but excluding the 8 mega caps it has only appreciated 127.4%, as they have gained an extraordinary 872.9%.

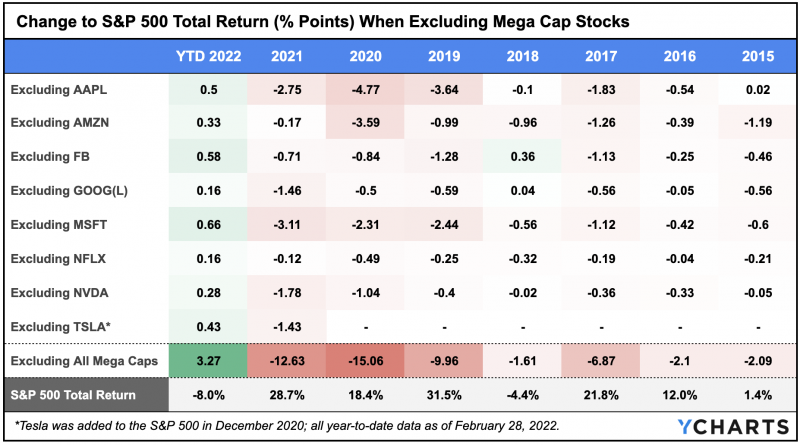
The following table shows the individual impact of mega stocks on the S&P 500 index between 2015 and February 2022:
In 2023, the performance was as follows:
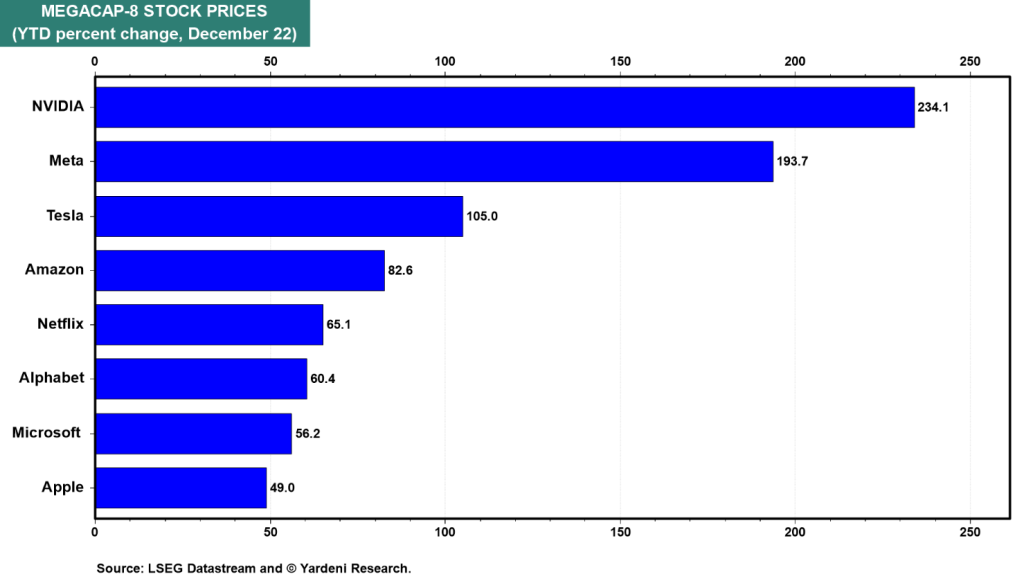
This impact has been very strong and growing over the years, especially after the pandemic.

In 2021, the S&P 500 had a return of 28.7%, but 12.63% was due to the 8 mega caps alone (40%).

In 2020, the impact had been even greater with the S&P 500 returning 18.4%, resulting in almost all of the 15.06% of mega caps.

We see that in the early years the impact was much smaller.

As we have seen, the most correct way to analyze this bias is to look at performance with and without these actions.

In addition, more generally, and beyond these actions, there are other ways of assessing the concentration or dispersion of market movements, the so-called breadth, within the scope of technical analysis.

The simplest measure of market width is to measure the amount of stocks whose prices have gone up versus the one in which they have fallen.

Another way is to analyze the quantities of index stocks whose prices are above or below the moving averages of prices over the last 50 and 200 days, measures widely used in technical analysis.

Comparing the performance of capitalization-weighted indices with their peers of equal weighting is another way to gauge the width of the market.

Yardeni research gives us several up-to-date indicators on the breadth of the S&P 500:

https://yardeni.com/charts/breadth/

Distortions in the valuation of market multiples

As we know and have seen in previous articles, much of the analysis and discussion regarding stock market valuations focuses on market multiples, usually the PER.

It is a simple, available measure that is easy to understand and use.

Analysts and investors study and know the medium and long-term averages of the PER for the main indices, the averages in the different phases of the economic cycle, their lows and highs, etc.

The problem is that many times the assessment of the market made by analysts and commentators through PER does not consider the possible distortion associated with the concentration of the index.

The following chart shows the evolution of the PER multiples of the S&P 500, the 8 mega caps, and the S&P 500 excluding the mega caps since 2013:
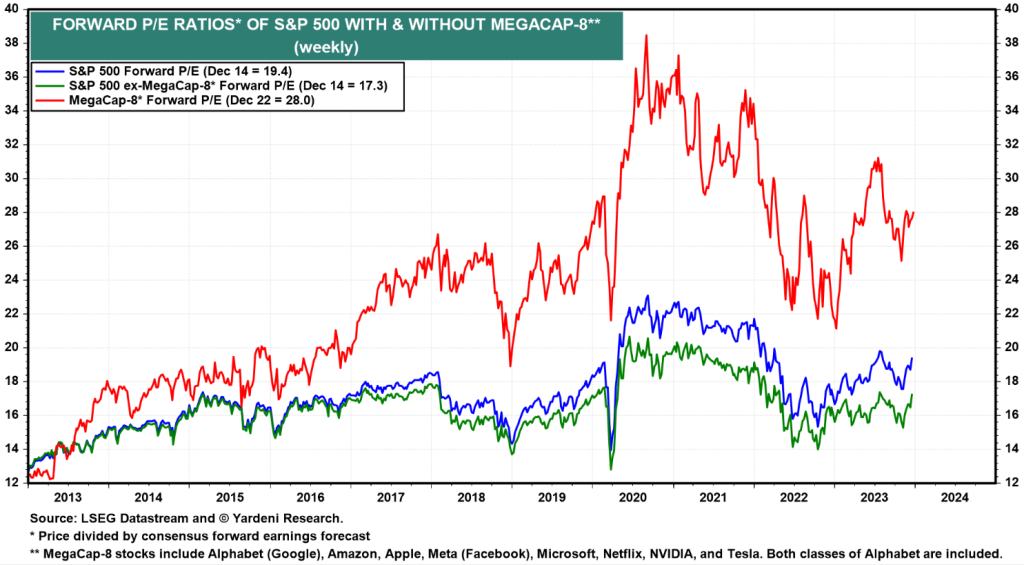
Currently, the PER of the S&P 500 is at 19.4x, but that of the S&P 500 without the 8 mega caps is at 17.3x, and that of those companies is at 28x.

This divergence of the S&P 500 PER with and without the 8 mega caps is close to the highest levels in recent years.

Given that the PER of mega caps is high but well below the levels recorded between 2020 and 2021, the PER of the S&P 500 without mega caps is below the last 5 years and close to the 10-year average.

Previous Post

The Attraction of Investing in the 8 Mega Caps (or the FAANGM): Part 1 – Overview

Next Post

Financial Markets Outlook 1Q24: Fair priced markets with all eyes on the downward paths of inflation and interest rates by the FED

Feria

Feria

Related Posts

Effects of Trump’s Trade Tariffs on Financial Investments Series: P1 – Framework
Investing

Effects of Trump’s Trade Tariffs on Financial Investments Series: P1 – Framework

8 de May, 2025
Series Investments in the Artificial Intelligence Cycle: Part 2 – The main branches of AI
Investing

Series Investments in the Artificial Intelligence Cycle: Part 2 – The main branches of AI

29 de April, 2025
2Q25 Financial Markets Outlook: Zombieconomics, or the monumental cost of Trump’s astronomical reciprocal tariffs
Investing

2Q25 Financial Markets Outlook: Zombieconomics, or the monumental cost of Trump’s astronomical reciprocal tariffs

4 de April, 2025
Thematic Investments Series: Part 3. What are the main megatrends?
Investing

Thematic Investments Series: Part 3. What are the main megatrends?

28 de March, 2025
Thematic Investments Series: Part 2.2. Disruptive technology or innovation – The domains of disruptive technology or innovation
Investing

Thematic Investments Series: Part 2.2. Disruptive technology or innovation – The domains of disruptive technology or innovation

17 de March, 2025
Investments in the Artificial Intelligence Cycle Series: Part 1 – Definition and History of Development
Investing

Investments in the Artificial Intelligence Cycle Series: Part 1 – Definition and History of Development

20 de February, 2025
Next Post
Financial Markets Outlook 1Q24: Fair priced markets with all eyes on the downward paths of inflation and interest rates by the FED

Financial Markets Outlook 1Q24: Fair priced markets with all eyes on the downward paths of inflation and interest rates by the FED

Leave a Reply

Your email address will not be published. Required fields are marked *

Trending

Effects of Trump’s Trade Tariffs on Financial Investments Series: P1 – Framework

Effects of Trump’s Trade Tariffs on Financial Investments Series: P1 – Framework

8 de May, 2025
Series Investments in the Artificial Intelligence Cycle: Part 2 – The main branches of AI

Series Investments in the Artificial Intelligence Cycle: Part 2 – The main branches of AI

29 de April, 2025
2Q25 Financial Markets Outlook: Zombieconomics, or the monumental cost of Trump’s astronomical reciprocal tariffs

2Q25 Financial Markets Outlook: Zombieconomics, or the monumental cost of Trump’s astronomical reciprocal tariffs

4 de April, 2025
Thematic Investments Series: Part 3. What are the main megatrends?

Thematic Investments Series: Part 3. What are the main megatrends?

28 de March, 2025
Investorpolis

We developed this blog because we believe that only a small learning effort is needed to make a big change in the decisions and results of our investments and financial assets.

Main categories

  • Investing Series Guide
  • Wealth and Investing
  • Retirement & Savings
  • Tools
  • More

Newsletter

Sign to our mailing list to receive updates direct to your inbox!

*We don’t spam

  • Privacy Policy
  • Cookie Policy
  • Contacts

© 2021 - Investorpolis / Powered by Delta Soluções

  • pt-pt Português
  • fr Français
  • es Español
  • en English
  • Home
  • Investing Series Guide
    • I. Goal Based Investing
    • II. Compounding & Inflation
    • III. Assets Risks & Returns
    • IV. Efficient Diversification
    • IX. Sustainable Investing and ESG
    • V. The Investor
    • VI. Assets and Investments
    • VII. Index Funds
    • VIII. Successful Investing
    • X. Kits and Tips
    • XI. Other Topics
  • Retirement & Savings
    • Retirement
    • Savings
  • Wealth and Investing
    • Investing
    • Wealth
  • Tools
    • Calculators
    • Publications
    • Sites and apps
  • More
    • Best of
    • Reviews
    • Snapshots
    • Others
  • About us
    • Who we are
    • Mission
  • Login
  • Cart

© 2021 - Investorpolis / Powered by Delta Soluções

Welcome Back!

Login to your account below

Forgotten Password?

Retrieve your password

Please enter your username or email address to reset your password.

Log In
We use cookies on our website to give you the most relevant experience by remembering your preferences and repeat visits. By clicking “Accept All”, you consent to the use of ALL the cookies. However, you may visit "Cookie Settings" to provide a controlled consent.
Cookie configurationCookie PolicyAcceptReject
Manage consent

Privacy Overview

This website uses cookies to improve your experience while you navigate through the website. Out of these, the cookies that are categorized as necessary are stored on your browser as they are essential for the working of basic functionalities of the website. We also use third-party cookies that help us analyze and understand how you use this website. These cookies will be stored in your browser only with your consent. You also have the option to opt-out of these cookies. But opting out of some of these cookies may affect your browsing experience.
Advertisement
Advertisement cookies are used to provide visitors with relevant ads and marketing campaigns. These cookies track visitors across websites and collect information to provide customized ads.
Analytics
Analytical cookies are used to understand how visitors interact with the website. These cookies help provide information on metrics the number of visitors, bounce rate, traffic source, etc.
Functional
Functional cookies help to perform certain functionalities like sharing the content of the website on social media platforms, collect feedbacks, and other third-party features.
Necessary
Necessary cookies are absolutely essential for the website to function properly. These cookies ensure basic functionalities and security features of the website, anonymously.
Others
Other uncategorized cookies are those that are being analyzed and have not been classified into a category as yet.
Performance
Performance cookies are used to understand and analyze the key performance indexes of the website which helps in delivering a better user experience for the visitors.
SAVE & ACCEPT

Add New Playlist

Are you sure want to unlock this post?
Unlock left : 0
Are you sure want to cancel subscription?