The volatility of the markets makes it difficult for us to stay the course, which is what we must do
How to act when there are strong corrections or we are in bear markets?
In the previous article, we addressed the multitude of events and situations that we are confronted with to change our investment course in the stock markets.
In this second part, we will show you why we should stay the course and above all how we can act when we are facing a stronger correction in the markets.
The volatility of the markets makes it difficult for us to stay the course, which is what we must do
What matters is to be able to know how to act when we hear these news that bring anxiety, disturb us and can lead us to change our strategy.
The chart shows the evolution of the stock market between 1871 and 2020:
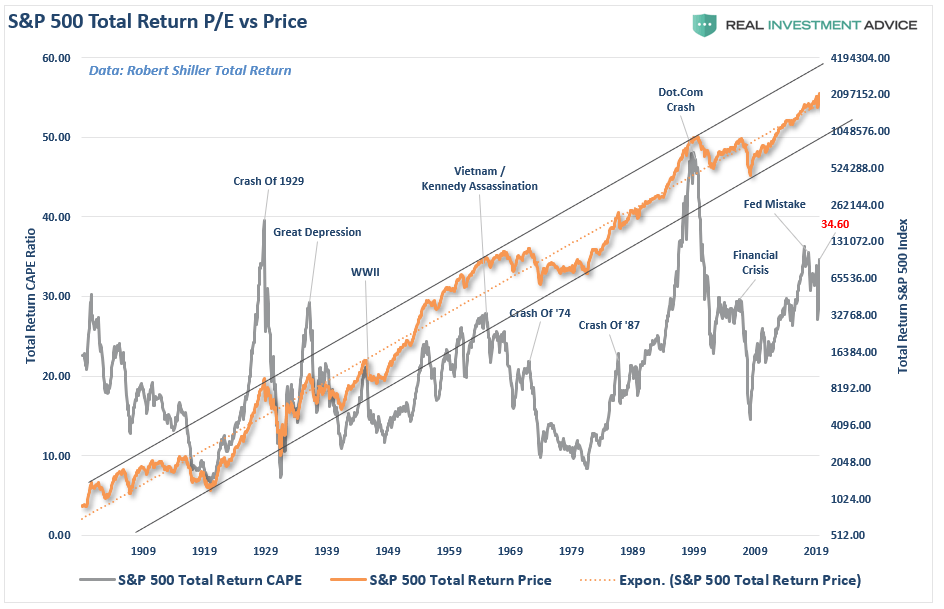
The evolution of the S&P 500 index is one of appreciation that occurs along a channel or narrow band.
In other words, in a very long-term view, valuation looks like a straight, one-way line, always rising.
There are short-term corrections, but the passage of time cancels them out.
In fact, in the medium and long term, the market provides very interesting returns.
The following chart shows the average annualized returns of the U.S. stock market for 10-year periods between 1929 and 2021:
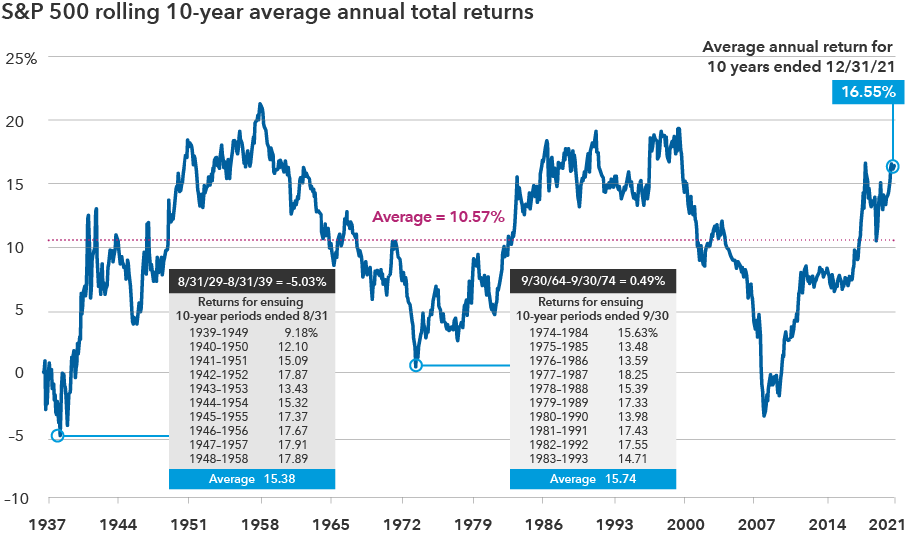
The average annual return for 10-year periods was 10.57%.
This graph also shows us the average returns following major crises, which, as you would expect, were much higher than the average for the whole period.
After the 1939 lows, the average 10-year annual returns up to 1958 were 15.38%.
The same was true after the 1973 lows, with average 10-year returns of 15.74% per annum until 1993.
And it was repeated again after the lows of the Great Financial Crisis and until 2021.
If the previous two charts weren’t enough, it’s worth reinforcing with the one in the following chart that shows us the annualized returns of the US stock market for periods of 1, 5 and 15 years between 1926 and 2019:
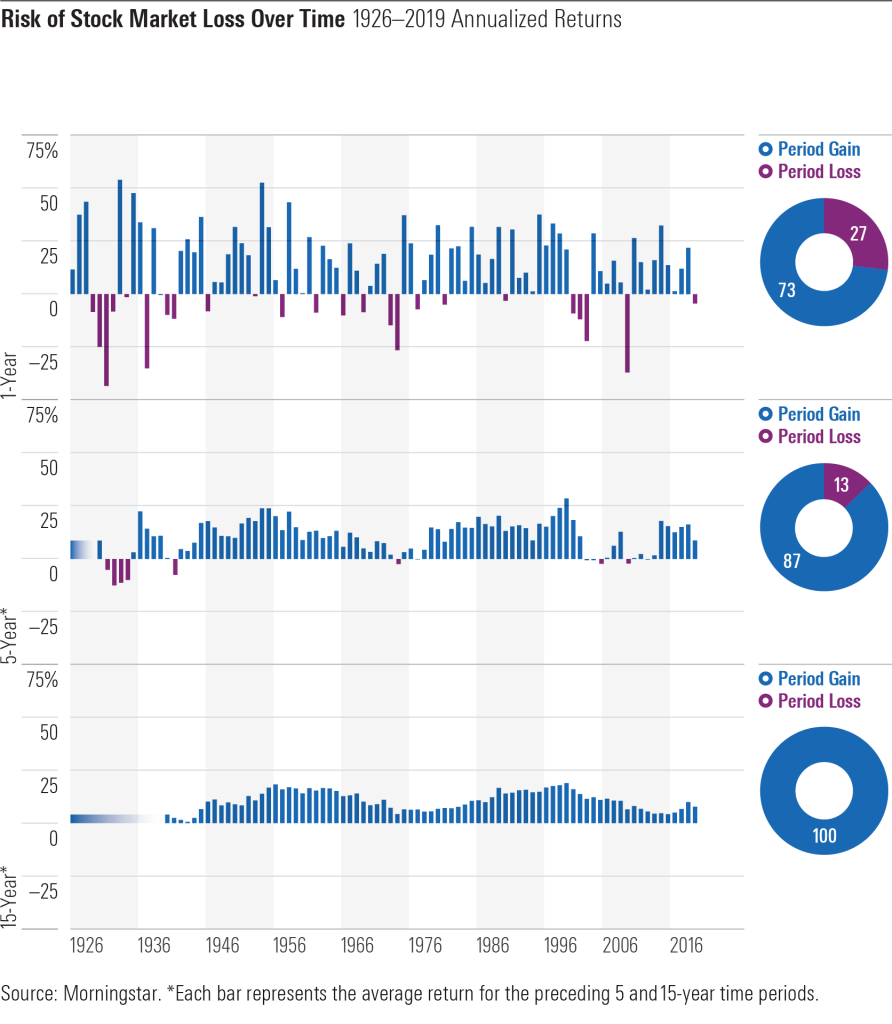
In this period of almost 100 years, the stock markets had positive annual returns in 73% of those years (remember that the average annual return was more than 9% per year).
If we extend the investment period to 5 years, the stock markets had positive returns in 87% of the years, i.e. only in 1 in 10 periods the return was negative.
If we move to 15-year periods, there has not been a single period with negative returns.
And as we know, 5 or even 15 years is not a long time.
We have many financial goals whose investment term is more than 15 years, such as the education of our children or the investment for retirement.
How to act when there are strong corrections or we are in bear markets?
Despite this prospect of appreciation of the stock markets in the medium and long term, the truth is that fluctuations and volatility in the short term make us fear for our assets and test our resilience.
In other articles we have seen that the markets are subject to frequent technical corrections, of between 10% and 20%, and in some periods, also to stronger corrections, more than 20%, hampered by crises or “bear markets”.
The question arises of what to do in these moments.
As we have also seen in other articles, financial planning and investment are a medium and long-term process and must obey rules.
They should be geared towards our financial objectives, and in line with our financial capacity and risk profile as an investor.
These variables determine our allocation of investments across key assets.
We should choose investments that provide a good level of diversification to mitigate risks, that replicate that composition of assets, and whose management fees and other costs are low.
Periodically, we must rebalance our portfolio to avoid excessive deviations from the intended allocation.
When there are sharper corrections, we should start by analyzing these deviations and make the consequent rebalancing, if necessary.
We can also sell the investments that have not performed well in the medium term.
The reason is that if these investments have performed poorly during a positive cycle, they will most likely be hit the hardest in a correction.
Finally, in these circumstances, we should also review our asset allocation in light of any changes to our risk profile.
If changes have occurred, an increase in the liquidity and/or bond position and the consequent reduction of the equity market exposure may be justified.
We know that investing in bonds has less risk than stocks, as we can confirm in the following chart showing the maximum annual fluctuations of the two markets between 1973 and 2022:
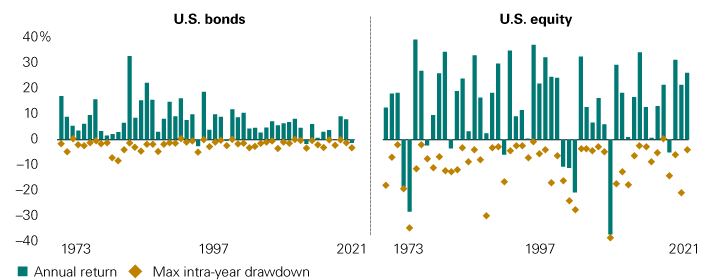
Maximum intra-year losses (“drawdowns”) are incomparably significant in stocks than in bonds.
But it can also be seen that the gains of stocks are incomparably higher than those of bonds.
This is precisely why diversification and allocation by asset class plays a major role.
The following chart shows the comparative evolution of an investment portfolio with 100% exposure to equities and another that reflects the traditional or balanced portfolio of 60% equities and 40% bonds in the US market between 1976 and 2018:
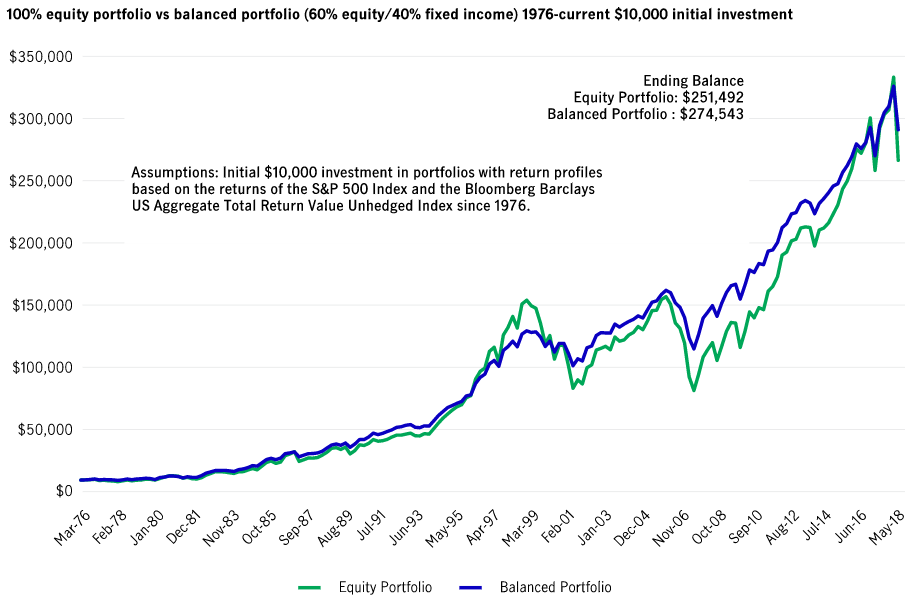
In this 42-year period, the two portfolios have had the same appreciation.


