


The effect of ROIC on valuations by PER and PEG multiples
The ROIC of the various sectors of activity
The drivers of ROIC
How to obtain ROIC, cost of capital and other fundamental indicators of companies?
This article is part of a series on investing in stocks.
In the first article of the series, we presented the reasons for investing in individual stocks.
We have also seen how we can use a core and satellite strategy in managing our wealth, combining market-indexed and low-cost investments with investments in individual stocks.
In the second, we addressed the topic of how we can select the universe of stocks to arrive at our list of stocks to invest in.
We have linked the purpose of this list to the lists of stocks that have performed excellently in the past.
We have also seen that although there are many lists made publicly available by the specialized media there is only one list that suits our individual case.
Then we move on to the principles of analysis and evaluation of the actions that will be part of our list.
In a later article, we analysed the importance of investing in stocks with lasting or sustainable competitive advantages and what are the analysis methodologies to identify them.
But just as important as the value of these companies with competitive advantages is the purchase price.
In the subsequent article we discussed the various valuation methods – fundamental, technical and quantitative analysis – in order to conclude whether a stock is at a reasonable and fair price or too expensive.
Within the scope of fundamental analysis, we have seen the discounted cash flow models and their simplified version, the Gordon model, as being the most sensible way to determine the value of a business.
In the first part of this article, we focused on the importance of ROIC – the Return On Invested Capital – in fundamental valuation models and in determining a company’s profit that is available to be distributed to shareholders.
We also looked at the relationship of ROIC with other financial variables in the model, growth and distribution of results, highlighted ROIC as the key metric of the fundamental value of the stock, and analyzed its relationship with the various previous models,
In this second part we analyze the use of ROIC in valuation practice, and its relationship with the two main market multiples, the PER and the PEG.
The effect of ROIC on valuations by PER and PEG multiples
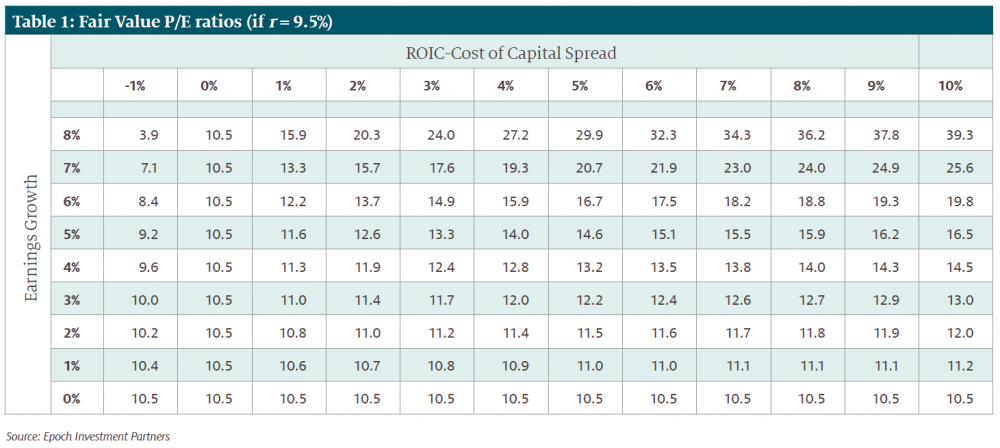
In the last line of the table, the company does not seek to grow results, no reinvestment is necessary, and the distribution rate remains constant (at 100%) as you move from left to right.
In lines where the growth rate is greater than zero, when the ROIC spread on the cost of capital increases (from left to right, per line), the value of the enterprise and the associated PER increase.
This is because as the ROIC increases, the rate of reinvestment required to achieve a given growth rate decreases and the distribution rate increases (i.e., higher D in the numerator).
This is a key point that many investors don’t realize.
The fact that two companies have the same growth rate does not mean that they should trade at the same multiple of PER. A higher ROIC is always better than a lower ROIC, for companies with the same growth rate.
If ROIC remains constant and the growth rate varies (from top to bottom, per column), the results vary, and the main distinguishing criterion is whether the ROIC spread over the cost of capital is positive, negative, or zero.
When the ROIC spread is positive, the higher growth increases the value of the business and therefore the PER, and as the ROIC spread increases, the PER becomes more sensitive to changes in g.
When the ROIC spread is negative (the column on the left), growing faster reduces the value of the trade, leading to lower PER ratios as growth increases.
The most important conclusion is that PER ratios, by themselves, do not tell us whether one company is cheaper than another.
The range of results is wide, with PER values ranging from 3.9 to 39.3. A stock traded at 20 times earnings can be just as correctly priced as a stock traded at 10 times.
There are many investors who think that this problem is solved by looking not only at the simple PER ratio, but also at the PER ratio of a company to its growth rate, or sja, the PEG ratio.
PEG ratios have a complete logical basis. Higher growth rates decrease the denominator in the Gordon growth model equation and therefore appear to increase the price value (P), which also means a higher PER ratio.
The following table confirms this intuition, showing the fair value of the PEG, by dividing the PER ratio by the growth rate of results:
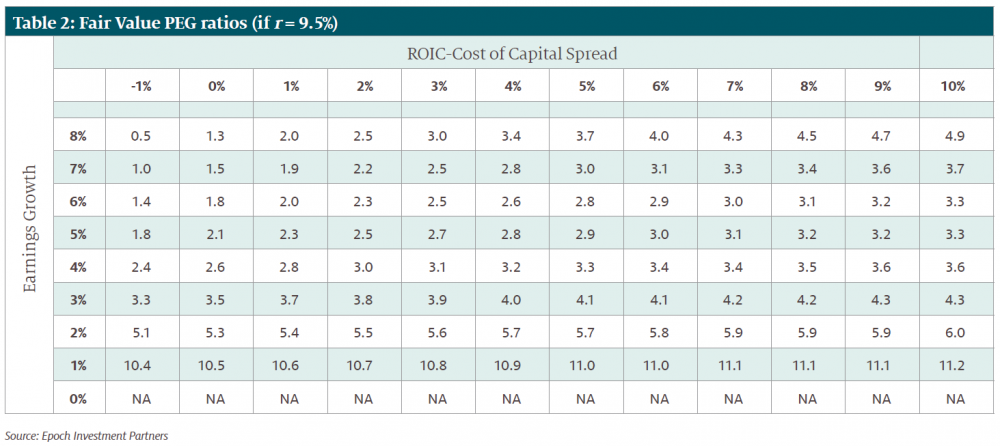
There is a large variation in the PEG, between 0.5 and 11.2, so clearly, there is no “good” PEG relationship in the absolute sense.
Moreover, it is clear that there is in fact no linear relationship between PEG ratios and growth, the implicit assumption behind the use of some investors’ PEG ratios.
In other words, the fact that one company trades at a PEG ratio of 4 while another trades at a PEG ratio of 2, by itself, does not tell us anything about which company has a more attractive price.
Free cash flows and future growth jointly determine the value of a business, but there is an inherent trade-off between the two, and the variable that ultimately triangulates the outcome of that trade-off is ROIC.
In short, the PER and PEG ratios are completely inadequate and misleading metrics, if you don’t incorporate ROIC into the analysis.
There is no absolute standard for whether a given PER or PEG ratio is “cheap” or “expensive” and, even on a relative basis, a firm with a lower PER or PEG ratio is not necessarily cheaper than a firm with higher ratios.
The fair value of a company in Gordon’s model depends on three things, the cash flows to shareholders (which is a function of the company’s ROIC), the growth rate, and the return that investors require to invest in the company.
And because these three variables influence the price, they also influence the PER ratio.
To this extent, when investors seek to calculate the fair value of a company, they should seek to analyze the extent to which ROIC, growth, and return are reflected in the price.
The ROIC of the various sectors of activity
ROIC varies according to the sectors of activity:
In the following table we can analyze the relationships between ROIC, EPS growth, annualized returns and PER, at the sectoral level, in relation to the S&P 500:
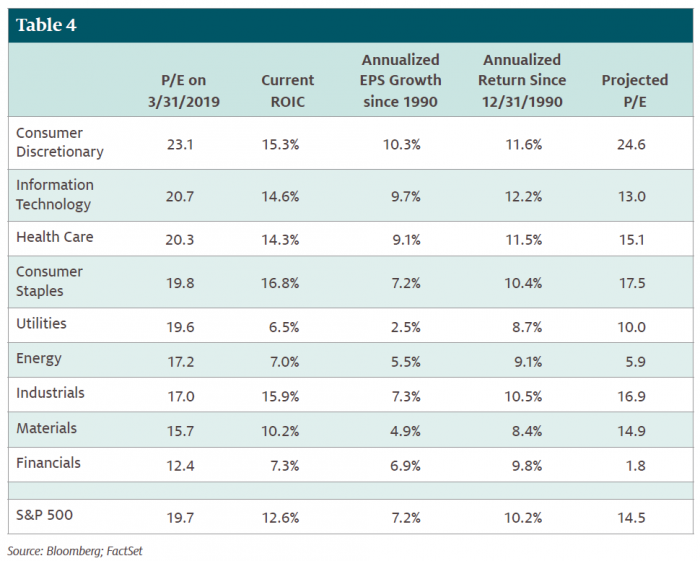
The financial sector, energy, and raw materials have the lowest ROICs, while consumer goods, technology, and healthcare have the highest ROICs.
The useful analysis of these values is to compare returns and PER at different points in time and try to understand the valuation factors, ROIC, growth, and cost of capital.
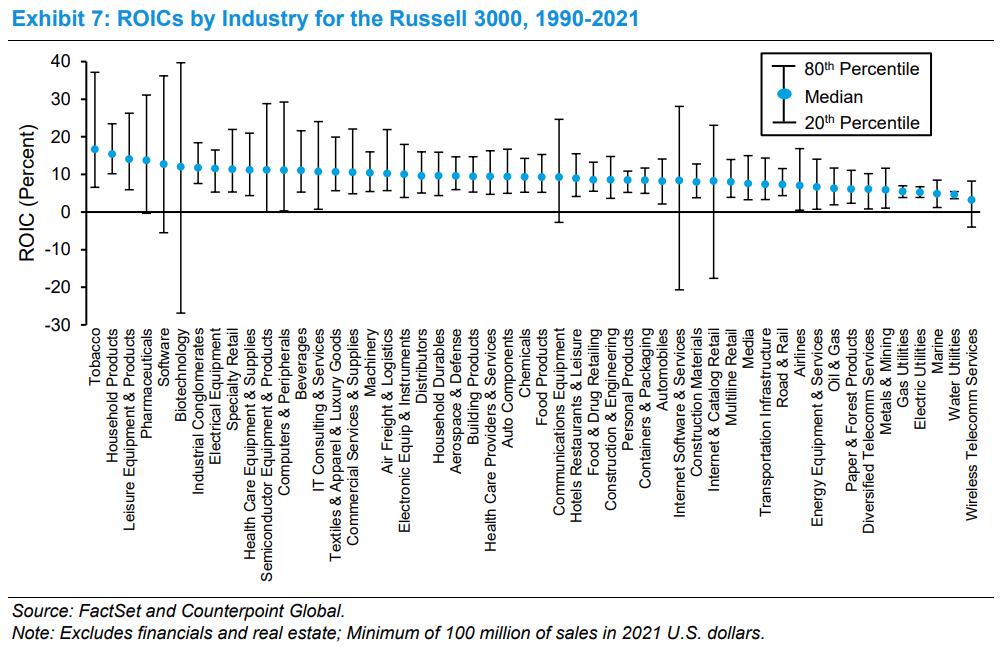
The drivers of ROIC
The following chart shows the distribution of the top 500 companies in the Russell 3000 based on their ROIC drivers:
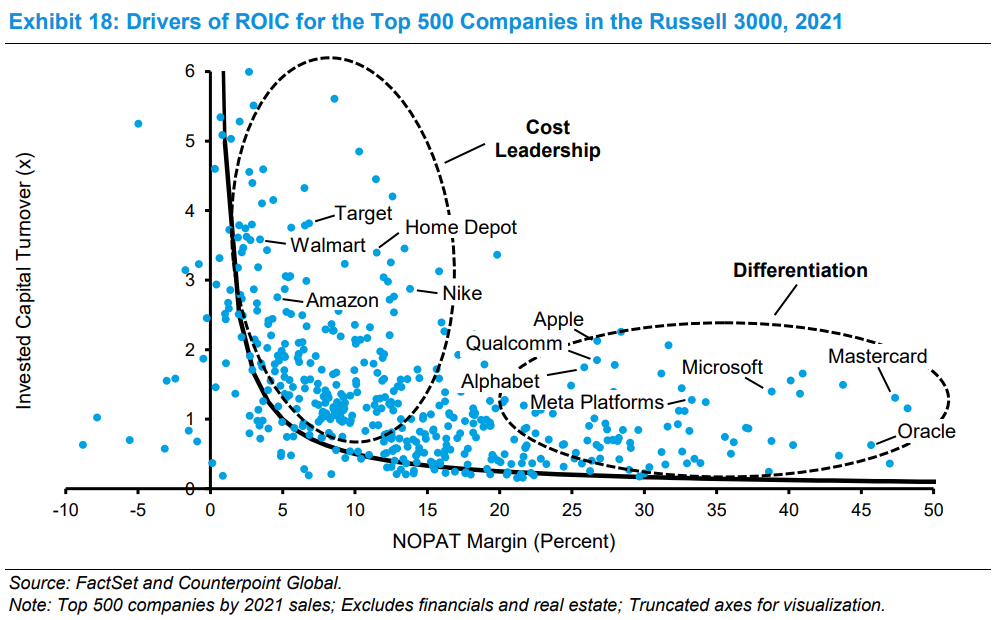
The solid black line is an isoquant curve that represents the combinations of profit margin (NOPAT) and the turnover of invested capital that equate to an ROIC of 5%, which is an estimate for the cost of capital in 2021.
The companies in the lower right corner, with relatively high margins and low turnover of invested capital, follow a strategy of differentiation.
Upper-left companies with relatively low margins and high turnover pursue a cost-leadership strategy.
We can further break down the results by looking at specific companies.
The concept of the factors that drive ROIC has been around for a long time and is commonly referred to as the DuPont analysis or formula.
How to obtain ROIC, cost of capital and other fundamental indicators of companies?
Damodaran’s NY Stern University maintains a database with the ROIC, the cost of capital (and its components) and the beta by sector for the companies that make up the S&P 500 index:
https://pages.stern.nyu.edu/~adamodar/New_Home_Page/datafile/mgnroc.html
https://pages.stern.nyu.edu/~adamodar/New_Home_Page/datafile/wacc.htm
Morningstar provides on its website the ROIC of the companies under which it does fundamental research analysis, such as Apple:


