All over the world, we must fight our bias of investing mostly in domestic securities and companies, which is against the common sense of the size and relative weight of domestic capital markets in a global world, and the fundamental rules of diversification
The Global Market Portfolio should be the starting point of any investor
However, investors suffer worldwide from a major home bias, a skewed preference to invest in their own country market, seen as the comfort zone
In the stock markets the home bias is huge
This home bias has a cost, which is very high especially regarding equities
The Global Market Portfolio should be the starting point of any investor, worldwide
Any investor shall take as a starting point the Global Market Portfolio, i.e. the portfolio representing the relative size of each market in the world capital market, in terms of the values charged.
Because, in theory, the global market portfolio, that is, a capitalization-weighted portfolio, is an optimal passive portfolio from the point of view of market efficiency. The theory is that market capitalization weights reflect the prospects of all market participants.
The following chart shows the global market portfolio, with the US domestic market:
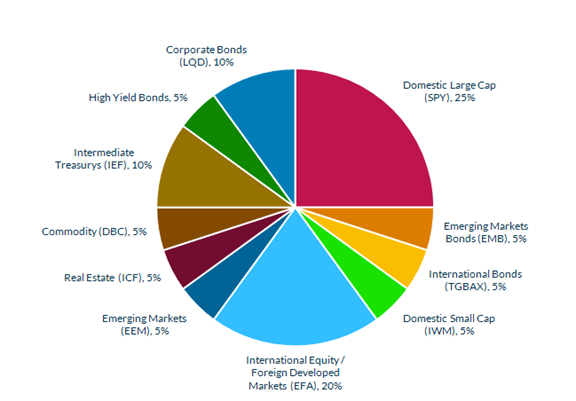
Source: Global Market Portfolio 2015, Blue Sky Asset Management
The Global Market Portfolio (GMP) is an approximation to a portfolio that is weighted by the capitalization of the global capital market and is widely diversified by the various asset classes. Its composition corresponds to the following:
- In terms of asset classes, stocks represent 55%, bonds 35%, real estate and natural resources 5%;
- In terms of geographical decomposition of stocks investments, the US accounts for 30%, the remaining developed markets 20% and emerging markets 5% of the 55% of equities allocation. This means that for investment in stock markets, the US accounts for 55%, other developed markets 36% and emerging markets 9%;
- At the bonds level, the US has 25%, developed markets and emerging markets 5% each making up the total 35%. In terms of weight, the US accounts for 72% and developed and emerging markets 14% each.
However, investors suffer worldwide from a major home bias, a skewed preference to invest in their own country market, seen as the comfort zone
Investors around the world invest a large part of their assets in domestic markets.
The following graph deepens the reality of this behaviour by disaggregating it by type or nature of the assets:
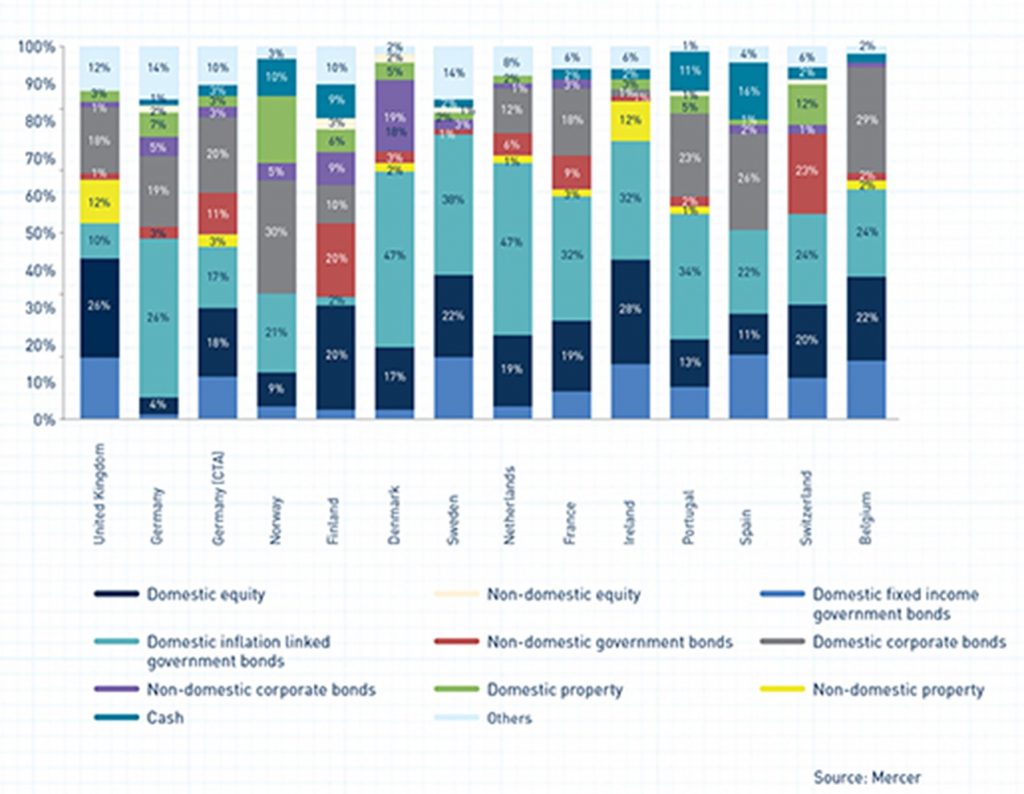
It can be confirmed that the reality of preference for domestic investments is transversal to all asset classes, whether stocks, bonds (government or corporate) or real estate.
Cash, including money market placements that are the base of the bar are represented in turquoise blue. Domestic financial assets are represented by other shades of blue and grey, which are the clearly dominant colours. International financial assets are represented by purple, red, cream and yellow colors and have little expression.
This bias of privileging the country of origin is so pronounced that the best evidence is made by showing the insignificance of international investment.
Investment in international equities (cream) has virtually no expression in any country. Investment in foreign treasury bonds (red) is a small exception, with some representation in Switzerland (22%), Finland (20%) and Germany (11%).
The investment in international corporate bonds (purple) is also of virtually no relevance, except in Denmark and Finland with small weights.
Surprisingly or not, international investment in real estate (in green) has more expression than what is done in foreign stocks, being 12% in Switzerland and ranging between 3% and 7% in most other countries.
This home bias contradicts common sense that should lead us to the most important capital markets, as well as diversification, a fundamental rule of investments.
In the stock markets the home bias is huge
The percentage of investments in stocks of domestic companies is high in all countries of the world:
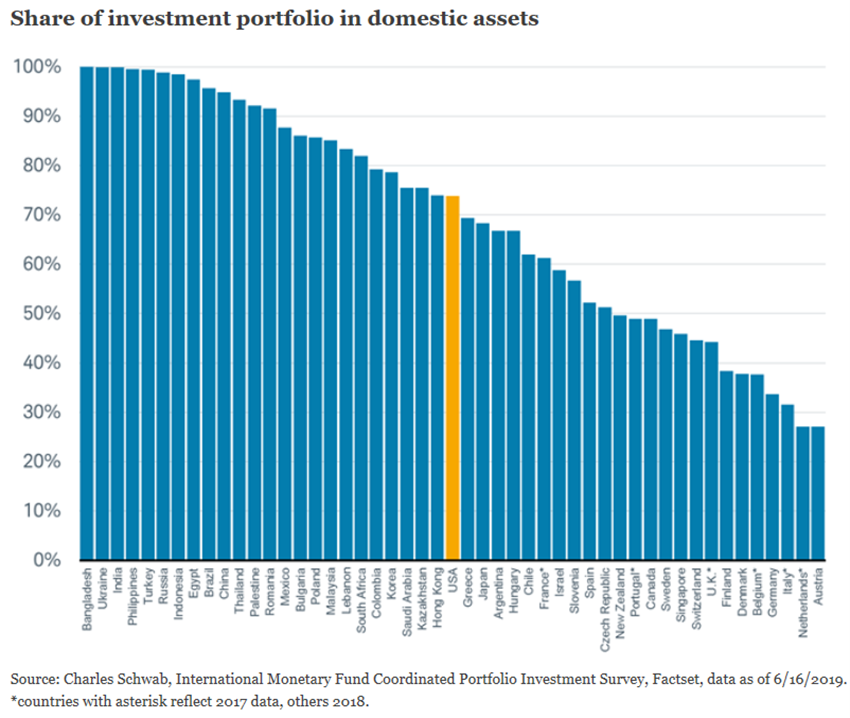
This home bias is lower in more developed European countries such as Austria, the Netherlands, Italy, Germany, Denmark, Finland, the United Kingdom and Switzerland, where the percentages of investment in domestic stocks are 30% to 40%.
It is more pronounced in less developed countries, such as Bangladesh, Ukraine, India, Philippines, Turkey, Russia, Indonesia, Brazil and China, where the same percentage is over 90%.
Portugal is halfway through, as investors split into equal shares the investments in stocks of domestic and foreign companies.
This home bias has a cost, which is very high especially regarding equities
The weight of the stock markets of the various countries in 2020 was as follows:
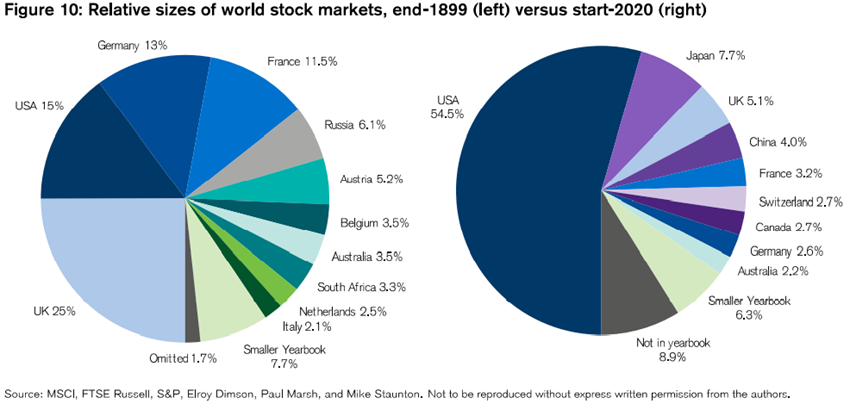
The US weighs more than 50%, followed by Japan with 8%, UK with 6%, France, Germany, China, Canada, and Switzerland with 3% each, and less than 20% for all other countries in the world.
The differences in annual real returns of the various countries have been great in the last 117 years:
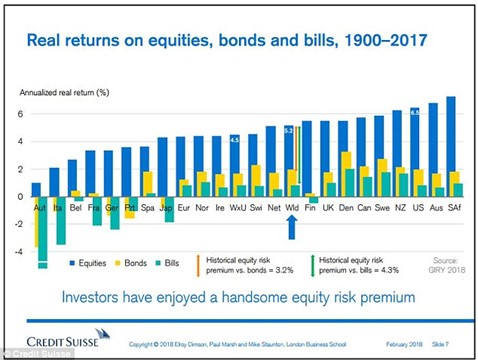
The world stock market had an average annual real return of 5.2%, with the US at 6.5% and the Rest of the World at 4.5%.
Large countries that lost wars, such as Germany and Italy, or small countries such as Austria, Portugal and Spain, had lower annual real returns, between 1% and less than 4%.
In recent years this divergence is even greater:
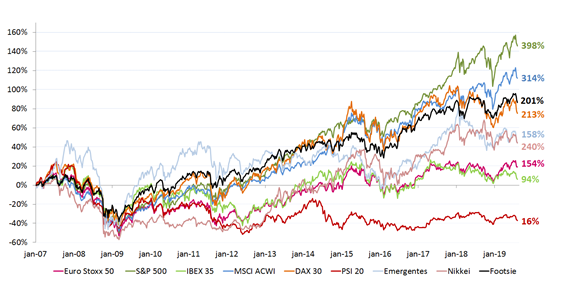
From the bottom of the great financial crises in March 2009 to the end of 2019, the main US stock index (S&P 500) had an appreciation of almost 400%, the world (MSCI ACWI) of 314%, the German (DAX) of 213%, the Euro zone (Eurostoxx 50) of 154% and the Portuguese (PSI 20) of only 16%.
strategic-asset-allocation-brief-tlor.pdf (vanguardinvestments.se)


