Explanation #2: Different composition and contributing factors for GDP and financial market indices
Explanation #5: Different economy as fiscal policy sustains household incomes
The hobbies of “Discover the differences” or “Where is Wally” were and are still quite popular and can apply to this issue of the disconnect between the economy and the financial markets caused by the crisis.
In fact, we have two divergent records of the economy and markets that should be and are usually aligned and synchronized.
Financial market analysts and investment managers are divided into opposite poles.
Many have stated that there is a profound disconnect between markets and the economy, based on the factuality of the data, i.e. markets in maximums and depressed economy, in contraction of output and employment. Many others argue the opposite, that markets are at maximums because the economy was well before the pandemic, is reacting well to the measures adopted and will have a rapid recovery because there was no destruction of productive capacity, but rather suspension or shutdown of activity.
The answer to this question starts by trying to find out why eventually the differences are not so evident or there are some small similarities that are becoming important.
We conclude this exercise by considering the various arguments and concluding whether we have disconnection or not.
Let us not take the suspense to the end, because the development will be something extensive. We anticipate the conclusions. While there are some valid reasons for the good performance of the markets, we believe that markets are being too complacent for the real economic situation. In our view, it is very difficult to justify markets at levels close to highs or to recover to pre-pandemic levels with the present economic context. Unless the silver lining or silver bullet of a vaccine and/or effective treatment is just around the corner!
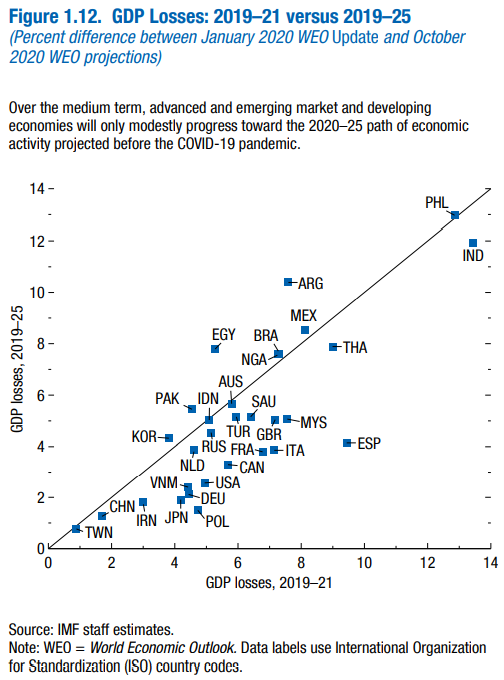
In a year of severe recession and despite the latest IMF estimates point to a global output loss of $25 trillion between 2020 and 2025, some financial markets are trading at near-highs and others have already recovered much of the falls from March to May
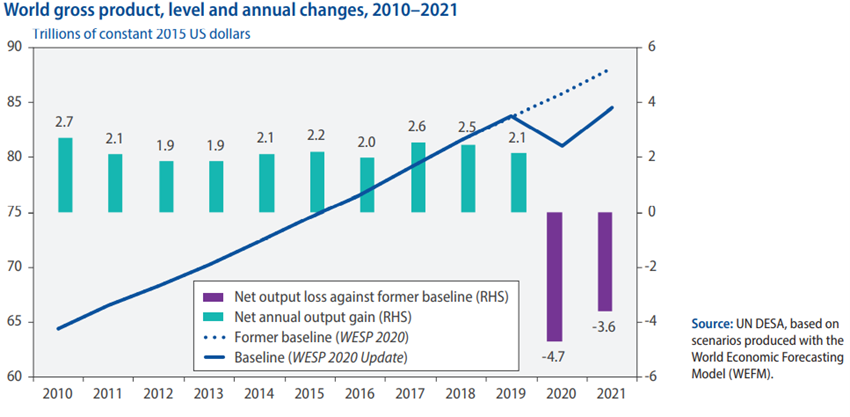
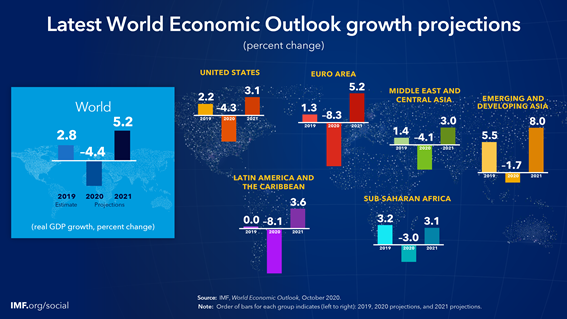
With the shutdown of activity due to the pandemic, world GDP will contract by about 4.4% in 2020, and recover about 5.2% in 2021, according to the latest October forecasts made by the IMF.
The IMF also estimates that this event will represent a total loss of 25 trillion by 2025, due to the fall in activity in general, the bankruptcy of companies and the reduction not only of temporary, but also permanent employment.
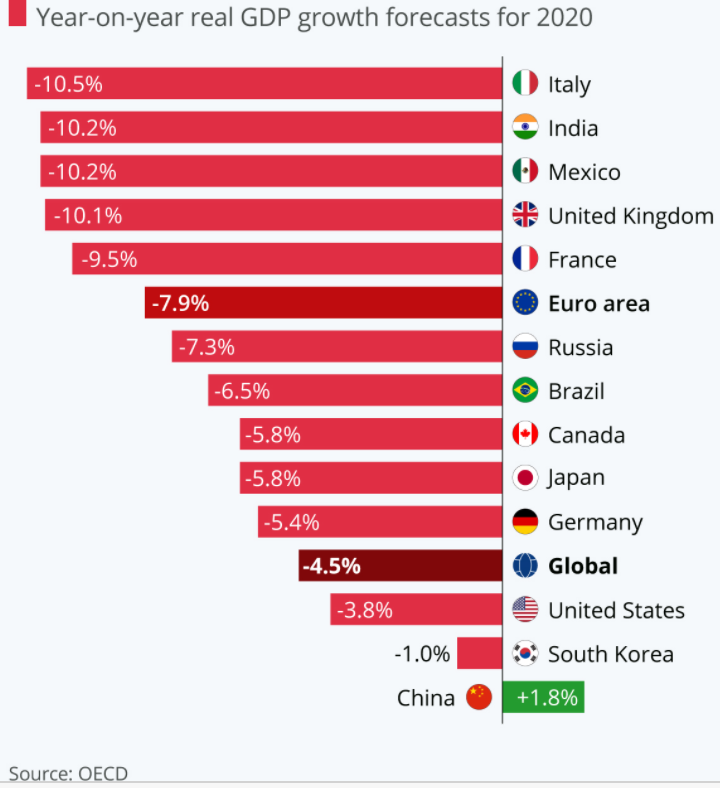
There are large countries deeply affected and where the incidence of the pandemic was higher, such as many European countries (Spain, Italy, and France), India and Brazil. At the level of the big economies only China will have growth in 2020, but modest.
OECD unemployment rate in August stood at 7.4%, 2.2 percentage points above the level seen in February, before the covid-19 pandemic hit the labour market. 48.4 million people were unemployed in the OECD area, 13.5 million more than in February, not counting temporary redundancies or Eurozone lay-offs that do not come into employment statistics.
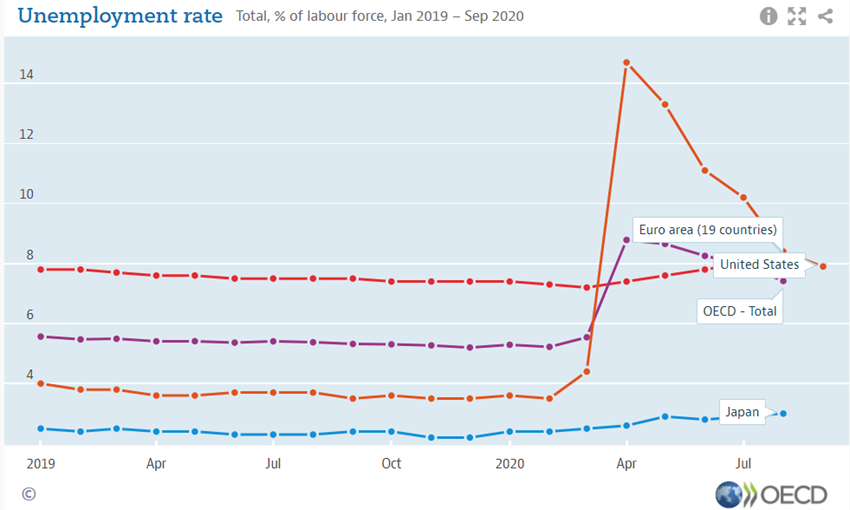
The big question is whether it makes sense to have an ongoing pandemic and having the markets trading at levels higher than pre-pandemics
Despite the severe economic situation, financial markets, which in the early stages of the pandemic have fallen by between 30% and 40% have recovered rapidly since April and are already trading close to peak levels.
This movement was observed both in the stock markets and in the bond markets. It is true that it did not have the same intensity in terms of countries. Performance was better in the US and emerging Asian countries than in Europe.

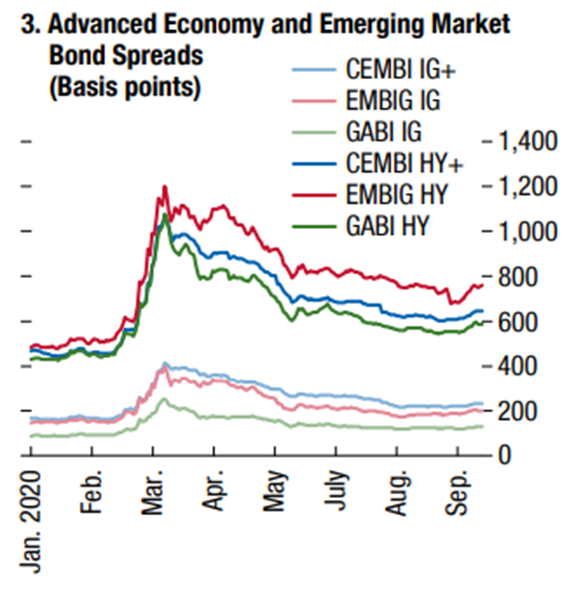
Source: Global Financial Stability Report, IMF, October 2020
So, the big question is whether this dichotomy makes sense. Can financial markets be doing just as well with a fragile and vulnerable economy?
Explanation #1: This is a different crisis in which economies were growing well and there was no destruction of productive capacity
The first issue is that this is a different crisis from all the others.
Unlike the previous ones, the economy was well all over the world and this crisis did not cause destruction of productive capacity. What happened was that the activity temporarily stopped, and the subsequent reopening of the economies allowed the resumption of the activity levels.
The forecasts before the pandemic were for higher global economic growth, although a lower level was already estimated for the big Group of Four, China, the Eurozone, Japan, and the US.
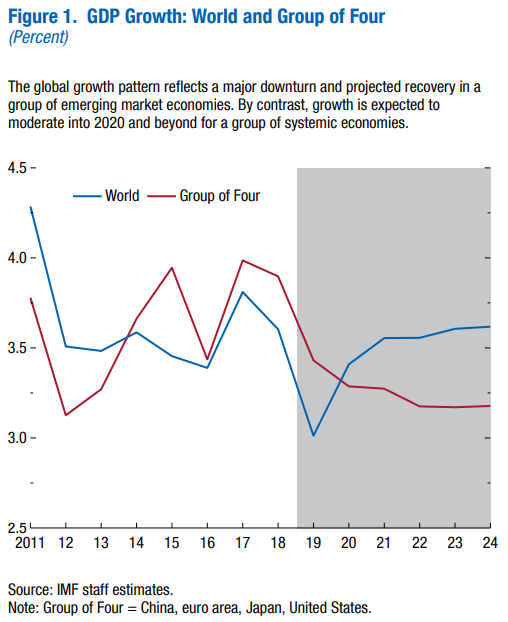
Explanation #2: Different composition and contributing factors for GDP and financial market indices
The explanation that is most used to justify the disconnect is that the economy is not the financial market, specifically the stock market, and vice versa.
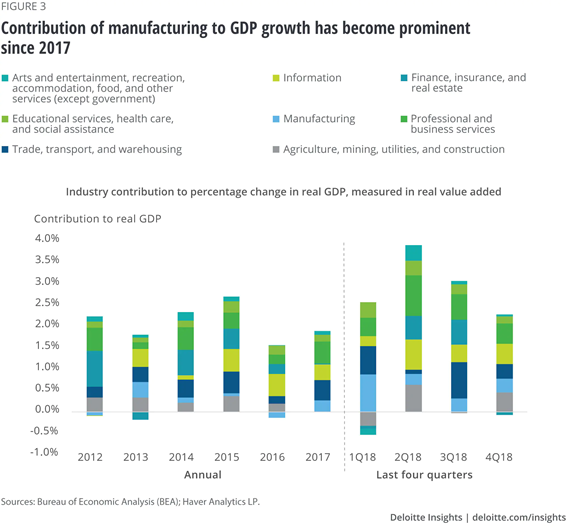
In the US, the sectors that contribute the most to GDP are financial (21%), transports (14.7%), business services (13%) and industry (11%). Information technologies account for only 6%.
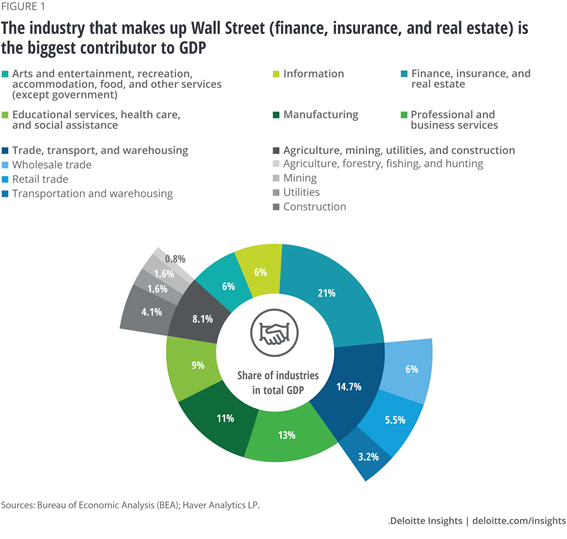
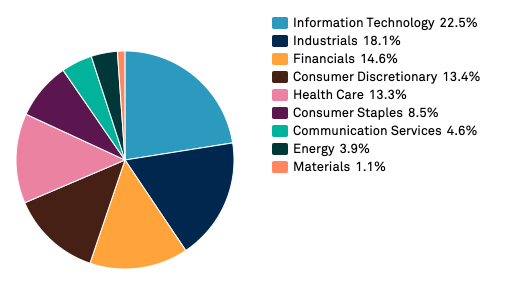
When we look at the main equity market indices we see a very different situation. The sectors that have the most weight in the S&P 500 are information technologies (22.5%), industry (18.1%), financial (14.6%) and discretionary consumption (13.4%).
This composition is even more pronounced in the Nasdaq index, where the weight of information technologies, health and telecommunications is even higher.
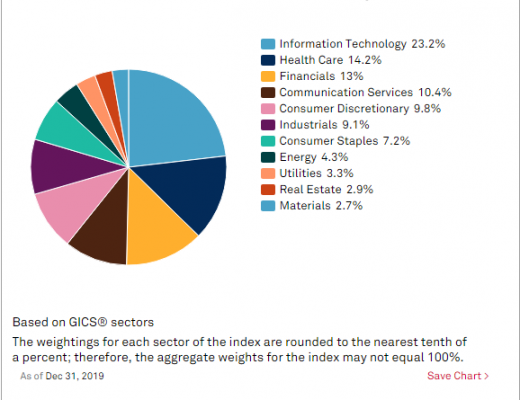
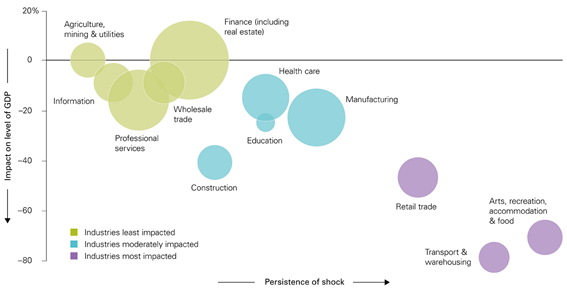
And it is quite true that there have been hard-hit sectors such as tourism, aviation, cruises, hospitality, catering, the arts and shows and the small family business in general. But on the other hand, there are sectors that have benefited and grown a lot, such as information technologies or remote work and work from home.
Explanation #3: Companies with the most weight in indexes have had very sharp gains in absolute and relative terms and are pushing the markets higher
Companies with the most weight in the indexes, such as FAAMG, others from WFH and Tesla had extraordinary gains after the drop in prices in March, rising 100% and some 400%.
The top 5 technology companies in the S&P 500 rose 30 percent, while all the remaining 495 companies (as well as the Russell index’s 2,000 companies) fell 10 percent by the end of September.
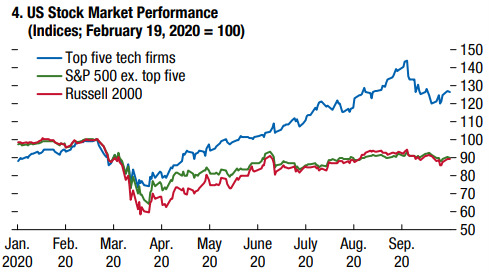
These companies have increased their revenues and profits. However, the paid multiples increased a lot.
The question is whether this behaviour is sustainable. That is, if investors think that these companies are really worth this and will have future earnings growth that will justify these prices paid or if what happened was motivated by a rotation of assets, from bonds to stocks or within stocks, a follow the herd momentum or even the high stakes of buying call options buying by young or new individual investors or institutional investors like Softbank who have placed large bets.
Explanation #4: Different dynamics as monetary policy and low interest rates bring TINA and FOMO and asset price inflation
Another widely used explanation has to do with the effects of very aggressive monetary policy.
In response to the pandemic, monetary authorities around the world have adopted an expansionary monetary policy of shock, unprecedented to date. They lowered benchmark interest rates and launched an asset purchase programme that covered not only public debt but also corporate bonds and even speculative grade bonds and index ETFs.
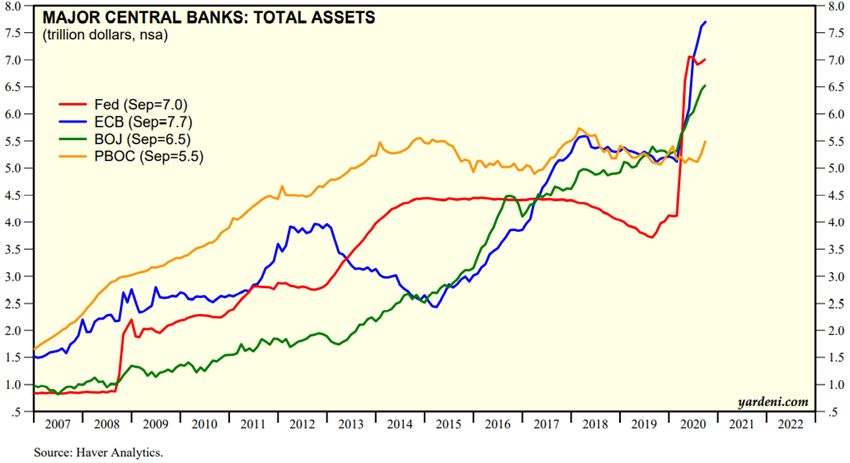
We can get a better idea of the gigantic order of intervention by looking at the US money supply growth chart between 1960 and 2020:
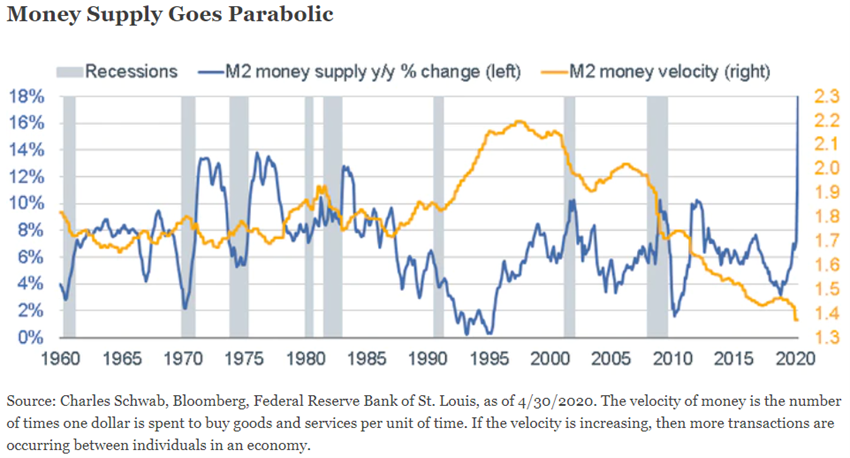
When one compares the 3 Quantitative Easing programs developed by the US since 2008 in response to the Great Financial Crisis with the current program, those look like a child’s play.
In good rigour there is a high correlation between the size of the balance sheets of the major central banks and the evolution of the main US stock index, the S&P 500:
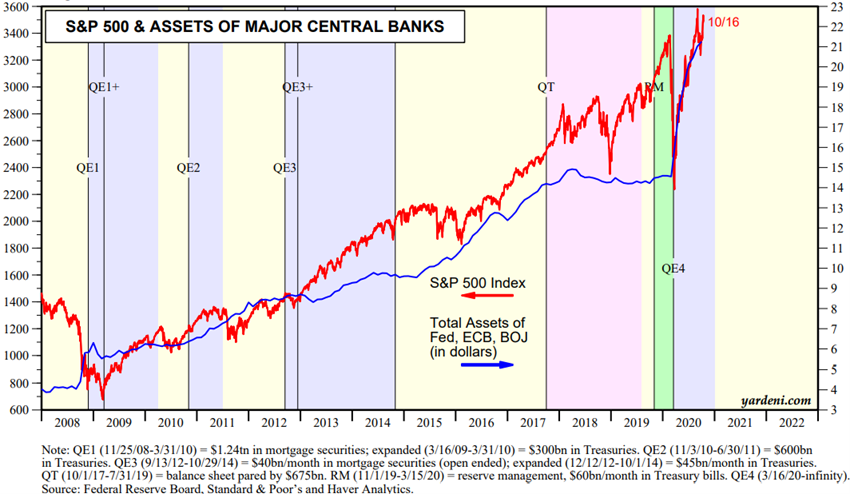
The increase in the Central Bank’s balance sheet puts money in the economy and inflates the price of financial assets. The low interest rates and good behaviour of the stock markets environment feed behaviours like TINA (There is No Alternative), or FOMO (Fear of Missing Out).
This monetary policy has significantly lowered interest rates for households, businesses, and governments, allowing them to reduce debt burdens, reduce financial costs, increase disposable income and reduce the impact on the deficit and government debt. In addition, it has endowed the corporate liquidity debt market to cope with the stress of the markets.
However, central bank balance sheets have huge investments in public and corporate debt and commercial banks have immense liquidity.
Explanation #5: Different economy as fiscal policy sustains household incomes
This very muscled action of the monetary authorities was accompanied by an equally strong fiscal or budgetary policy.
Governments around the world have developed a deep, broad-spectrum income protection policy, comprising direct support for families who have lost their jobs or reduced activity, such as increasing the value of unemployment benefits and access, support for companies that have not fired workers, as well as the rescuing companies operating in hard hit sectors such as aviation.
At the same time, governments have implemented moratorium programs on bank loan payments and housing rents.
This action of governments has been facilitated by the low interest rates provided by monetary policy, by allowing to finance greater indebtedness.
The aim is to build a bridge to support income, revenue and capital that will enable countries to avoid the costs of frictional unemployment, closure and subsequent reopening of the activity as much as possible.
Especially because of the generosity of these policy measures, households have seen disposable income and savings rates increase in most developed countries, especially in the US and most European countries (low interest rates and low oil prices also helped).
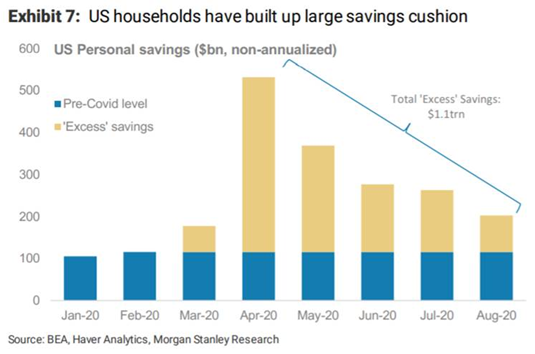
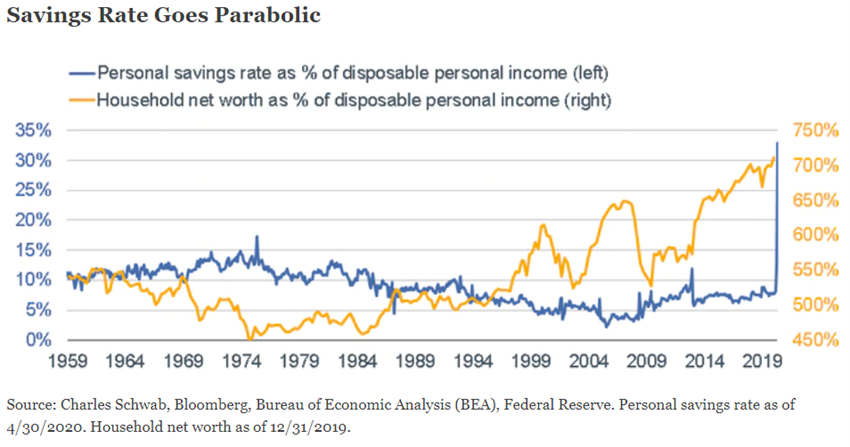
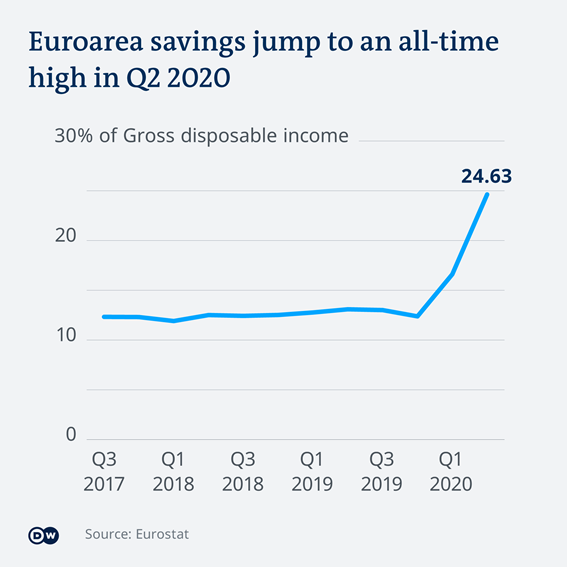
However, this oxygen bubble results in a poor allocation of resources by the various agents, namely allowing the creation of many zombie companies, that is, companies that should have already failed are still in activity.
Explanation #6: Different perspective of the actual data versus expectations, present and future, reality and forecast, translated into the divergence between pure rationality and sentiment
The perspectives of economists, government officials and other economic policy makers are very different from those of most investment analysts and asset managers.
In some cases, the former accumulate functions with the ones of public health officials. The former make predictions based on lagging and current indicators and see imbalances. They see an economic recovery in K (uneven distribution) or W (new slowdown after recovery). They live more in the present and are more rational, factual, and realistic. The numbers of unemployed and bankrupt companies’ weight on their shoulders.
The latter see the present but weight more on the prospects. They form opinions based on expectations. As asset prices are discounted cash-flows of future income streams generated, they are more positioned towards tomorrow. They consider that current prices already incorporate the past. By giving more importance to the future, they favour the leading indicators, which are indicating a good recovery. They consider that the best indicators are the performance of stock market and the expected earnings of listed companies. They see a V-economy recovery.
The current expectations of the consensus of market analysts and asset managers are that we are on a path to rapid normalization of activity after the shutdown from March to May. They do not allow setbacks in the recovery and resumption of activity, also understanding that if necessary, the policy makers will make further easing interventions. They estimate that effective vaccine and/or treatments will be coming soon.
Economists predict this behaviour:
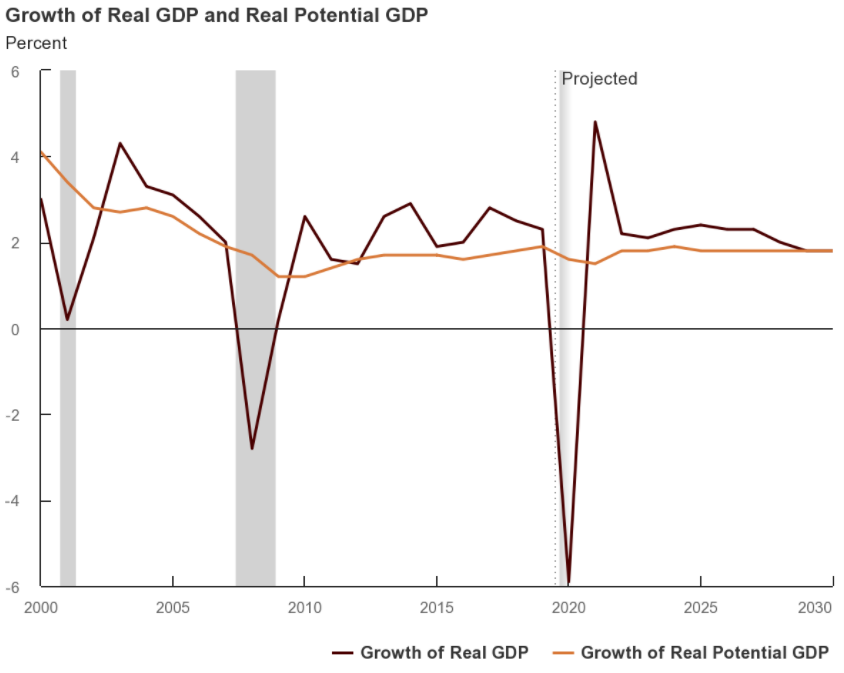
While most financial market analysts and managers place more importance on advanced economic indicators such as business surveys and business performance estimates:
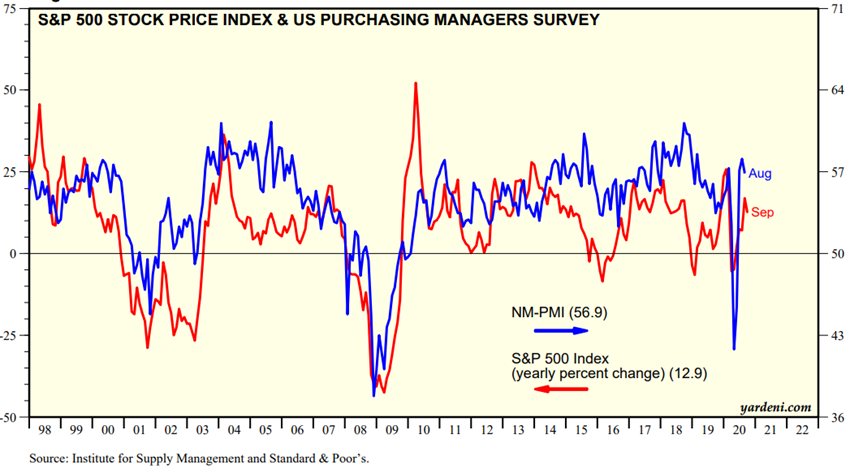
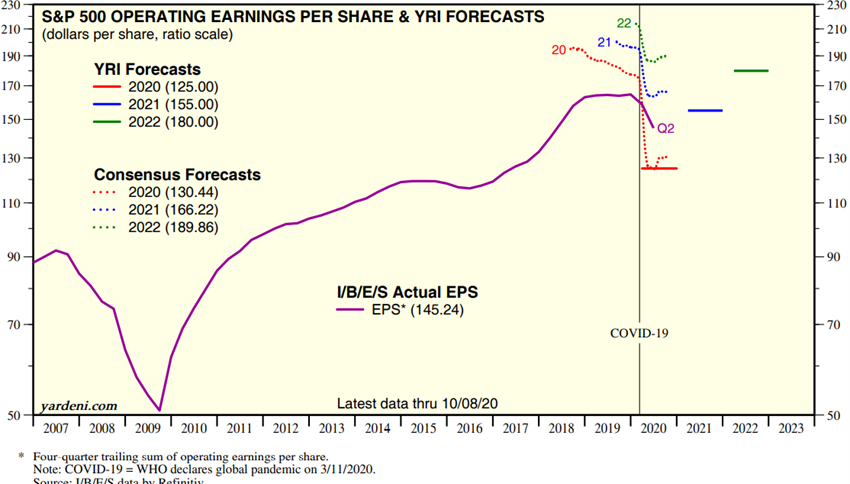
In conclusion, markets are too complacent and too vulnerable to corrections associated with worsening sentiment and changes in the activity, but there is a silver lining or even silver bullet that there will be a vaccine and/or treatments around the corner
Whatever angle you look at is unequivocal that the markets are a bit expensive. The market PER (Price Earnings Ratios) multiples or the quotient between prices and earnings per share are high in all geographies. They are at the highest levels since the Great Financial Crisis and in the case of the US are only surpassed by the levels reached at the technology bubble.
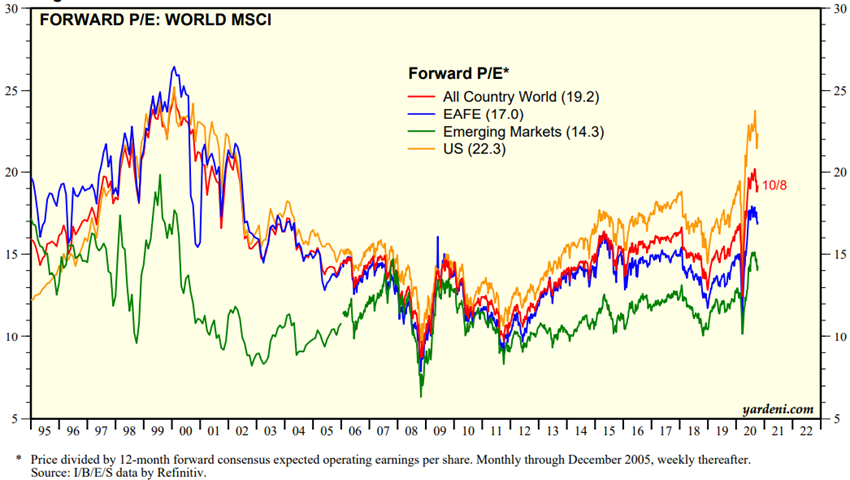
We may think that these figures are justified by the fact that the company’s earnings are depressed and are expected to grow significantly in the years 2021 and beyond. It is a possibility, but not credible in view of the present and future economic risks on the table.
In our opinion, the markets are therefore too complacent about the economic situation, which, with the bridge created by the authorities, has not yet shown all its wounds and the long time the scars will take to heal. The only factor that can change our minds is the silver lining or a silver bullet for an effective vaccine and/or treatment just around the corner.


