


The size, growth and potential for of appreciation of emerging markets are important for our investments decisions
Investing in emerging markets is tempting considering their weight in global GDP, GDP growth levels, markets past returns and potential appreciation in the future.
Emerging markets have a much lower weight in global capital markets than their weight in world GDP.
Emerging markets have much higher GDP growth rates than advanced economies.
In the recent past, emerging markets have had much higher returns than developed markets.
As it would be expected, emerging markets are more volatile than developed markets.
Currency being one of the main factors of volatility.
Who are the emerging markets?
MSCI is the world’s leading benchmark for stock market indices and classifies emerging markets as follows:
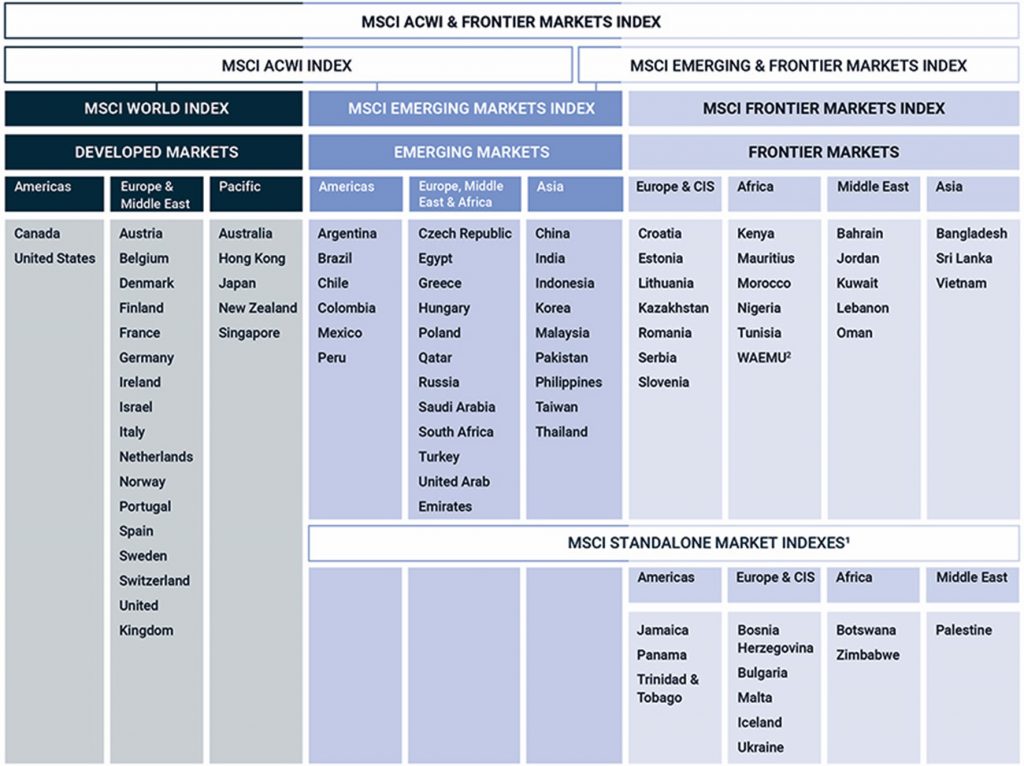
The weights of the major emerging economies in the index are as follows:
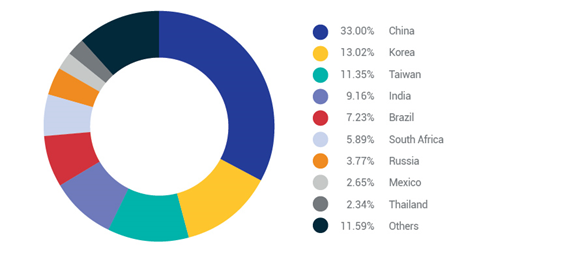
China with 33% is the country with the greatest weight, followed by South Korea with 13%, Taiwan with 11%, India 9%, Brazil 7%, South America 6%, Russia 4%, Mexico 3%, Thailand 2%, and the remaining countries 12%.
However, these weights have varied in recent years:
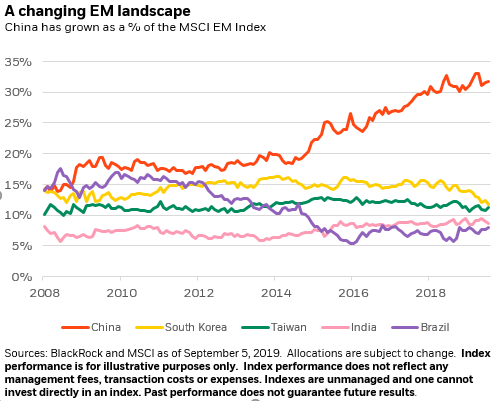
From 2008 to date, China has increased its weight from 15% to 33%, mainly at the expense of Brazil, which has gone from 15% to 7%, South Korea, which has gone from 15% to 13% and other countries. Taiwan and India have seen their weights increase slightly.
China’s growth has been the main responsible for Asia’s increased weight in emerging markets:
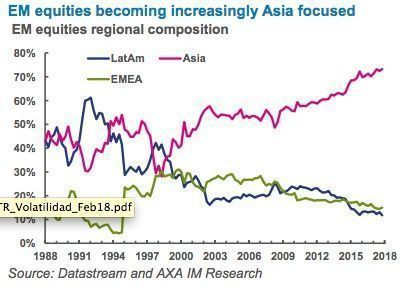
Asia accounts for 70% of emerging markets, 30% more than in 1988, by reducing the weights of Latin America and Eastern Europe.
In the following chart we have the breakdown of emerging markets by country between 2003 and 2017:
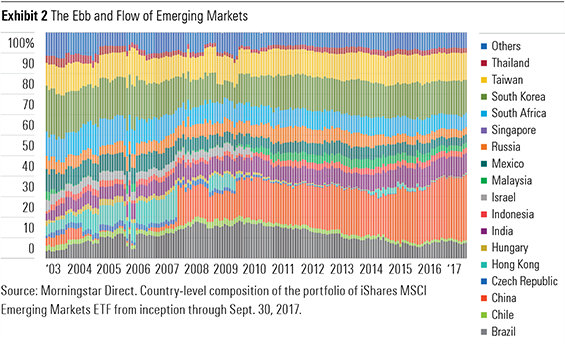
Once again, we highlight the continued increases of China and India, and the decreases of Brazil, Russia, and South Africa.
Emerging markets have a much lower weight in global capital markets than their weight in world GDP.
Emerging markets are very under-represented in market indices considering their GDP:
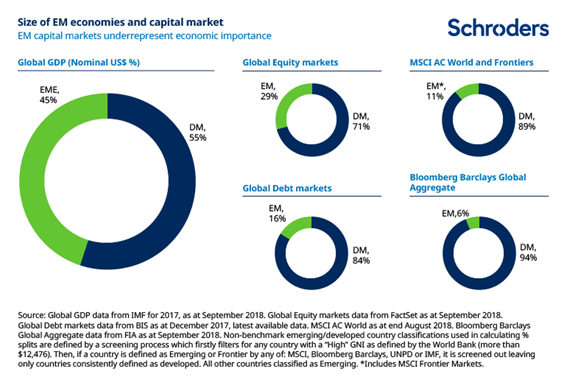
Emerging countries have a global GDP weight of 45% and only weigh 29% in the global stock markets and only 16% in terms of bond markets.
However, they have been increasing their weight in recent years:
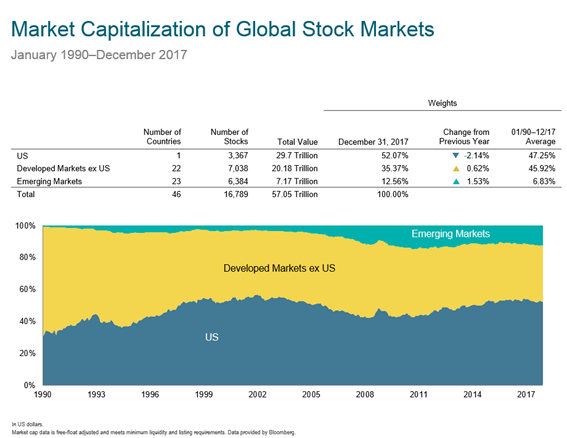
In 1990 emerging stock markets were virtually non-existent.
Emerging markets have much higher GDP growth rates than advanced economies.
Emerging and developing countries account for more than half of global GDP:
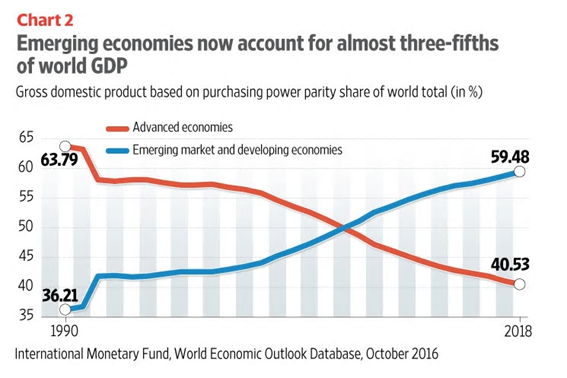
Emerging and developing economies saw their weight in global GDP increase from 36% in 1990 to 60% in 2018.
This has been the result of higher growth rates:
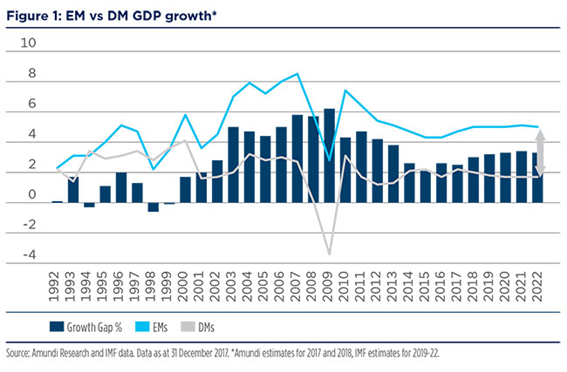
Emerging countries grew at average rates of 5%, more than double the 2% of developed economies.
In the recent past, emerging markets have had much higher returns than developed markets.
In the very long run, for a period of more than a century the returns of developed markets were much higher than those of emerging markets (this is evidence of La Palice because if not, the definition of emerging would be questionable):
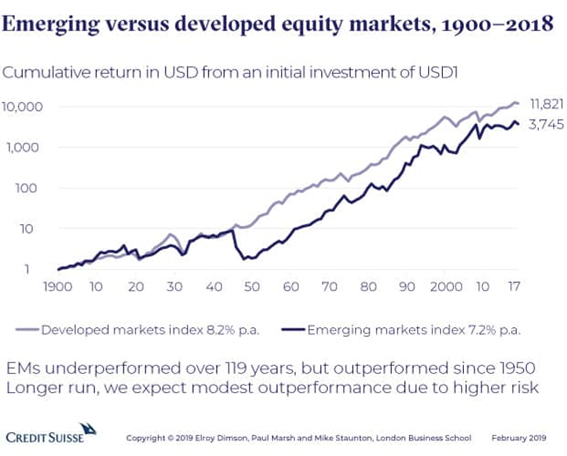
However, it is worth analysing in more detail this lower performance in the very long term.
Although the performance of emerging markets was lower over the entire 118-year period, with average annual yields of 7.2% versus 8.2% of developed markets, resulting in a cumulative performance of $3,741 versus $11,821 in 2018 for every dollar invested in 1900, we can see that in the last 50 years it has been clearly higher.
Until the mid-1940s, performance was similar, but after World War II, between 1945 and 1949, emerging markets suffered an abrupt loss associated with the 98% fall of Japan, the country that had the greatest weight at that date, and China, another important country at the time, whose market closed in 1949 following the victory of the Communist Party, and where investors lost everything. Spain and South Africa also performed poorly in that period.
This issue becomes more evident in the following chart showing the returns of emerging and developed markets in each decade between 1900 and 2018:
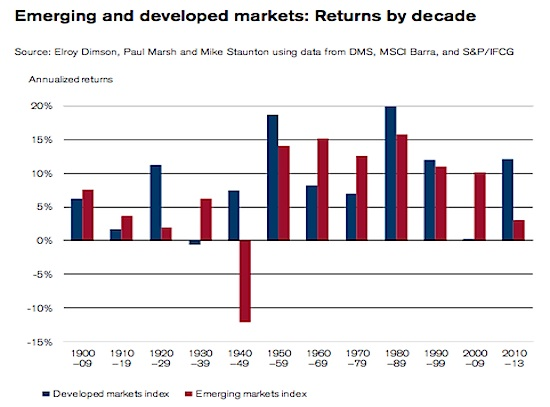
The biggest difference in underperformance in emerging markets occurred in the 1940s, when emerging markets had negative annual returns of -12% versus the positive +7% of developed markets.
In the recent past 50 years, emerging stock markets have had significant performances:
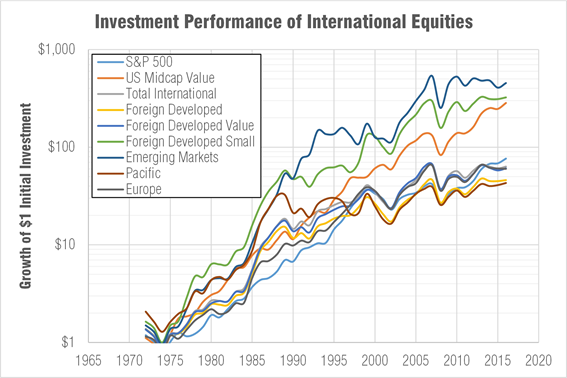
Emerging markets stand out as the best performing between 1975 and 2016, with an accumulated appreciation of almost 700 times, which compares with 90 times in the US market.
A dollar invested in 1972 would have resulted in $600 in emerging markets and “only” $80 in the main US index, the S&P 500, in 2016.
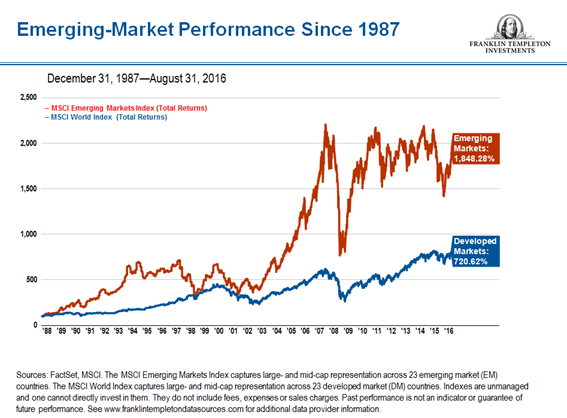
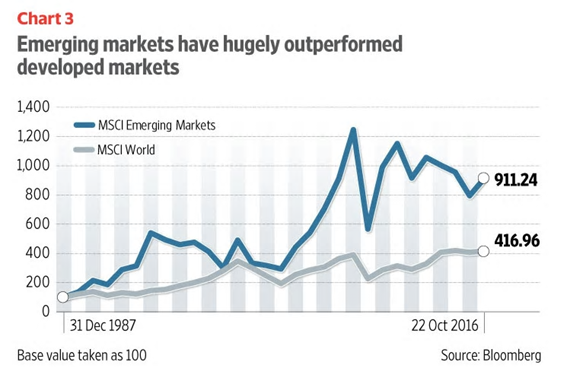
Between 1988 and 2016 emerging stock markets rose 1,848%, more than double the 720% of developed markets:
As it would be expected, emerging markets are more volatile than developed markets.
Once again it is proven that there are no free lunches, and to higher returns corresponds greater risk:
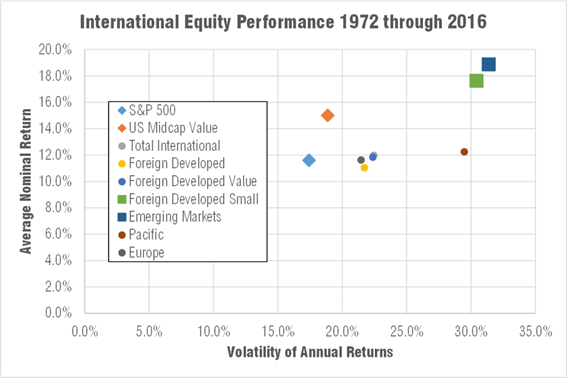
Between 1972 and 2016 emerging markets had average annual returns of almost 20% and volatilities of 32%, which compared with the S&P 500 index with returns of almost 12% and volatility of 17%.
Fonte: MSCI
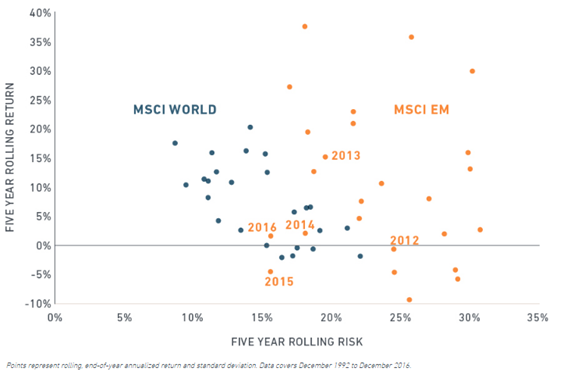
In terms of annual returns for 5-year periods between 1992 and 2016 the conclusion is the same: higher returns correspond to higher volatility.
However, since 2012 this has not been the case, with an unfavourable development for emerging markets.
Currency being one of the main factors of volatility.
The currency represents a very important factor of volatility, unlike in developed countries where it is much more stable:
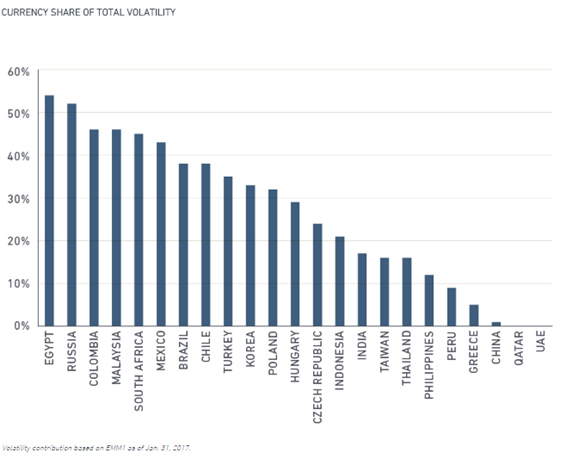
In many countries the currency represents more than 30% of volatility, reaching more than 50% in some cases.
The dispersion of returns between countries that make up the emerging markets is large and has been increasing.
Volatility is also expressed by the dispersion of annual returns in the various countries that make up emerging markets:
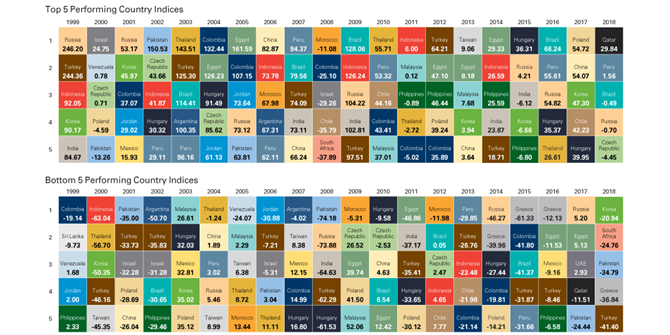
Even excluding the years 2007-2008 from the sub-prime crisis, there are countries that have returns of more than 100% in a single year and lose more than 30% in others. Russia, Brazil, Poland, and China are both in the table of the 5 countries with the best annual returns and in the 5 countries with the worst.
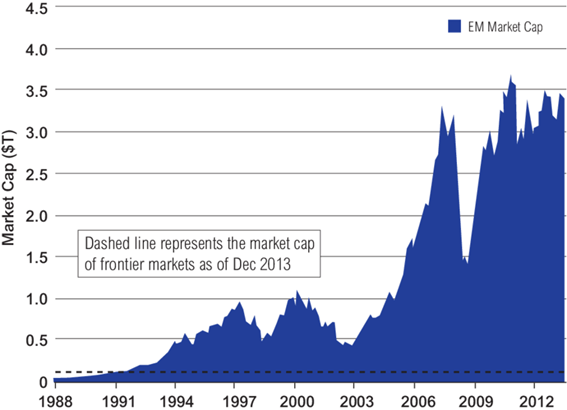
Theory and common sense tell us that the potential for appreciation of emerging markets must be greater by the better growth prospects and capital market development.
The increase in the market capitalization of emerging markets shows a clear trend of growth:
Emerging capital markets still have a weak weight in relation to their GDP:
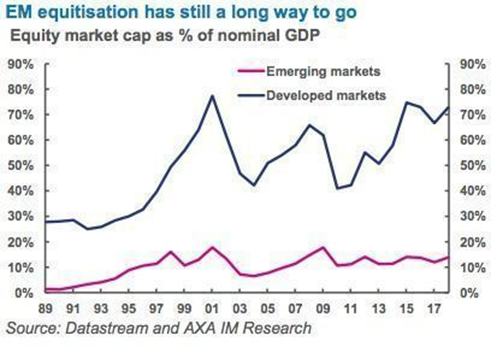
Emerging countries have more incipient capital markets and have a weight to their GDP of less than 15% which contrasts with more than 70% of developed economies.
In the future this weight will increase and reduce the gap compared to developed countries as is happening in the last 50 years.
Knowing the importance of home bias, it is important to be aware of the growth of the middle class in these countries:
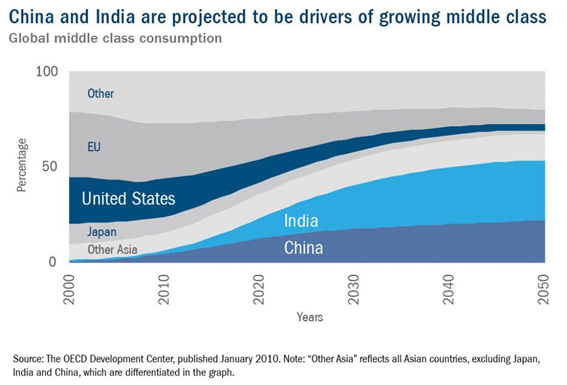
China and India will account for 50% of world middle class in 2020 from less than 20% today.


