Over the past 15 years, monetary expansion has been huge with quantitative easing programs
The absurdity of negative interest rate distortions in periods of growth
These policies have had a very positive effect on the returns and risks of bonds and stocks
In the first part of this article we saw that at the origin of the long bull market of bonds was monetary policy.
In this second part we will see that it was this same policy that fed and strengthened it to an extreme level.
Over the past 15 years, monetary expansion has been huge with quantitative easing programs
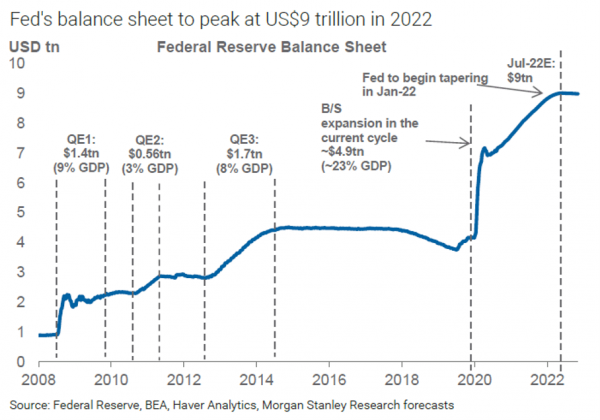
In order to promote economic growth after the Great Financial Crisis, central banks bought large amounts of bonds to inject liquidity into the economy, implementing an extraordinarily expansionary monetary policy.
This demand from central banks has competed with normal demand from individual investors and institutional investors for bonds.
Monetary stimulus programs were very intense in supporting the economy.
Following the GCF there were 3 major economic stimulus programmes and 1 more superprogrammes in response to the pandemic.
And whenever the economy showed signs of some cooling and the spectrum of deflation rose, as in 2014 and 2018, the FED and other central banks intensified asset purchase programs or lowered interest rates:
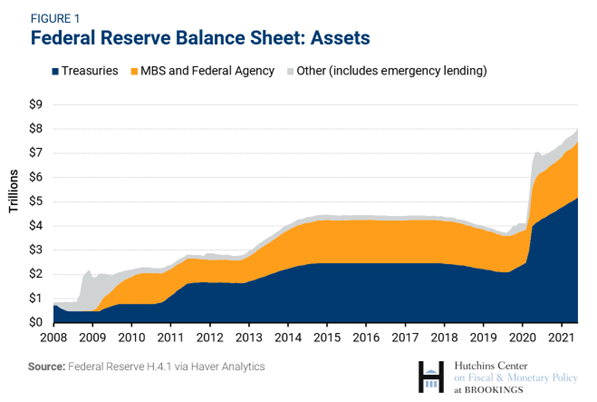
Asset purchases focused primarily on treasury bonds, but also agency and company bonds, as well as other more speculative securities:
In a previous article, we developed in greater depth the action, evolution and effects of monetary policy.
We have not only played a focus on its role in economic recovery, through consumption and investment, but also the side effects in terms of inflation in the price of financial assets, stocks, bonds, among others.
This effect on asset price inflation is so significant that managers and investors have made expressions such as “Don’t fight the FED” (fed stimulus overcome any adversity), and the FED “put” (the FED holds the market and does not drop it).
Managers and investors got used to, and even got addicted, to this idea.
The absurdity of negative interest rate distortions in periods of growth
The addicts weren’t just the investors.
Many high-quality and treasury bond issues in many developed countries have had negative yield rates over a long period in recent years:
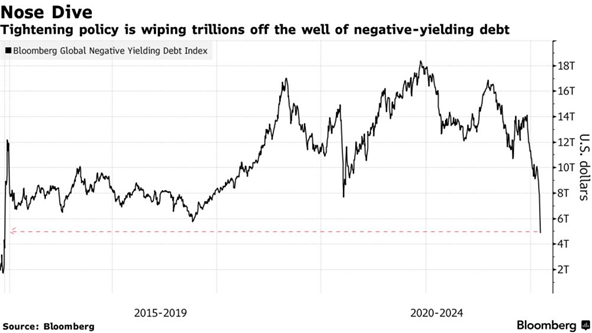
This was the case in the Eurozone, Switzerland and Japan.
This extreme situation is abnormal and irrational.
Since bonds are a debt bond, the yield rate should be positive.
In fact, this rate should reflect the risk-free interest rate, or the cost of money, plus a margin to offset the credit risk.
Either of these two factors should be positive.
We addressed this situation of negative interest rates with further development in an article that we published in due course on how to manage investments in this environment.
These policies have had a very positive effect on the profitability and risks of bonds and actions
This bull market provided very high returns on bond investments:

Long-term bonds have provided investors with annual returns of nearly 10%.
This compared with much more modest annual returns of 3% in the previous 50 years.
In a previous article, we saw that annual bond returns over the whole period, from 1926 to date, were 6.2%, also much lower than the 40-year bull market.
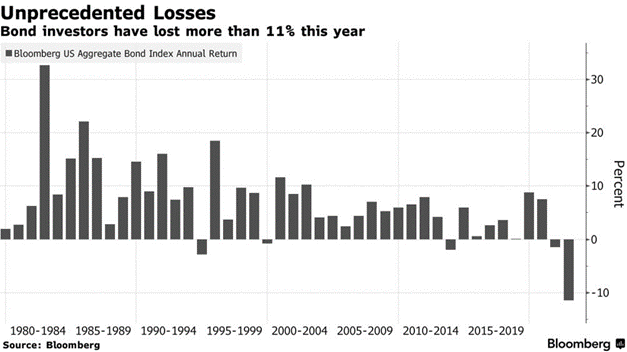
In the following chart we can see the annual returns on bonds from 1980:
But it wasn’t just the bonds that benefited from low interest rates.
Stock returns were also higher than average:
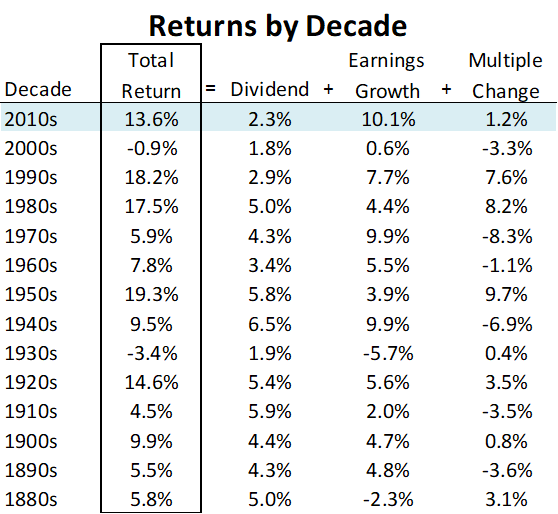
Since 1981, the S&P 500 has had returns of 11.2% per year since 1981.
As we also saw in that article, the annual returns of the S&P 500 since 1926 to date have been lower, at 9.6% per year.
And this period is part of the lost decade of the 2000 stocks, with two of the biggest financial crises of all time, that of the technological bubble and the “subprime”.
The average annual return of 10% of bonds is more impressive when compared to 11.2% of stocks.
Moreover, since 1981, the worst devaluation for long-term bonds has been about 16%.
The S&P 500 did more than that in a single day in 1987 and halved twice in that period.
As you would expect, long-term bonds also showed lower volatility than stocks between 1981 and 2019 (10.9% vs. 14.8%).
During the bull market of bonds there have been only 8 years of the last 38 years with negative returns, and only two of those years have been double-digit devaluations.
It’s been 16 years of double-digit gains, which means that much of the reported volatility comes not from the downside, but from very positive years.
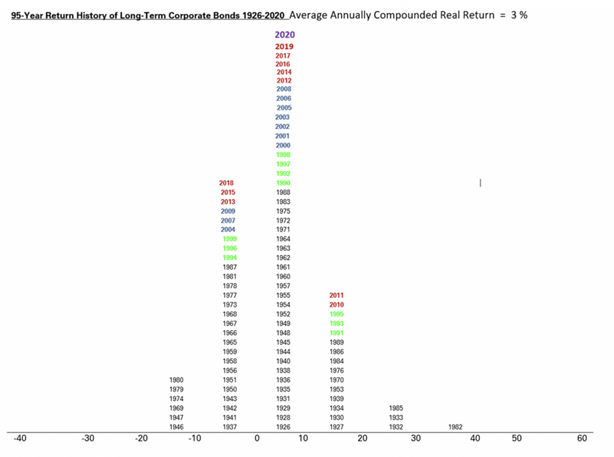
The following graph shows the distribution of annual returns in real terms of investment in bonds of investment rating companies in the last 95 years:
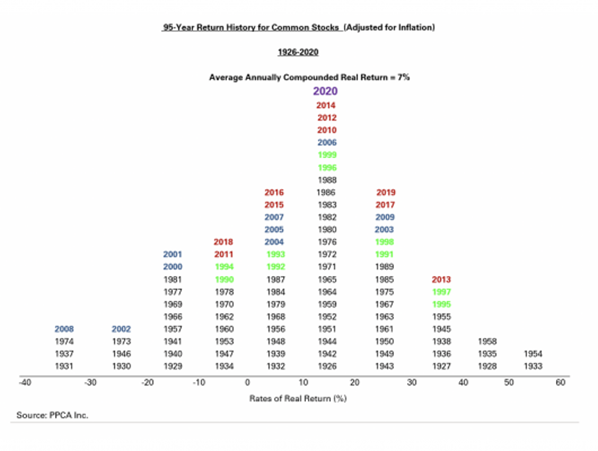
The stocks returns were also very interesting, with the exception of the lost decade of 2000:
However, everything has changed with rising inflation since the beginning of 2021 to more historical ly highs in the last 40 years, from more than 8% per year.
The FED began to raise official interest rates and long-term bond interest rates reflected and accompanied this rise.
This move was followed by other central banks such as the Bank of England, the ECB and the Swiss Central Bank, among others.


