


Global oil supply: OPEC+ and other producers
Global oil demand: developed countries versus emerging countries
The evolution of energy intensity
The process of energy transition
The evolution of the world oil market
In a previous article we saw a relationship between oil shocks and economic activity.
Global oil supply: OPEC+ and other producers
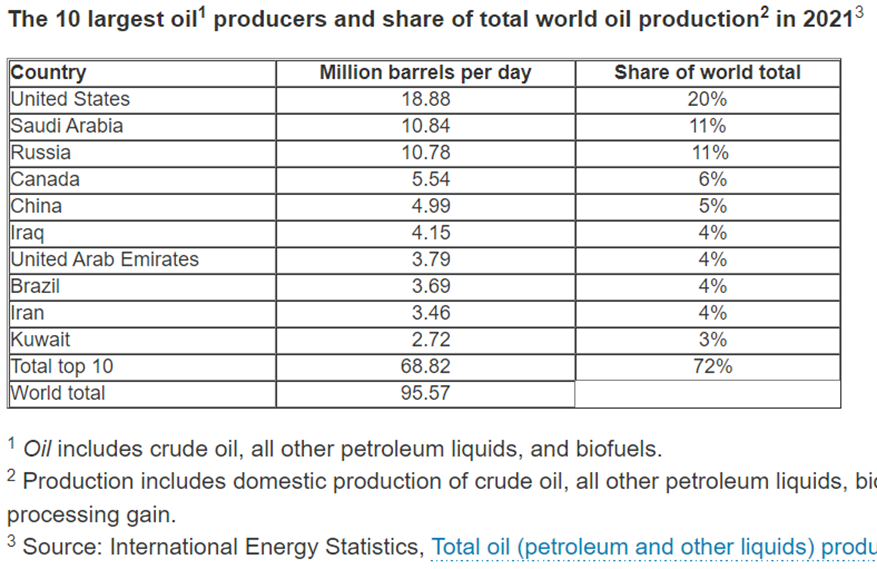
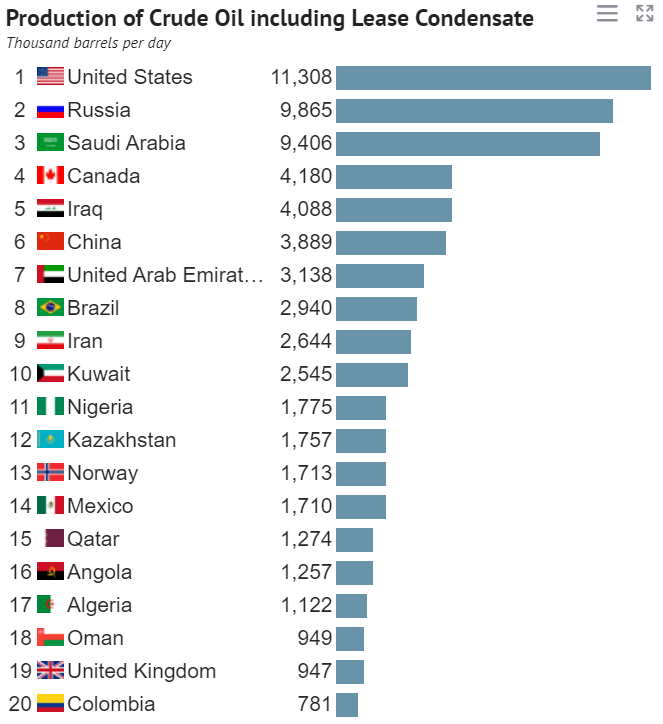
The main oil producing countries are the US, Russia and Saudi Arabia:
Source: Cost of oil production by country, August 2018, Knoema
The world’s oil production is almost 100 million barrels per day.
By 2021, the US had a 20% share, Russia 12% and Saudi Arabia at 11%.
Middle Eastern countries account for more than 30% of total production.
Oil production depends mainly on existing oil reserves, their extraction capacity and other economic and geopolitical factors.
The following chart shows the main reserves of total crude oil and OPEC countries proven in 2018:
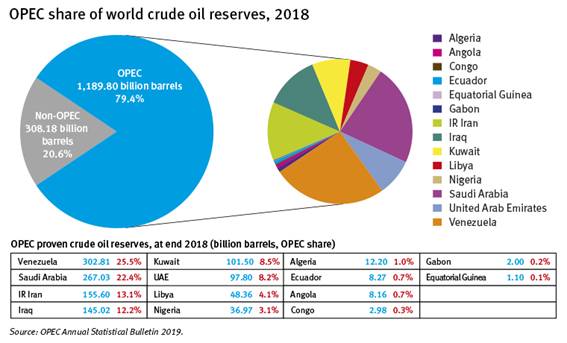
The OPEC countries with the highest reserves are Venezuela with 25%, Saudi Arabia with 22%, Iran and Iraq with 12 to 13% each, and Kuwait and the United Arab Emirates with 8% each.
Outside OPEC the countries with the highest oil reserves are Canada, Russia and the U.S.
OPEC countries account for about 40% of world production and 60% of global exports.
As we know, OPEC, which was created in 1960 with the aim of members articulating production, gave way to OPEC+ in 2017 with the extension to 10 other non-member countries, especially Russia and other former Soviet republics, and Mexico.
In OPEC+ countries, oil is held by the state while in non-OPEC+ countries ownership is owned by companies or private investors.
OPEC+ decisions and actions, in particular those of Saudi Arabia and Russia as the largest producers, influence oil prices.
Non-OPEC+ countries account for about 40% and assume themselves as price makers.
At the following link we have more information about reserves and productions:
Oil reserves are of a very diverse nature in each country, with different depths, surfaces and extraction modes.
This translates into very varied marginal extraction costs as can be seen in the following table:
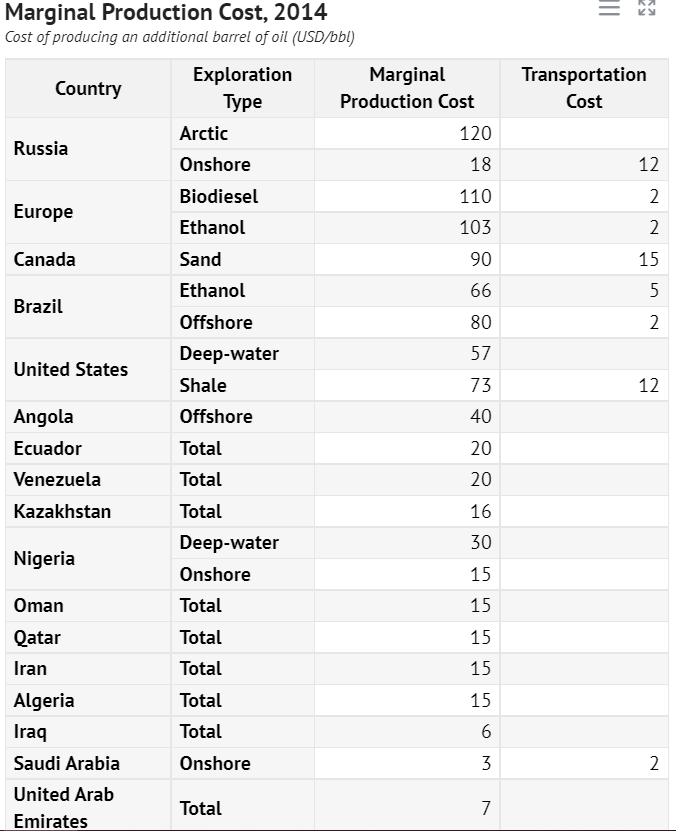
Source: Cost of oil production by country, August 2018, Knoema
The differences are significant, depending on the place of origin, the depth of the sheets and the nature of the oil.
The Middle East has the lowest marginal costs between $5/b from Saudi Arabia, $6 from Iraq and $15/b from Oman, Qatar, Iran, etc.
Nigeria and Algeria have the same cost.
South America has costs in the order of $20/b and Russia is about $30/b.
The marginal cost of shale oil in the U.S. is $85/b and that of Canada’s oil sands is $105/b.
Global oil demand: developed countries versus emerging countries and the energy transition
Oil demand has tripled in the last 50 years and has a direct relationship with GDP developments:
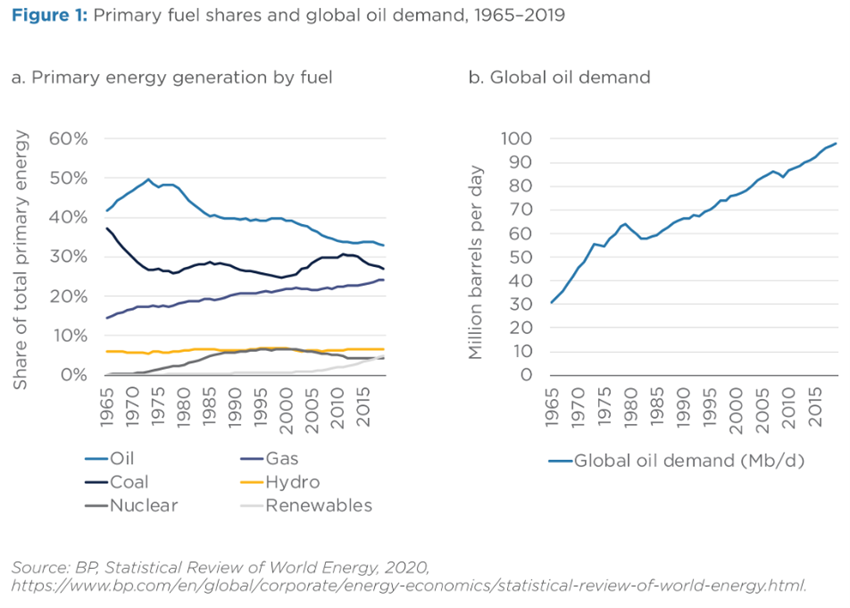
Global oil demand is about 100 million barrels per day.
Oil remains the largest primary fuel.
Like the consumption of all other fuels traded, global oil consumption continues to increase in absolute terms – 6% per year since records existed (in 1870), 1.2% since 1973, when its share of global primary energy peaked, and 1.6% in the last 10 years.
However, its market share in the global primary energy mix fell from 50% in 1973 to 33% in 2019 and continues to decline.
Although OECD countries account for more than half of the world’s oil consumption, about 53%, their consumption has been stable since 2000.
On the contrary, oil consumption has grown considerably in non-OECD countries, of more than 40% between 2000 and 2010 and with growth of about 3% per year since then, with emphasis on China, India and Saudi Arabia.
The main oil-consumer countries are the U, China and India:
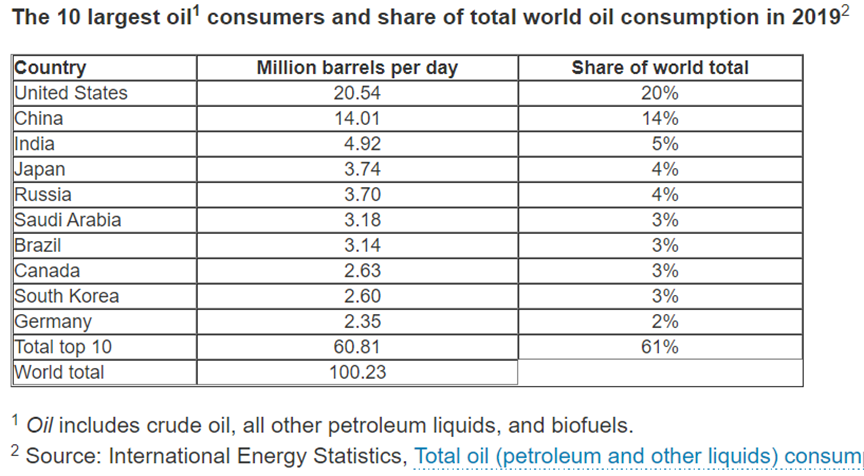
By 2019, the US had a 20% share, China at 14% and India at 5%.
The following graph shows the sector demand for oil since 2010 and the projection until 2050:
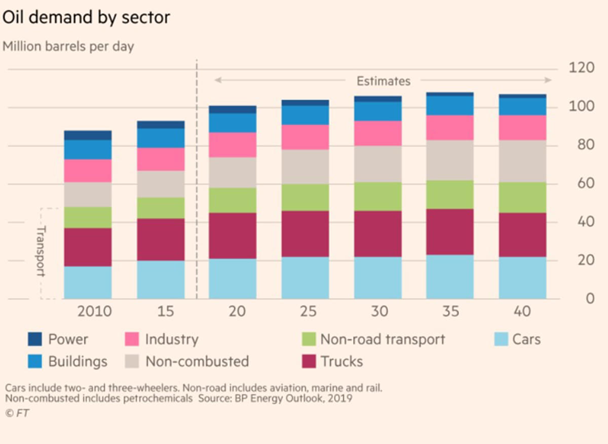
The main source of demand is transport with about 60 million barrels per day corresponding to almost 60% (road with more than 40%, and air, sea and rail with 20%).
Next comes the industry with just under 20 million barrels per day corresponding to 15%.
Petrochemicals account for more than 20 million barrels per day, about 20%.
The evolution of energy intensity
The following graph shows the evolution of energy intensity in the world:
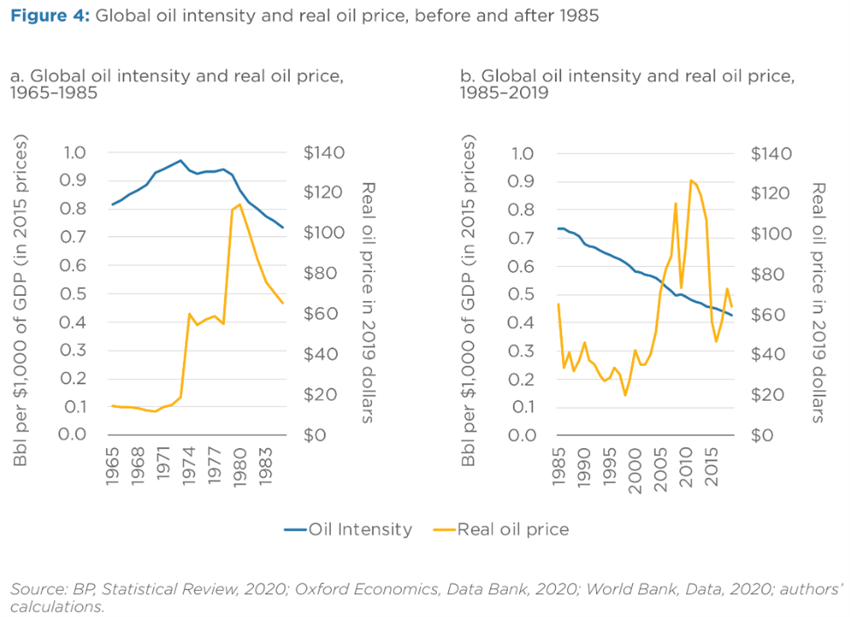
Energy intensity remained in a band between 0.8 and almost 1 barrel per thousand dollars of GDP between 1965 and 1984, peaking in 1970.
Since then, it has been gradually dropping from 0.7 in 1985 to 0.43 barrels in 2019.
The following graph shows the energy intensity by country:
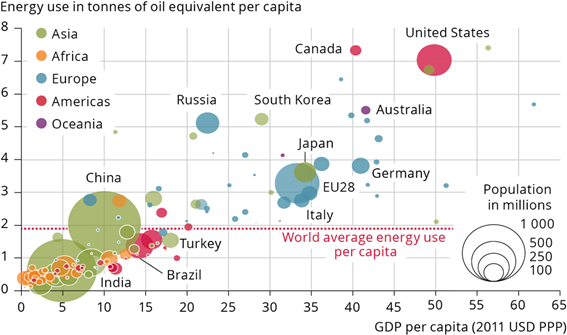
Developed countries are naturally the largest consumers of energy per capita.
The US and Canada are the largest consumer countries, followed by Australia, South Korea and Russia. Then comes Japan and the countries of the European Union.
The process of energy transition
The energy transition is the process for transforming the global energy sector, from fossil-based to zero carbon by the second half of this century, approved by most countries, to limit climate change.
The decarbonisation of the energy sector has called for urgent measures on a global scale and, while a global energy transition is underway, more measures are needed to reduce carbon emissions and mitigate the effects of climate change.
Measures to increase renewable energy and energy efficiency are considered to potentially achieve 90% of the necessary carbon reductions.
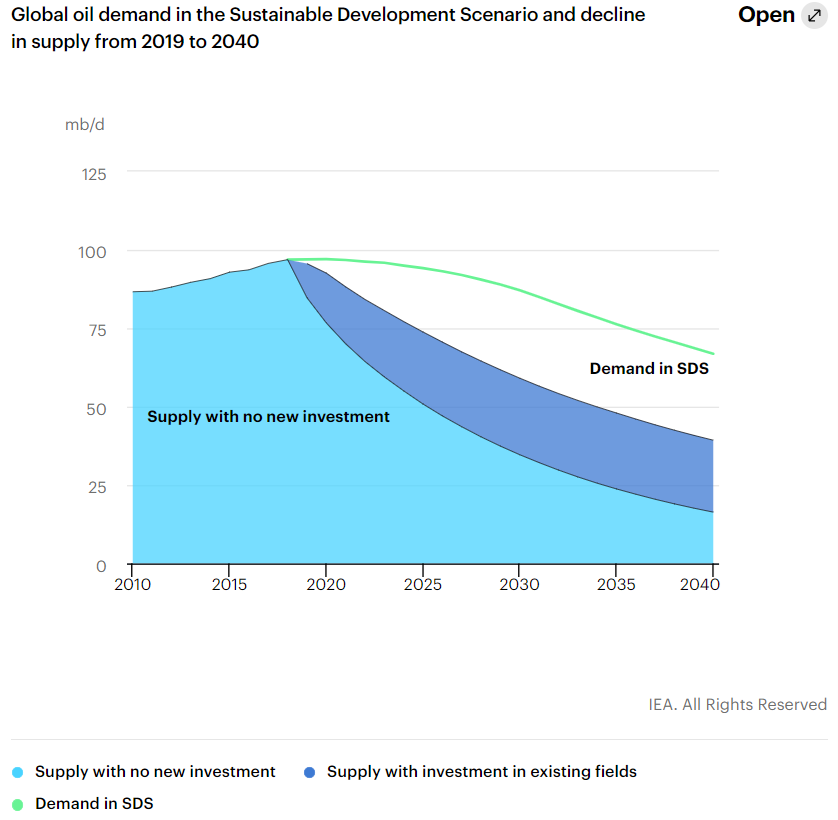
The International Energy Agency forecasts that the biggest contraction by 2030 will focus on coal:
The expected reduction in global oil demand is around 20% by 2040:
The evolution of the world oil market
The following chart shows the behavior of the oil market in recent years, as well as forecasts for the next 2 years:

Overall, supply has been tracking demand, and volumes are around 100 million barrels per day, as we have seen.
In a next article we will see how oil dependencies and the effects of the war in Ukraine.


