The recent rise in the price of oil
The relationship between oil price shocks and economic recessions
The transmission channels of oil shocks to the economy
The historical performance of the oil price
The irony of the times!
Two years ago we were startled when the price of oil on the spot market fell to $20/barrel and the futures market fell sharply and recorded a negative and absurd value.
The cause was the lack of demand from the pandemic, as well as some specific issues related to the way oil is being trading.
At the time, there were strong disagreements over OPEC+ production cuts between Saudi Arabia and Russia until an agreement was reached.
Today, oil is again in the news, but for the reverse situation.
The price of oil in the spot market is at historically very high levels, at more than $120/b, due to the Ukraine war, and it is feared that it may be the drag on a recession.
This fear results in much of the history of the recessions of the 1970s and 1980s that many consider to be attributed to the rising price of oil.
In fact, there is a stream of oil experts who consider the harbinger of a recession when oil doubles in price in less than a year.
The issue of oil (and also gas) is very important for our investments today because its price has several economic impacts and it is admitted that its price can remain high for a long time.
Ukraine war has been forcing Europe to drastically reduce its strong energy dependence on Russia in the short and medium term.
The European Union has just announced that it will not propose the elimination by the end of the year of russian oil imports by its members.
On the other hand, Europe remains willing to continue to lead the energy transition, contributing to a cleaner and more sustainable world.
As we shall see, the alternatives to imports from Russia are not easy, but we need to know them in order to better assess the situation.
This is the first article in a series on oil and investments.
We wanted to start it some time ago and the recent rise in the price of oil has made the time right.
The recent rise in the price of oil
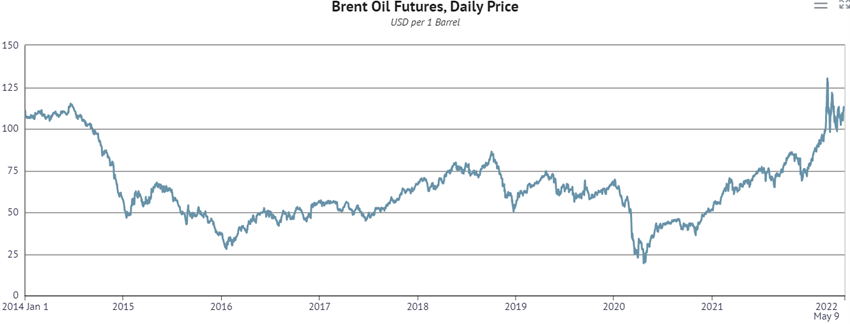
The price of oil went from $50 to $70 dollars in 2021 to about $120 in March 2022, doubling in less than 1 year.
Since 2014, the price of oil has not exceeded the $100 mark.
Source: World-crude-oil-supply-and-demand-forecast-2020-2021, Knoema
The relationship between oil price shocks and economic recessions
The price of oil has a positive correlation with GDP, as you would expect.
When economic conditions are positive there is simultaneous growth in the product and prices of all production factors, including raw materials. That is, when production grows, oil demand increases, supply does not respond immediately and the price of oil rises.
However, the situation may be different when there is an oil shock, usually caused by a cut or supply outshoot.
We are currently facing a shock in the price of oil, with the war in Ukraine destabilising supply.
Technically it is considered that there is an oil shock when the price exceeds the maximum value of the last 3 years, being this shock equal to the difference between the current value and the maximum value of the last year or the last 3 years.
The effect of an oil price shock on GDP has been the subject of study for a long time.
In 1983, a Hamilton study concluded that a sharp increase in oil prices has been a major cause of recessions, explaining 10 of the 11 recessions between 1947 and that date (except for the 1960s).
Hamilton says recessions come after 3 to 4 quarters and that the main events that cause these shocks are geopolitical factors, such as conflicts in the Middle East.
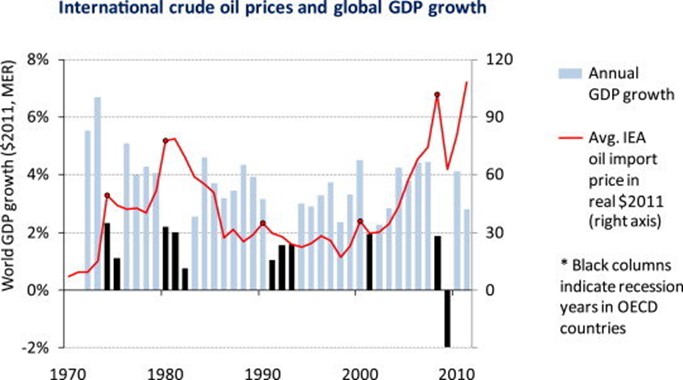
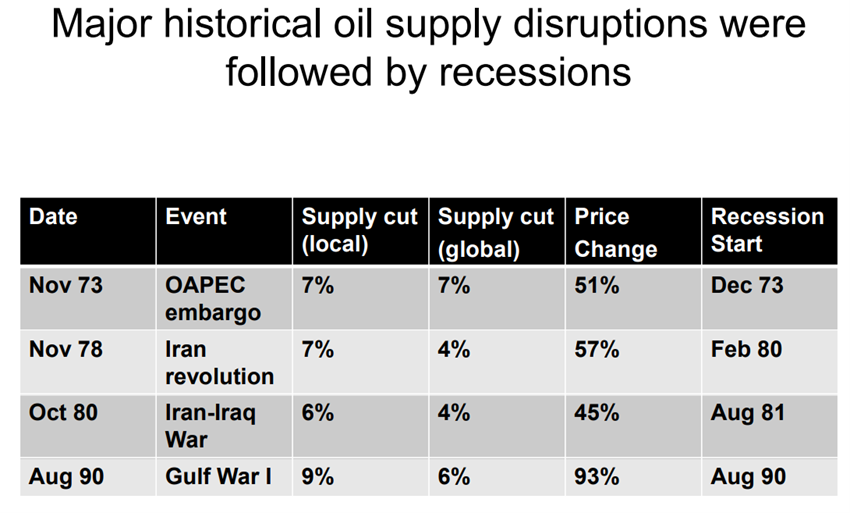
Since then there have been many studies concluding that an oil shock results in an economic slowdown and has made an important contribution to recessions in the US, rising unemployment and the cost of living.
However, more recently there have been critics who dispute this conclusion, led by Blanchard and Gali.
In 2007, these authors concluded that the risks of recession from oil shocks are low, based on the change in circumstances that have occurred in the meantime.
Let’s develop each of these points next.
The transmission channels of oil shocks to the economy
There are 6 channels of transmission from oil shock to economy.
First, the supply shock causes companies to increase production costs.
Second, there is an effect of transferring wealth from importing countries to exporters, which are less prone to consumption.
Third, the consequent increase in inflation causes the rise in the cost of living and the decrease in household consumption.
Fourth, changes in monetary conditions lead to rising interest rates.
Fifth, there is a sectoral adjustment given by the cost of changes in the structure of industry to price increases.
Sixth and last, the uncertainty caused by rising prices increases insecurity, delays investments and leads to reallocation of resources in entrepreneurs.
Critics say there are four reasons for the downside of the macroeconomic effects of oil shocks on inflation and economic activity, including prices, wages, product and employment.
First, there is more choice of alternative energies, either by increasing renewable energies (hydro, wind and solar) and by natural gas, especially shale gas in the USA.
Second, production control is lower and diffuse by a larger number of countries.
Third, the improvement in resource reallocation has created more flexibility in the labor market.
Fourth, there have been improvements in the conduct of monetary policy.
In addition to these factors, it is necessary to consider the fact that the price of oil does not enter into the calculation of core inflation, that there is greater competition in transport and that there is an increase in energy efficiency.
Regardless, the positive correlation between oil prices and consumer inflation is much lower than that of the 1970s and 1980s.
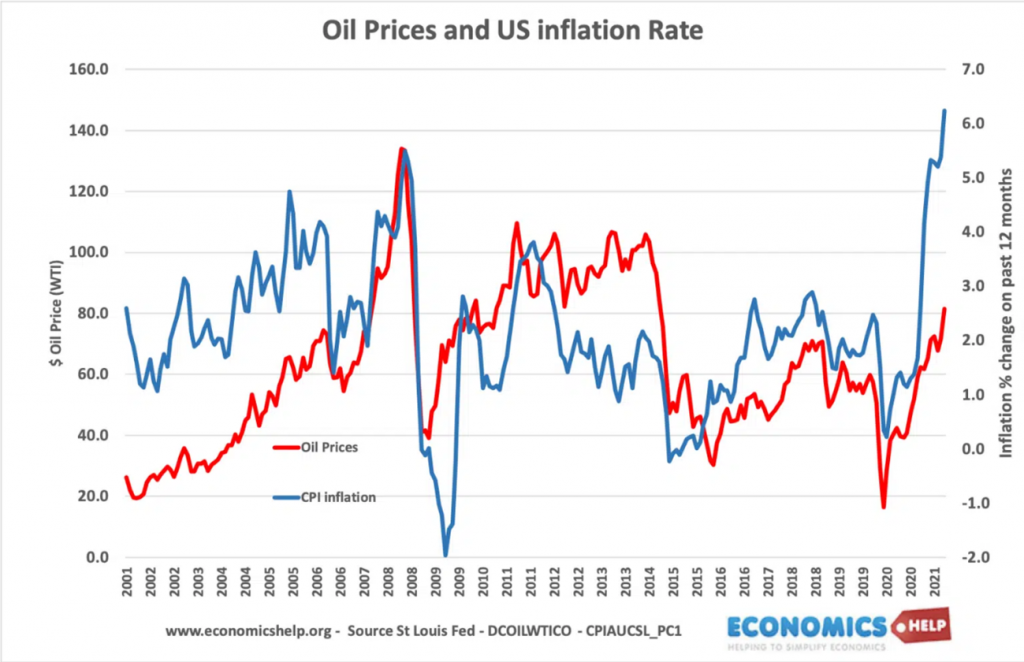
The St. Louis EDF estimates a 0.27 correlation between changes in oil prices and inflation. That is, a sustained rise of 10% in oil prices may cause the consumer price index to rise 2.7%
This correlation is naturally stronger between oil prices and producer prices.
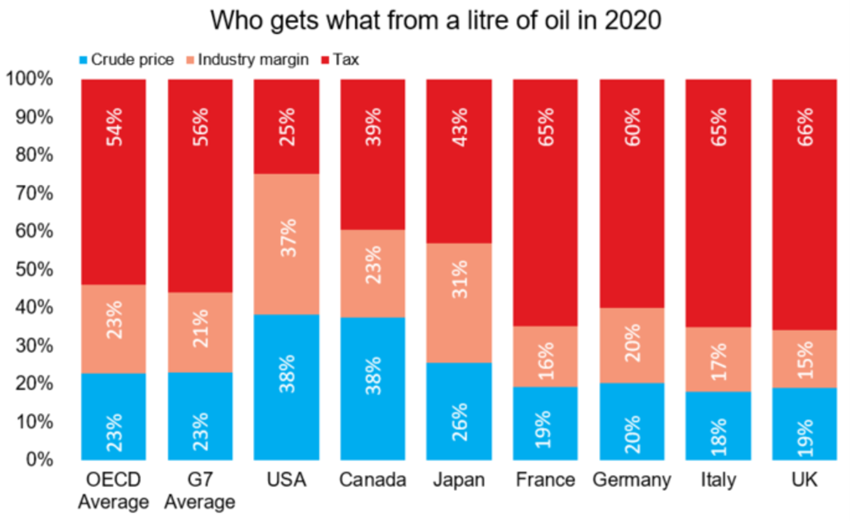
In addition, it is important to note that in many developed countries, especially in Europe, the price of fuels incorporates a tax that is about half the value.
Source: OPEC.org
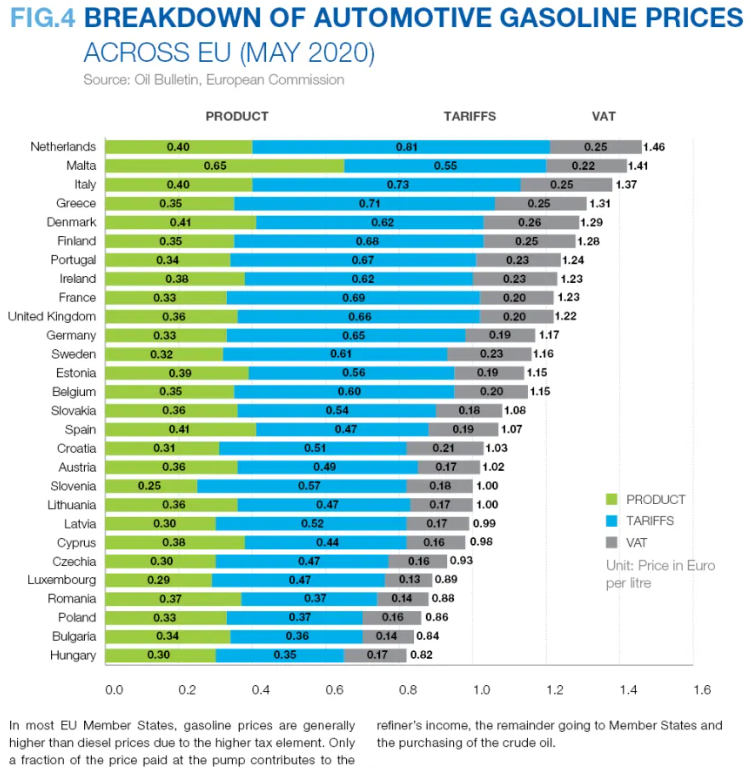
This means that governments in these countries can use fiscal policy to mitigate the effect of oil supply shocks.
The historical performance of the oil price
The following graph shows the evolution of oil prices over the past 100 years, highlighting the main shocks that occurred during this period:
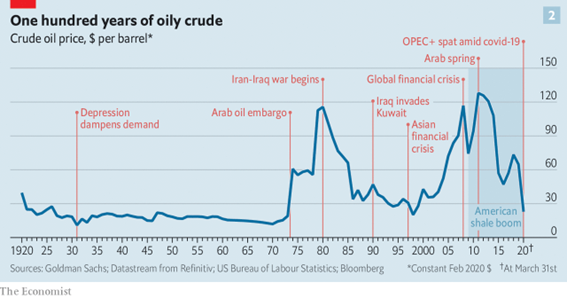
Between 1920 and until the Arab embargo of 1973, the price of oil was below $30 per barrel.
It peaked during the two oil crises in 1973 ($60/b) and 1980 ($120/b) in 2008 ($120/b) at the Time of gcf and 2011 (+$120/b) in the Arab Spring, having since declined.
In March 2020 it fell below $30/b due to the economic downturn of the pandemic and OPEC+’s decision not to cut production.
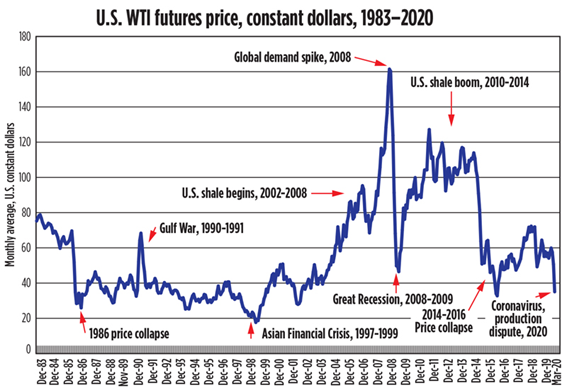
The following graph focuses on this evolution in a more recent period between 1985 and 2020:
Source: Techtelegraph.co.uk
In recent decades the price of oil has fluctuated between $30/b and $60/b with the exception of the period between 2003 and 2015 associated with increased global demand.
The explosion of shale gas in 2010 and 2014 caused a drop in prices, which was accentuated by the pandemic in 2020.
After the agreement to cut production promoted by Saudi Arabia and Russia, prices were $50/b in early 2021.
Geopolitical risks began to rise in the last quarter of this year and in the first quarter of 2022, as geopolitical risks increased and Russia decreased supplies until the invasion and war in Ukraine.


