


Reminder: What are Earnings Per Share (EPS)?
How to analyze the EPS?
The advantages of EPS
The limitations of EPS
Market EPS is important because it signals the direction of the market: “As earnings go, so goes the market”
The recent evolution of the S&P 500 EPS
EPS by sectors
Since shares are part of the capital of companies, thus entitles them to distributable economic profits, the main valuation metrics focus on the estimation of these earnings and on modelling the relationship between share prices and company earnings
The main indicators are earnings per share or “Earnings Per Share” (EPS) and the multiple of price over earnings or “Price Earnings Ratio” (PER).
Given the importance of this indicator, it is not surprising that it appears in different previous articles, with different approaches.
This indicator appears in the article in which we describe and characterize the investment in stocks.
In a subsequent article we presented the definition, evolution and importance of the EPS and also of the PER for the evaluation of actions.
In another article, we addressed EPS from the perspective of assessing the fair value of the market.
Finally, in a more recent article, we looked at the relationship between interest rates and these two indicators.
The importance of these indicators for investment in stocks makes them the subject of an analysis developed in all quarterly financial market outlooks published.
Reminder: What are Earnings per Share (EPS)?
The “Earnings-Per-Share” or EPS, is one of the two most followed, monitored and discussed market indicators, along with the PER, given the importance and relationship between both.
It can be defined as the value of the company’s earnings per share.
Its great importance is obvious, since the main value of the shareholder is the economic right that affects the profits of the companies.
The value of the EPS is determined by dividing the company’s net income by the number of shares outstanding.
Thus, EPS indicates the profitability of the company, showing how much money a company earns for each share.
It is considered that the higher the value of EPS, the more profitable the company is.
It helps to compare the performance of promising companies to help choose the most suitable investment option.
We can analyze EPS in multiple ways.
Vertically, looking at the EPS of a single stock, a homogeneous group of stocks, or a diversified but coherent set, such as a stock market index, and making comparisons between these units.
Horizontally or transversely, looking at the PHE of those actions over time to analyze the dynamics of progression.
How to analyze the EPS?
EPS can also be used to compare a company’s financial situation over the years.
Companies that have a steady increase in EPS can be a reliable investment option. On the other hand, companies with an irregular EPS are not preferred by experienced investors.
A higher EPS means more profitability, which suggests the company may increase dividend payout over time.
EPS not only helps measure a company’s current financial situation, but also helps track its past performances.
The advantages of EPS
The main advantage of EPS is that it is a unique, synthetic, simple measure, easy to perceive and calculate and aligned with shareholder value.
The limitations of EPS
Although EPS is considered a powerful financial indicator, it must be borne in mind that it has some limitations.
EPS can be manipulated by managers to project the company’s profitability in the short term. In the long run, it is not possible to circumvent and subvert reality.
In calculating EPS, cash flows are not taken into account, which means that a high EPS may not accurately signify a company’s ability to sustainably grow.
Cash flows are also an important aspect of assessing a company’s ability to repay debts.
However, because cash flows are not taken into account in calculating EPS, a high EPS can be ineffective in assessing a company’s solvency.
The main limitation of EPS, like that of PER, is that it is a static indicator. It’s a snapshot of the company at any given moment. It is not a movie, which looks at the growth of the company.
Hence, in many cases the use of EPS is accompanied by the expected growth rate of EPS for the medium term, usually a period of 5 years. Here, given the uncertainty, we enter more difficult terrain.
The frequently used EPS is what considers the results predicted by the analysts’ consensus for the end of the current year, or “Forward” EPS.
The margin of error for analysts’ forecast of results for the end of the year may be low, but 5-year forecasts are much more difficult and uncertain.
In addition, there are many other small issues in EPS, notably in terms of its definitions and formulas. The various definitions of EPS introduce complexity into the analysis and evaluation of value. We have adjusted EPS, diluted EPS, etc.
Market EPS is important because it signals the direction of the market: “As earnings go, so goes the market”
In terms of the main market indices, made up of a large number of companies and highly diversified, the EPS determines the evolution of the market value.
In the following chart we can see the evolution of the EPS and the price of the main stock index, the S&P 500, between 1945 and 2020:
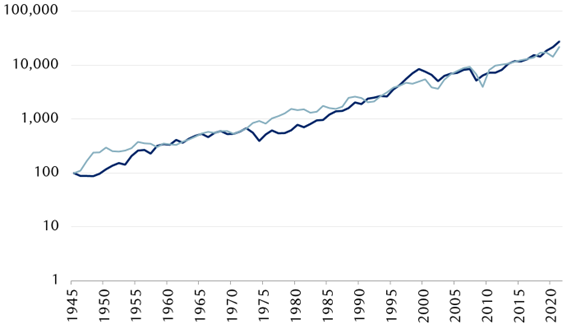
The alignment is not perfect, there are deviations in the short and medium term, but they are corrected in the long term (it is called the reversal to the mean, as in the PER).
Stock prices rose with the companies’ earnings. Since 1945, both stocks and profits have risen 7.3% annually.
In the same period, nominal GDP increased by 6.3% per year.
As a general rule, the annual growth rate for EPS is between 5% and 8%.
The recent evolution of the S&P 500 EPS
Over the past 20 years, the EPS and the value of the S&P 500 index have evolved as follows:
Although the annual growth rate of the S&P 500 EPS is between 5% and 8%, its evolution is very variable:
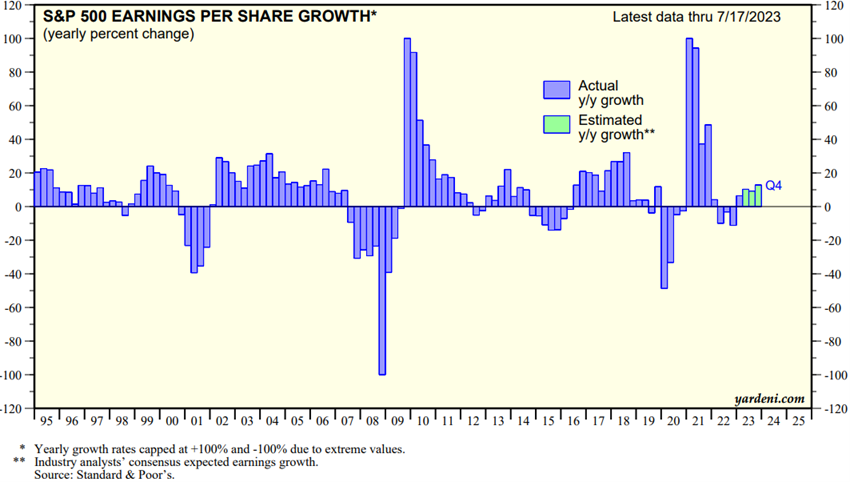
The EPS falls sharply in periods of financial crises, above 40%, and rebounds by more than 80% in recovery times.
Even in the most stable years, annual EPS variations in the S&P 500 can range from -10% to +20%.
This situation stems from the fact that the market is not fixed on the earnings of the companies of a given year, but rather on the prospective results in the medium and long term.
The following link contains the S&P 500 EPS values for the past and estimated years for the coming years, totals and by sectors, in Excel file:
https://www.spglobal.com/spdji/en/documents/additional-material/sp-500-eps-est.xlsx
The evolution and estimates of the EPS of the market by the analysts are made “bottom-up” of the constituent companies of the indices for the index
Analysts construct their estimates of index evolution for the S&P 500 from the weighted sum of the individual EPS estimates for each of the companies that make up the index.
It is obvious that the companies that have the most impact are those with the largest market capitalization or those with the highest EPS in absolute value (as is the case of oil companies, for example), since it is a weighted indicator.
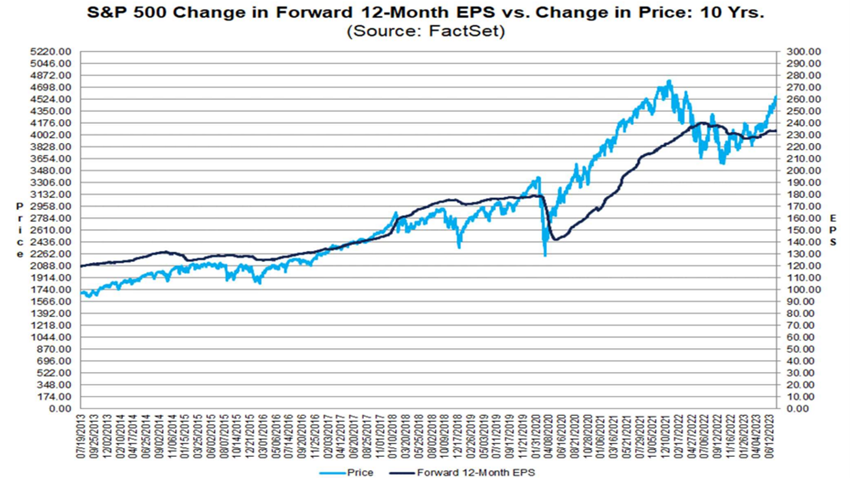
The following chart shows the evolution of the S&P 500 EPS since 2007 and its forecast until the end of 2024:
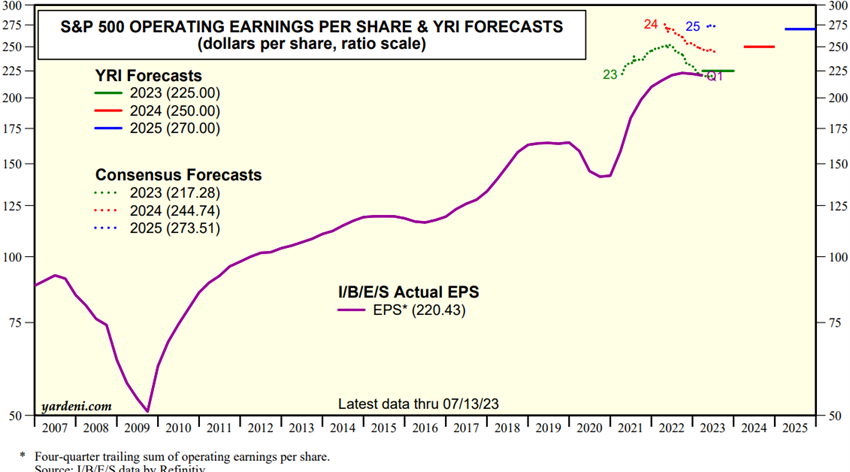
The dashed lines present the evolution of EPS analysts’ forecasts for the years 2022, 2023 and 2024, since the beginning of their formation. The direction of this movement is important to signal the adjustment of the market.
In 2022, forecasts were being revised upwards, while those for 2023 were initially rising, but have been falling in recent months. Forecasts for 2024 have also been adjusted downwards.
EPS by sectors
The evolution of the S&P 500 EPS by sectors since 2009 was as follows:
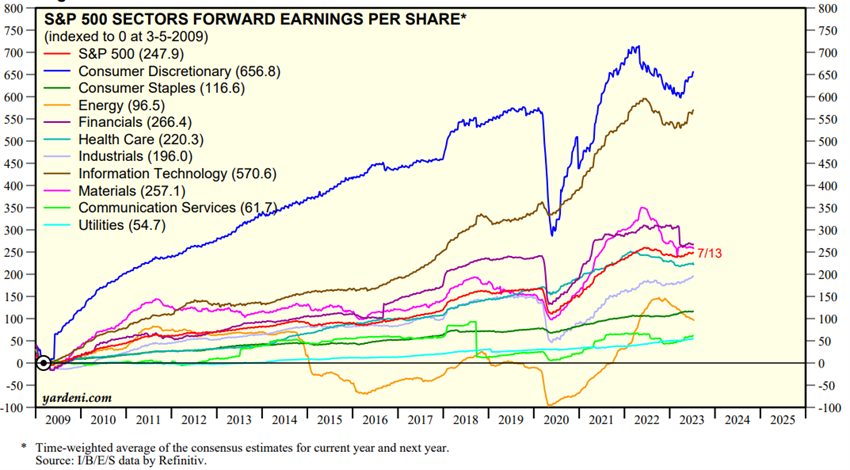
This development has had a very positive contribution from the consumer discretionary and technology sectors, while energy and utilities have fallen far short of the average.
We can see that there is a global background trend that cuts across all sectors, but there is also a differentiated sectoral movement.
This sectoral dynamic has an impact on the measurement of the evolution of the EPS of the index. For example, just look at and remember what happened to technology in this period, or to energy between 2020 and 2022.


