There are 4 major classes of financial assets relevant to investment: cash, stocks, bonds and alternatives
The main stock markets and their indexes
Stocks are the asset that provides greater capital growth in the medium and long term
What explains the evolution of stocks prices?
There are 4 major classes of financial assets relevant to investment: cash, stocks, bonds and alternatives
The three most important investment classes are the stocks, bonds and cash. Alternatives are the fourth class.
Stocks have 2 main subclasses arising from the degree of economic or financial market development (developed and emerging) plus 3 arising from the companies’ size (large, medium and small).
Bonds have 3 main subclasses arising from the combination of geography with degree of economic development (domestic, international and emerging), plus 2 of nature or type of the debtor (government or company) and another 2 from the level or the quality of the credit risk (investment or speculative).
Cash includes current and time deposits, savings accounts and currency.
Alternatives include the subclasses of real estate, commodities, gold, and more recently, hedge funds and private equity.
The real rate of return (deduced from inflation) of investment in shares of large companies and Treasury 10-year bonds in the US, for the period between 1802 and 2014, was as follows:
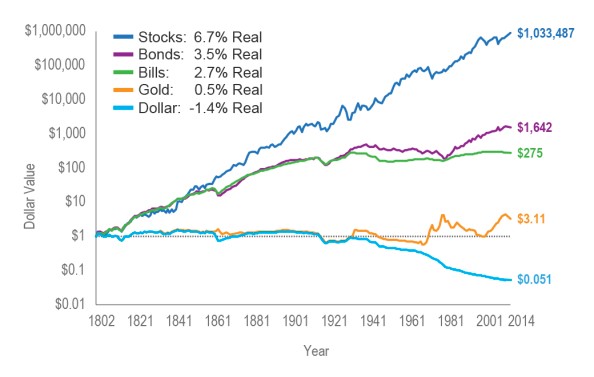
Source: The Future for Investors, Jeremy Siegel (2005) with updates to 2014
Stocks (or shares) are parts of the capital of companies and entitle the owner the right to a share of their profits
Stocks (or shares) are securities representing the capital of a company. Being a shareholder is owning and participating in the present and future of companies. There are shares of private companies, owned and managed by the founders themselves, and of publicly listed companies, freely traded on a stock exchange (about which we will dwell).
Companies generate profits that can be distributed, in the form of dividends paid to shareholders, or reinvested in the company, to provide greater results in the following years and, to that extent, greater dividends in the future.
The profitability and returns obtained by the investor in stocks arise from the dividends received and the change in the price of the stocks during the holding period (capital gains or losses).
Stocks can be classified into several types, depending on:
- The capitalization or size of its market value: large, small and medium-sized caps. Generally speaking, the shares of large companies represent 65% to 76% of the total market, and small and medium-sized companies about 10% to 15%, each. Stocks of the biggest companies tend to be more stable and those of small businesses may have a greater growth potential;
- Sectors of activity: your main business purpose, for example, consumer goods, technology, utilities, energy, financial services, pharmaceuticals, etc. Companies of certain sectors react the same way to the same economic conditions, so to achieve greater diversification is important to invest in various sectors;
- Financial dominant feature and how fundamentally they generate money for investors: value companies (more stable and via dividends) or growth companies (expanding and via capital gains).
The main stock markets and their indexes
The stock market term usually encompasses two concepts: the place where the listed stocks are effectively bought and sold, and the indexes that measure the prices at which these stocks are traded.
At the end of the 2017, the world stock market composition was as follows:
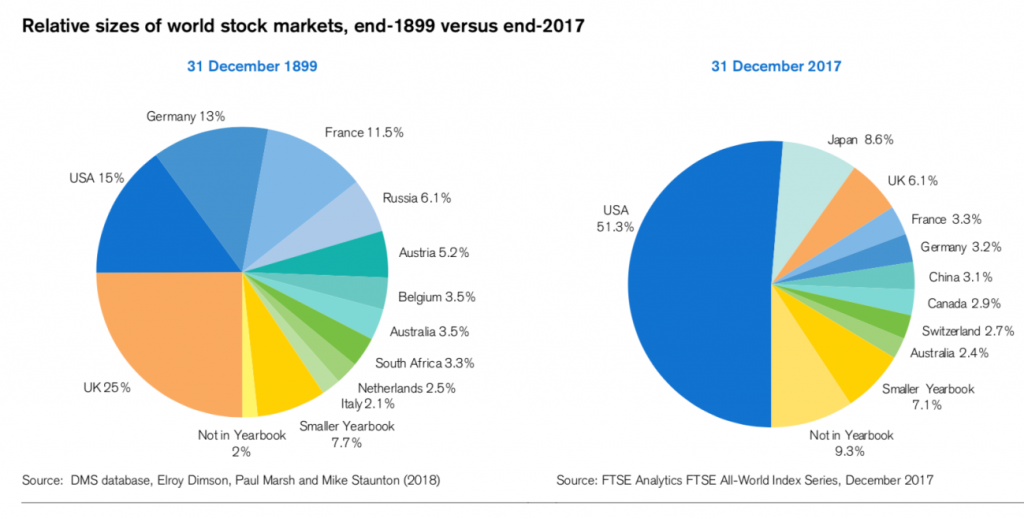
The US has a dominant weight of 51.3%, followed by Japan with 8.6%, the UK with 6.1%, some Eurozone countries that collectively represent between 12% and 15%, Canada and Australia with about 2.5% each and several developing economies such as China, India, Brazil, etc., that in aggregate represent the emerging markets..
There is a huge change to the reality world stock market of 1899, at the time still very determined by the weight of the industrial revolution and without the destructive impact of the two wars in Europe.
There are a multitude of market indices, but the main indexes and those in which stock market investors are mainly focused, are a few:
The MSCI World All Country World Index (ACWI)
The MSCI ACWI is an index that intends to be the reference of the entire global stock market. It contains the main stocks of 23 developed countries and 24 emerging countries.
It is a global stock market index that represents the large stocks of companies from 23 developed countries. It covers about 85% of the volume traded in each country and does not contain stocks from emerging markets.
The Dow Jones contains only 30 stocks of large US companies belonging to a variety of industries. As it is a very unique index it does not necessarily represent the rest of the market.
The S&P 500 contains the 500 largest companies in the US and also encompasses several sectors. These stocks represent 75% of the total market capitalization, so it is a good indicator of the market as a whole.
This index aims to be the benchmark of the entire US market, measuring the performance of 3.000 largest traded companies and represents about 98% of the total market.
The Nasdaq Composite Index contains all the stocks transacted on the Nasdaq stock market. There are about 4.000 shares with a strong preponderance of stocks in the technology and biotechnology sectors. The Nasdaq 100 is another index of this market comprising the 100 largest companies traded.
The Nikkei is the main index of the Japanese market representative of its 225 largest companies in various sectors.
Footsie is the main index of the British market representative of its largest 100 companies from various sectors.
The Eurostoxx 50 is the main stock market index of the Eurozone representative of its largest 50 companies in various sectors. There are two more important and wider indices for the Euro area, the Eurostoxx 300 and the Eurostoxx 600, comprising respectively 300 and 600 larger companies.
This index comprises more than 1.000 stocks of the largest companies in biggest 26 emerging markets, including countries such as China, India, Brazil, South Africa, South Korea, Indonesia, etc.
Finally, there are also indexes that only encompass stocks of certain sectors, such as energy, healthcare or technology.
In another article we will discuss each of these indexes in more detail.
Stocks are the financial asset that provides greater capital growth in the medium and long term
Stocks provide two major benefits to investors in a diversified investment portfolio: a source of income in the form of dividends and capital gains arising from their price change.
As we have seen earlier, stocks have a performance far superior to any other asset class, and despite their increased volatility in the short term, they show some growth constancy in the medium and long terms. In fact, the Nobel Prize laureate Jeremy Siegel found that stocks have a regular appreciation for long periods of 6.5% in real terms.
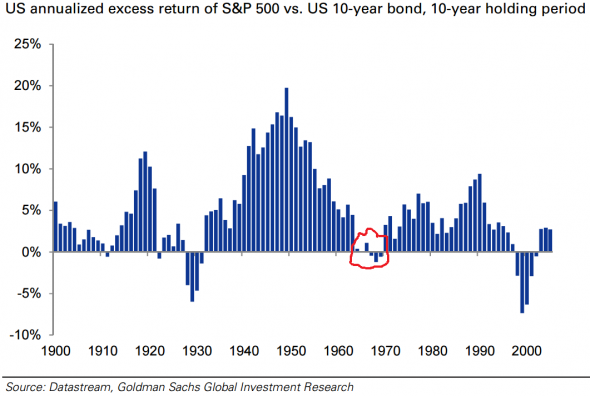
An even better way to see the comparative performances of assets in terms of returns is given by the difference between them. From 1900 to 2014, the returns for 10-year periods of stocks have always beaten the 10-year Treasury bond and in some periods by many percentage points, except in the eras of the Great Depression of the 30s, the technological bubble and great financial crisis of the new millennium.
What explains the evolution of stocks prices?
We have seen that the stocks are parts of the companies capital, which give the right to participate in their results and that these can be distributed to holders in the form of dividends or retained and reinvested by the companies to generate more results in the future.
The price of a stock or a basket of stocks is determined by a multiplicity of factors, from the interns and that influence the company’s own activity, and other external ones that result from the environment of the financial markets.
To simplify we can say that there are two essential factors: a rational, quantifiable, given by the evolution of the results of companies, and another subjective or of market sentiment, which may be subject to the influence of several external factors.
In this sense, the profitability of stock or a basket of stocks, including an index, can be decomposed as follows:
Stock price change (Total Return) = Earnings change (Earnings per Share or EPS growth) + PER change + Dividends reinvestment
The following graph shows the compound annual total return for trailing 10-year periods of the S&P 500 between 1936 and 2017 and what the contribution of each one of its main components:
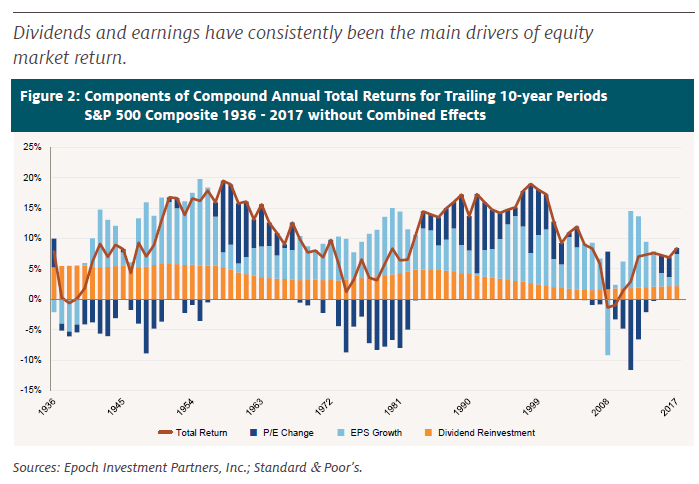
We see that the growth of the earnings per share has been the main determinant of profitability, reinvested dividends have been stable and the source of higher volatility results from the PER evolution.


