


Reminder: What is PER?
The PER of the market
The relationship between market PER and future stock market yields over the medium and long term
The advantages of PER
The limitations of PER
Since shares are part of the capital of companies, thus entitles them to distributable economic profits, the main valuation metrics focus on the estimation of these earnings and on modelling the relationship between share prices and company earnings
The main valuation indicators are earnings per share (EPS) and the multiple of price over earnings or “Price Earnings Ratio” (PER).
Given the importance of this last indicator, it is not surprising that it appears in different previous articles, with different approaches.
This indicator appears in the article in which we describe and characterize the investment in stocks.
In a subsequent article we presented the definition, evolution and importance of the EPS and also of the PER for the evaluation of stocks ..
In another article, we addressed the PER from the perspective of assessing the fair value of the market.
Finally, in a more recent article, we looked at the relationship between interest rates and these two indicators.
The importance of these two indicators for equity investment means that they are the subject of an analysis developed in all quarterly perspectives of the financial markets published.
Reminder: What is PER?
The PER is one of the most used measures of evaluation of stocks.
The PER ratio is obtained by the quotient between the price and the earnings per share, it measures the number of years of results that the investor needs to recover the invested capital.
It is the most widely used measure of valuation of stock markets because it is simple to understand and easy to calculate.
Allows comparisons between actions and the same actions in different periods of time.
The PER can be used to evaluate individual stocks, baskets or groups of stocks, or extended sets of stocks, such as major market indices.
We often hear about the PER multiple the market is trading at (usually the main U.S. S&P 500 index, but it can be applicable to any other market index).
In this regard it is worth remembering the wise words of Warren Buffett: “It is much better to buy an excellent company at a fair price than an average company at an excellent price.”
The PER of the market
The market PER is obtained by dividing the stock market index by the results of the companies in that index.
By definition, this means that the value of the market side index results from multiplying the corresponding value of the PER by the earnings per share of the stocks that compose it (EPS of this index).
The most widely used market PER is the S&P 500, as it is the main index of the U.S. stock market, which has a weight of more than 55% in the global stock market.
Thus, this index constitutes the benchmark of all world stock indices, and any direction or change in the value of this index is important and reflected in all other stock market indices.
It can be said that the PER represents the number of years of companies’ results that is required to pay for the investment in the stock market. That is, a PER of 15 means that it takes 15 years to recover the investment in the market.
So everything else constant, the higher the PER (or longer the return), the more expensive the market will be, and vice versa, the lower the PER (or faster the return), the cheaper the market.
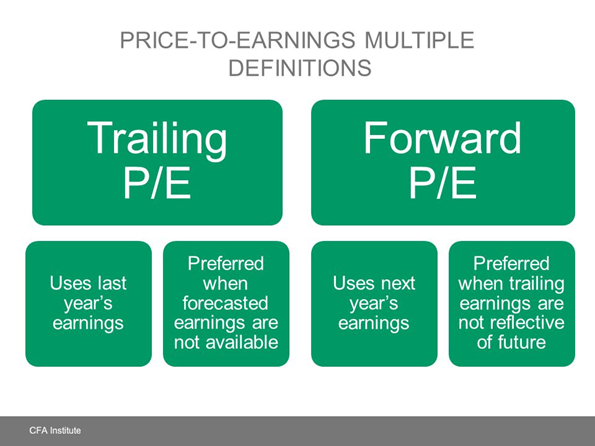
Which PER is used: “Trailing” or “Forward”?
The “Forward” PER uses the projection of future results to calculate the price/earnings ratio.
The “Trailing” PER, or retrospective (past, or observed) PER, which is the standard and most widely used form of the price-to-result ratio, is calculated using the latest results (from the most recent past).
Retrospective PER is calculated by dividing the current market value, or share price, by earnings per share over the previous 12 months.
Forward-looking PER uses the earnings per share estimate for the next 12 months as a divider of the current market value.
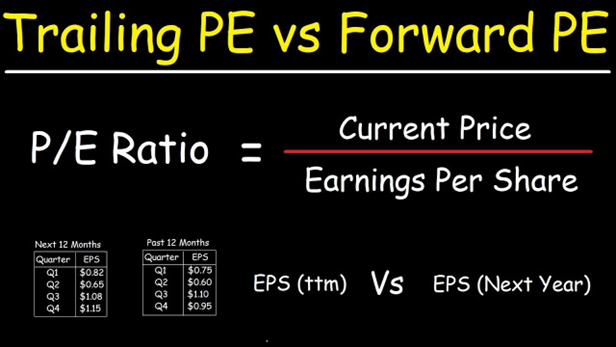
The main difference between the two ratios is that the observed PER (“Trailing”) is based on actual performance statistics, while the forward PER is based on estimates of future performance.
Generally speaking, when analysts refer to the PER, they are referring to the observed PER (“Trailing”).
This measure is considered the more reliable of the two metrics, since it is calculated based on actual performance rather than expected future performance.
The observed PER also helps analysts compare periods in different years to get a more accurate and up-to-date measure of the relative value at each time.
However, it may prove to be a limited or faulty estimate, since a company’s performance factors, costs, and profits change over time; That is, a company’s past performance does not signal future behavior.
The fact that the value of earnings per share remains constant while stock prices fluctuate is also a problem, especially for the observed PER (“Trailing”).
Forward PER is favored by analysts who believe that investment decisions are better made based on estimates of a company’s future than past performance.
The estimates used for the forward PER are obtained from a company’s or analysts’ earnings release.
Because forward PER depends on estimated future earnings, it is subject to miscalculations and/or biases by analysts, or companies’ estimates.
It is useful for investors to consider both calculations of the PER ratio, and to compare the observations with the estimates made previously.
The relationship between market PER and future stock market yields over the medium and long term
The PER is an important valuation indicator because there is a negative or inverse relationship between the value of the PER and the return on investment in the stock market.
The following graph shows the inverse relationship between Schiller’s PER and market profitability over the next 20 years, presented by Schiller himself in his book Irrational Exuberance:
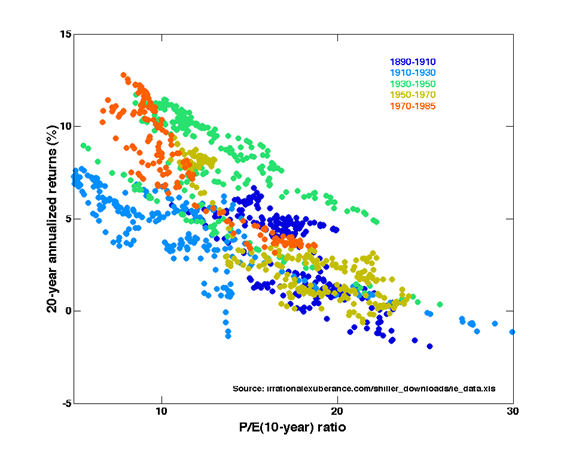
Schiller’s PER is obtained by dividing the current market value by the average of inflation-adjusted results over the past 10 years.
This 10-year memory is used to smooth periods and cycles, and avoid fluctuations and volatility peaks, in order to strengthen PER as a valuation metric.
The higher the PER, the lower the average annual rate of return of the market over the next 10 years, and vice versa.
Generally speaking, a 20x PER corresponds to an average annual rate of return of almost 5%, while a 10x PER corresponds to an average annual rate of 10% over the subsequent 10 years.
Note that these are average values, and that the dispersion of observations is large.
The advantages of PER
The PER is a single, simple and easy to calculate measure.
It can be calculated at any time, by anyone.
Just have two values – the value of the index and the value of the respective EPS – and do the calculation.
The value of the S&P 500 index is obtained on any news site, and the EPS of the S&P 500 is also frequently reported on some of these sites.
If we want to have a more up-to-date version of the EPS we can use the information provided, among others, by Yardeni Research or Factset Research:
https://www.yardeni.com/pub/yriearningsforecast.pdf
The limitations of PER
PER is a static, instantaneous indicator.
Simply divides the value by current results (present or recent past) It is not a forward-looking measure.
To that extent, it distances itself from shareholder value.
The shareholder is entitled to the future economic results of the companies.
Therefore, the most used valuation models are that project the future cash flows of companies and discount these values obtained for the present moment at the rate of return required by investors.
It is this forward-looking analysis and evaluation that is not captured by the PER.
The way to compensate or adjust for this limitation will be to consider evaluating the PER in a dynamic way, projecting it into the more distant future.
That is why many professionals analyze the PER alongside the growth rate of the results or EPS for the next 3 or even 5 years (with all the uncertainty contained in this analysis).
As we will see later, the two ratios most used as an alternative or in addition to the PER, the CAPE and the PEG, focus on and seek precisely to correct this issue.
At a time of changing economic and financial cycle, the PER usually has large variations, moving far away from its average or reference values.
For example, the PER falls below 10x in an economic recession or a sudden deep crisis, and exceeds 25x in a boom or phase of market euphoria.
In these periods, the PER is obviously very volatile, due to the effect of adjusting the expectations and forecasts of analysts and investors to the new economic and market reality.


