The weight of Mega caps in indices
Distortions of market/index performance and depth (“breath”)
Distortions in the valuation of market multiples
This is the second article dedicated to investing in the 5 to 8 mega caps, or in the FAAMG (and its variants), considering their weight in the main indices of the US market, namely the S&P 500 and the Nasdaq.
The reality is that the big five responsible for the vast majority of US stock market gains in 2023 are Apple (+36% this year), Microsoft (+37%), Alphabet (+39%), Amazon (+44%) and Nvidia, which is up 159% in relation to AI.
Without these stocks, the main U.S. stock market index, the S&P 500, including dividend payments, would rise just 1.5% this year
If we exclude contributions from the other two largest tech companies – Meta (+120%) and Tesla (+66%) – the S&P 500 would be slightly negative for the year.
The impact and contribution of these stocks on the global market has been so strong that they are increasingly referred to as the “Magnificent Seven” (excluding Netflix).
This is the second article about the 8 mega caps or the FAANGM and their influence and importance for the stock market.
In the previous article we made a brief general presentation, highlighting the history of its growth and appreciation.
In this article we will look in more detail at the weight, contribution and importance in market indices, as well as the distortions caused in market analysis if we do not take into account the effects of these heavyweights.
The weight of Mega caps in indices
As we have seen in previous articles, the vast majority of the main indices that make up these companies are weighted by capitalization, including the US S&P 500 and the Nasdaq, and consequently the global MSCI World or ACWI.
The weight of the current 8 largest capitalizations in the S&P 500 is at 27.2%, all-time highs:
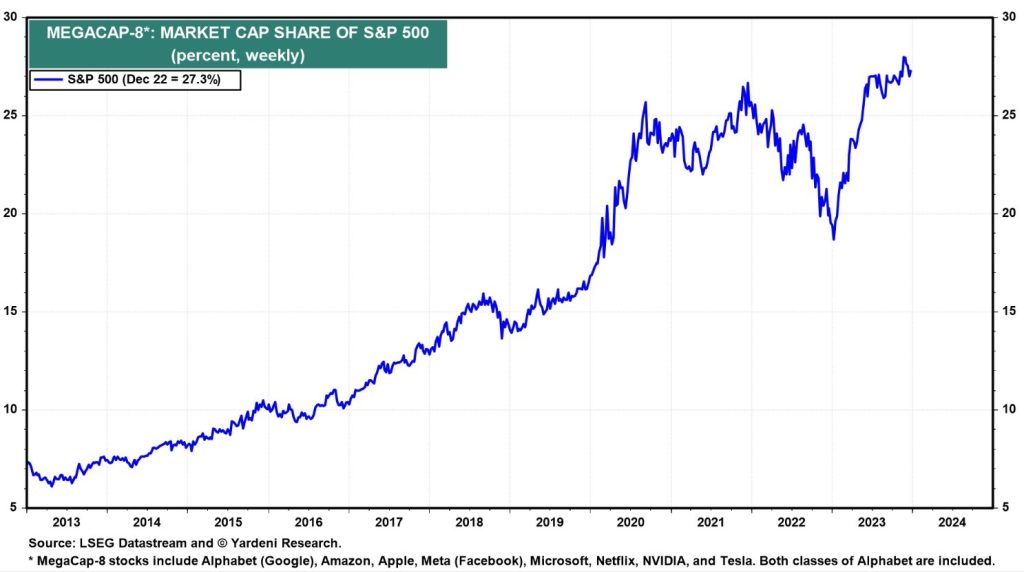
The weights of the 8 companies are as follows: Apple (7.2%), Microsoft (6.9%), Amazon (3.3%), Nvidia (2.9%), Alphabet (4.3%, in both series), Facebook (1.9%). Tesla (1.7%) and Netflix 0.5%.
The concentration in the S&P 500 of the 5 largest companies is also at all-time highs, reaching almost 25%:
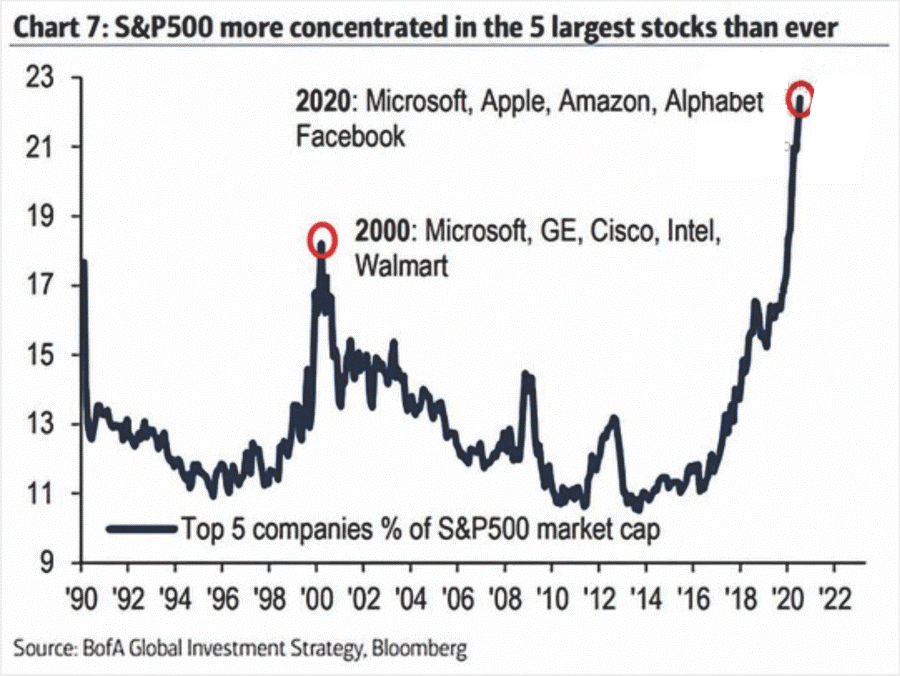
At the same time, as a cause and consequence, these stocks have performed exceptionally well over the past 10 years, vastly outperforming the market as a whole.
The combined effect of high market concentration and the extraordinary performance of these mega stocks has consequences and implications that are not always realized, in terms of the direction of the markets and the valuation of the markets, which can distort the reality of the global market significantly.
Distortions of market/index performance and breadth
The first possible distortion of reality is that of the performance of the global market, as the strong contributions and weights of these stocks in the indices can distort the situation.
This question is very relevant because we often talk about the performance of the market in general, in the day, in the week, in the month, in the year, in the last 3, 5 or 10 years, without considering the effect, or the contribution, of these mega caps.
It is often the case that the positive performance of the market is mainly due to these companies, and the average of the remaining hundreds of stocks are underperforming.
This situation can induce many errors or biases in the analysis of the behavior and sentiment of the market in general.
This means that we may think that everything is fine when in fact only a small sample of the market is fine and the rest is bad.
Therefore, it is necessary to analyze the performance of the market with and without these mega stocks.
The following chart shows the evolution of the S&P 500, the 8 mega caps and the S&P 500 excluding the 8 mega caps since 2013:
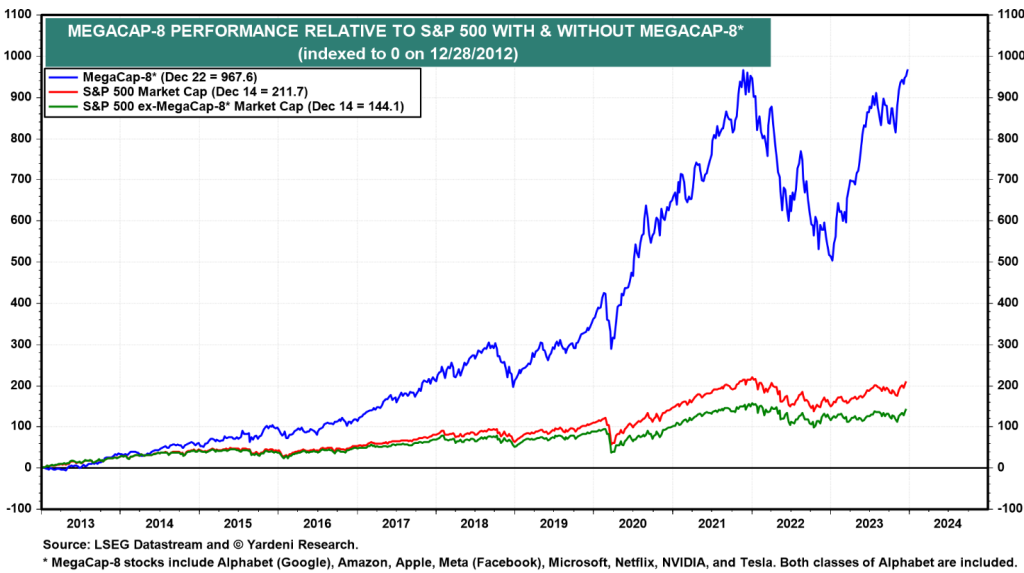
Since the end of 2012, the S&P 500 index has gained 189.4%, but excluding the 8 mega caps it has only appreciated 127.4%, as they have gained an extraordinary 872.9%.
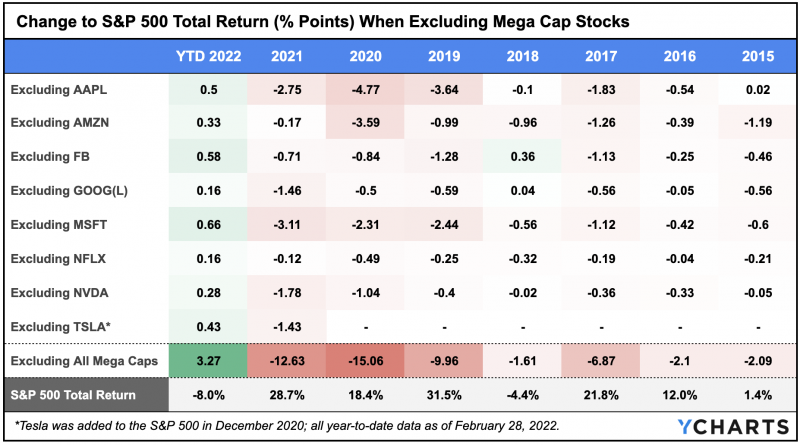
The following table shows the individual impact of mega stocks on the S&P 500 index between 2015 and February 2022:
In 2023, the performance was as follows:
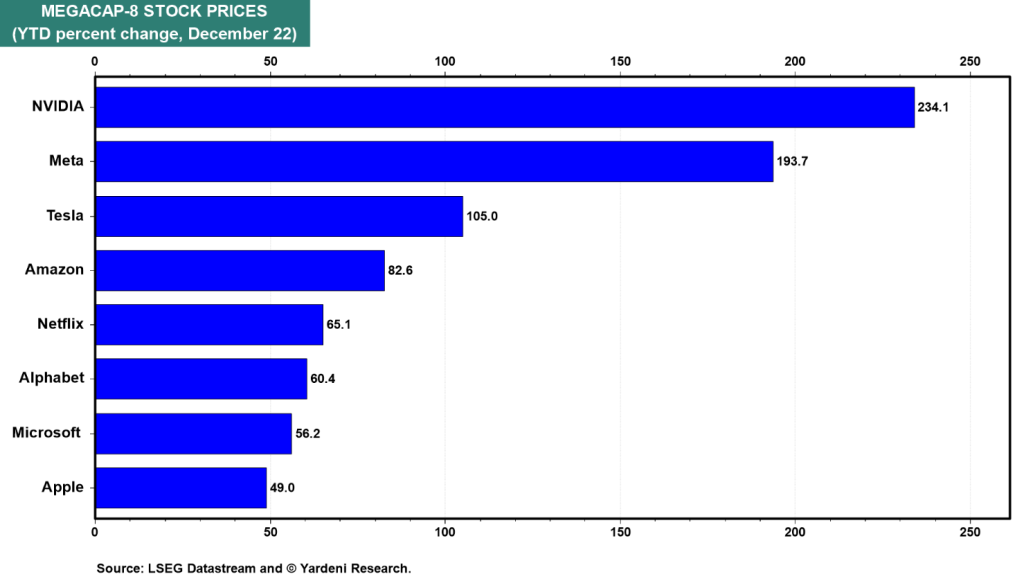
This impact has been very strong and growing over the years, especially after the pandemic.
In 2021, the S&P 500 had a return of 28.7%, but 12.63% was due to the 8 mega caps alone (40%).
In 2020, the impact had been even greater with the S&P 500 returning 18.4%, resulting in almost all of the 15.06% of mega caps.
We see that in the early years the impact was much smaller.
As we have seen, the most correct way to analyze this bias is to look at performance with and without these actions.
In addition, more generally, and beyond these actions, there are other ways of assessing the concentration or dispersion of market movements, the so-called breadth, within the scope of technical analysis.
The simplest measure of market width is to measure the amount of stocks whose prices have gone up versus the one in which they have fallen.
Another way is to analyze the quantities of index stocks whose prices are above or below the moving averages of prices over the last 50 and 200 days, measures widely used in technical analysis.
Comparing the performance of capitalization-weighted indices with their peers of equal weighting is another way to gauge the width of the market.
Yardeni research gives us several up-to-date indicators on the breadth of the S&P 500:
Distortions in the valuation of market multiples
As we know and have seen in previous articles, much of the analysis and discussion regarding stock market valuations focuses on market multiples, usually the PER.
It is a simple, available measure that is easy to understand and use.
Analysts and investors study and know the medium and long-term averages of the PER for the main indices, the averages in the different phases of the economic cycle, their lows and highs, etc.
The problem is that many times the assessment of the market made by analysts and commentators through PER does not consider the possible distortion associated with the concentration of the index.
The following chart shows the evolution of the PER multiples of the S&P 500, the 8 mega caps, and the S&P 500 excluding the mega caps since 2013:
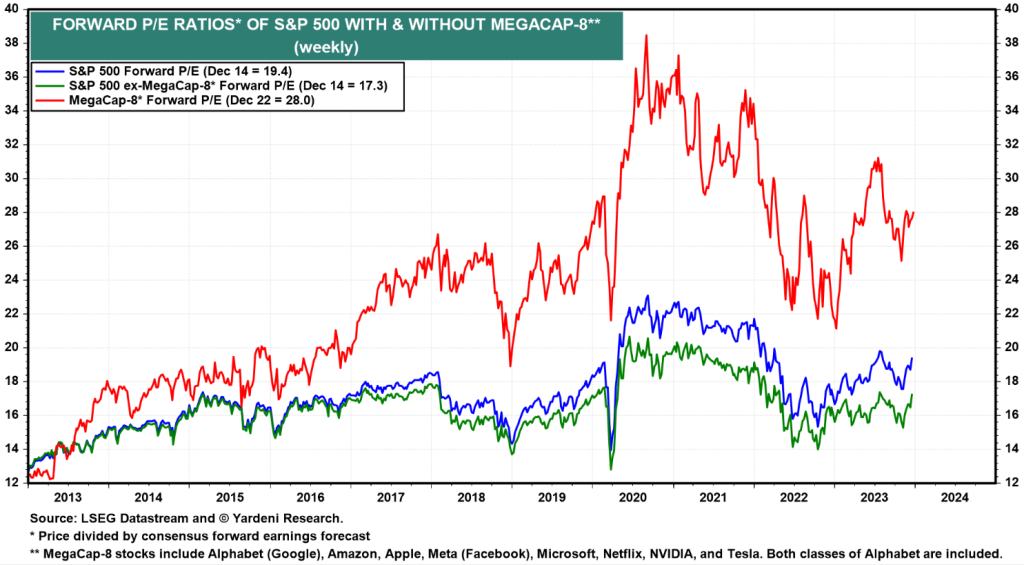
Currently, the PER of the S&P 500 is at 19.4x, but that of the S&P 500 without the 8 mega caps is at 17.3x, and that of those companies is at 28x.
This divergence of the S&P 500 PER with and without the 8 mega caps is close to the highest levels in recent years.
Given that the PER of mega caps is high but well below the levels recorded between 2020 and 2021, the PER of the S&P 500 without mega caps is below the last 5 years and close to the 10-year average.


