Anchoring holds us to the past and blinds us in the present and for the future
Anchoring investments leads us to keep the losers and not to be insightful to identify winners
Anchoring in the evaluation of markets, in the technical analysis
Anchoring in the perception of the future or in the managing returns expectations
Anchoring holds us to the past and blinds us in the present and for the future
Anchoring or focalism is related to familiar experiences, even when appropriate.
Anchoring is a behavioural bias in which the use of a reference, mark or psychological indicator has a disproportionately high weight in the decision-making process of a market participant.
Without perceiving we become hostages or clinging to an idea or to a value of the past does not leave our heads, that take undue proportions despite the very low or null probability of realising, with the change of circumstances or times.
Anchoring investments leads us to keep the losers and not to be insightful to identify winners
Anchoring is the use of irrelevant information, such as the purchase price of a security, as a reference for evaluating or estimating an unknown value of a financial instrument.
In the context of investments, a consequence of anchoring is that market participants with this bias tend to keep investments that have lost value because they have anchored their fair value estimate to the original purchase price and not to their fundamentals.
As a result, market participants take greater risk by maintaining the investment in the hope that the investment will return to its purchase price.
Often, market participants are aware that their anchor is imperfect and try to adjust reflect subsequent information and analysis.
However, these adjustments often produce results that reflect the bias of the original anchors.
Historical values, such as acquisition prices or recorded maximum values, are common anchors. This is true for the values required to achieve a given goal, such as achieving a target return or generating a certain amount of net profit. These values are not related to market prices and cause market participants to reject rational decisions.
Anchoring can be present in relative metrics, such as evaluation multiples. Investors who use as a rule a valuation multiple to assess bond prices show anchoring when they ignore evidence that one security has a higher potential for price increase than another.
Some examples of anchoring stock prices: telecommunications companies Nokia and BlackBerry, as well as Apple and Nike
We will remember below two examples of stocks that are from the same sector, that of telecommunications equipment, which are the stocks of Nokia and That of BlackBerry.
In their golden period these companies were considered the largest and most innovative mobile phone manufacturers in the world (in addition to the first being considered a powerhouse in the telecommunications operation) and many investors bet on them.
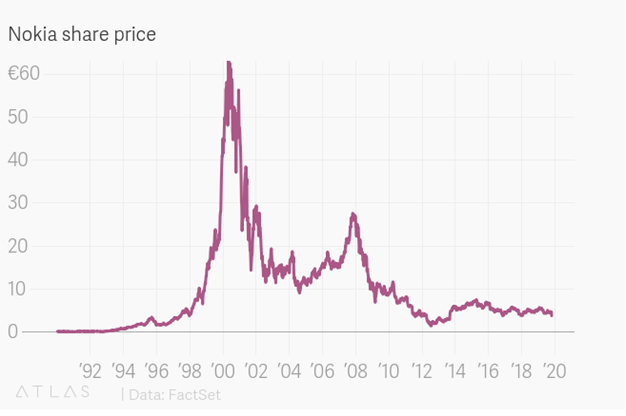
Nokia stock, of the Finnish company, rose sharply in the late 1990s, reaching a unit price of more than €60 at the peak of the dot.com bubble, and then falling to levels around €10 per share and now worth very little.
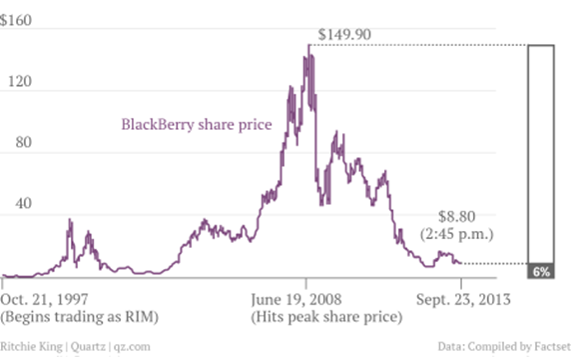
Share prices in Canadian company BlackBerry were also impacted by the dot.com bubble, but rose sharply from 2004 to 2008, when it reached the all-time high of $149.90. Since then it fell sharply and in September 2013 this stock was worth no more than $8.80, i.e. 6% of that maximum.
One and the other were affected by the appearance and growth of Apple’s Iphone, Samsung’s Galaxy, and many other phones (e.g. Huawei), which replaced and virtually eradicated them from the market.
Many people invested in these companies in their golden years, buying the stocks for many dozens or in the case of BlackBerry for more than a hundred dollars. Given the record of past success, many did not believe that their price could fall so much and were clinging to historical prices and did not sell or if they did it was too late and with huge losses.
Before we move on to the next section it is worth seeing the opposite influence, which inhibits us from perceiving winners, which we will illustrate with two paradigmatic cases, that of Apple and Nike, purposely from 2 well-known companies from different sectors and stories.
Starting with Apple, these days the most valuable company in the world, surpassing more the 2 trillion dollars mark, many investors own it and long ago, but there will be many more who have owned and sold it for some time:
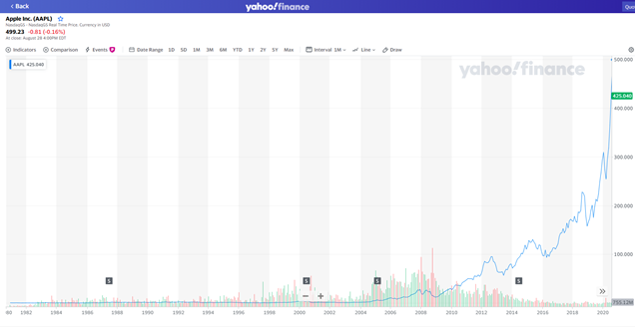
Looking at Apple’s stock price evolution chart we see that its quotes did not perform well between 1982 and 2004, despite the upbeat created with the launch of Mac personal computers and the colossal efforts of the iconic Steve Jobs as founder and CEO.
Even the technologists and followers of Jobs will have given up the investment and reinvested in other stocks during that period due to the historical reference of the quotes.
Everything changed with the launch of the Ipod in 2004 and especially the Iphone in 2006. Apple’s stock performed colossally, making many of its staunch and unfettable investors, millionaires.
But it is not just Apple or even the tech industry. The same was true for example with Nike:
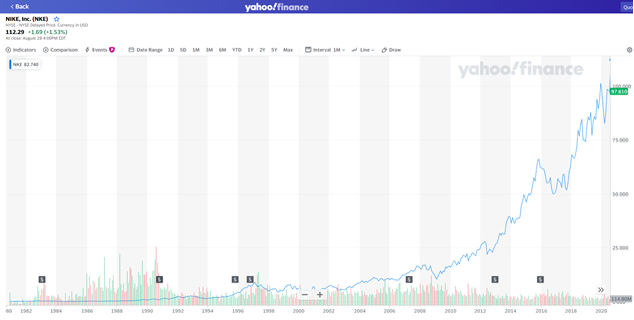
Nike stock was under $10 for a long period, and this level was certainly a benchmark for many investors. Few believed it could take on Adidas and other brands. The truth is that since 2007, Nike has experienced impressive growth and its stock currently shares close to $100 or has grown tenfold in just over 10 years.
Anchoring in the evaluation of markets, in the technical analysis
One of the models or evaluation methods widely used in the financial market are technical analysis, in addition or as an alternative to fundamental analysis (curiosity note: later quantitative methods emerged and today hybrid models such as quantamentals and either real-time or instantaneous models such as nowcasting are already working).
The method and evaluation of technical analysis looks for patterns, trends, statistics of market evolution, based on historical data or references, which are evaluated and translated into indicators, metrics, or graphs to predict future movements.
In the sense that they are based on references from the past we can say that they use, resort, or at least recognize the importance of anchoring effect on investor behaviour.
The following graph illustrates the example of a technical analysis made for the IBM (International Business Machines) action in 2013, using data from the previous decade:
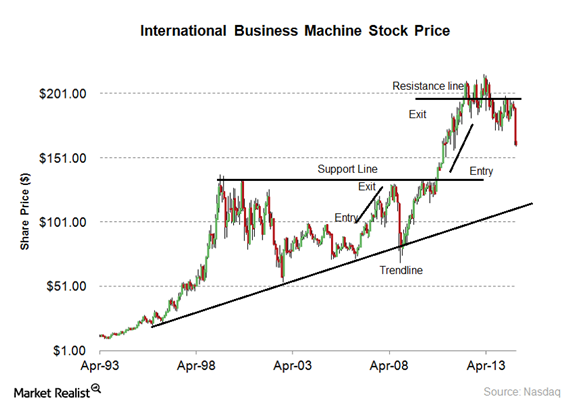
We see that this analysis draws a set of lines in a candle stick chart that read together result in a reading of valuation and forecast of asset prices.
The trend line, which shows an upward evolution, is a long-term bottom line. There are two horizontals, resistance (top) and support (bottom) lines that link and mark the market points or levels at which the IBM stock tested recent maximum values or exceeded identical values immediately preceding also called consolidation. Typically, the behaviour of transactional investors is to buy or strengthen positions when resistance levels (becoming support levels) are exceeded or broken, and to sell or reduce in a blocking or insurmountable resistance, sometimes even self-feeding these movements.
The following graph shows how graphical analysis can be made at the level of the main US and worldwide market, the S&P 500, with influence of the anchoring effect, based on the period from 1996 to date:
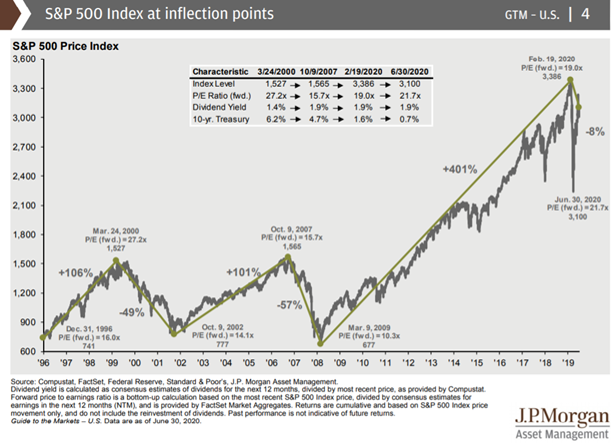
We see that levels of around 700 to 800 points in the S&P 500 acted as support and market low levels in 1996, 2002 and 2009 and that the 1,300 to 1500 points were resistance or peak market levels in the 2000 and 2007 crises. Since this date, a very positive period has been experienced supported by unique expansionary monetary policies that have led the index to growth of more than 400% between the lowest point of the subprime crisis and February 2020. We can also see that between 2013 and 2015, the 2,000 points acted as strong resistance as the 2,700 points in 2016 to 2018, which were surpassed by very aggressive monetary and fiscal policies, respectively.
The following graph does the same type of analysis to the S&P 500 in the very long run, for a period between 1900 to date and transforming the data to logarithmic basis (to match growths, to the extent that going from 1 to 10 is equal to going from 10 to 100 or from 100 to 1,000):
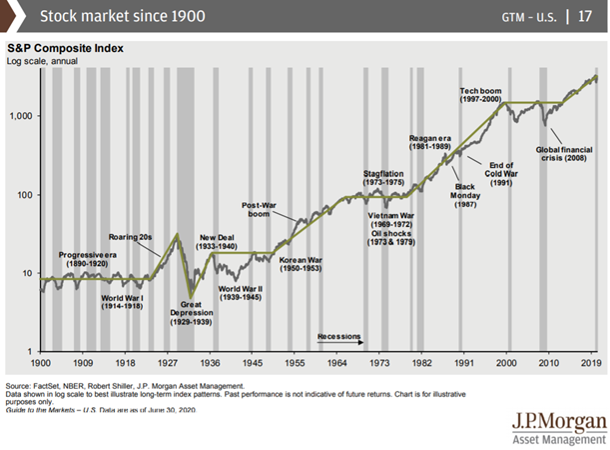
We see a clearly positive evolution of this index in this long period of more than 100 years, which went from a level of 10 to more than 1,000, that is, multiplied by more than 100 times the capital. We can also see that it was not a constant growth, that is, there were moments of correction and stabilization.
The major corrections occurred in the Great Depression of the 1930s, in the 1997/2000 technology bubble and in the great subprime or financial crisis of 2008. In the past there have also been some long periods without appreciation, which occurred between 1900 and 1920, between 1933 and 1955, between 1970 and 1982 and 2000 to 1015, usually associated with wars or equivalent disruptions. These stabilization periods are historical resistance and support levels.
Anchoring in the perception of the future or in the managing returns expectations
Anchoring also has important repercussions in the management of investment expectations.
Schroders conducts an annual survey of thousands of investors from around the world, and in 2019 sought to analyse the expectations of shareholder market investors for the following 5 years:
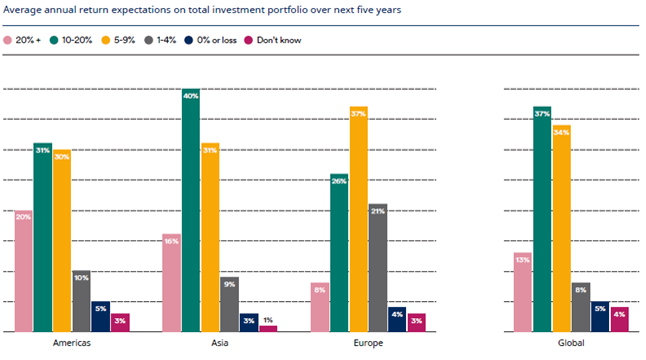
About 37% of investors recorded expectations of average annual returns of between 10% and 20%, followed by 34% of investors with returns of 5% to 9%. These results are surprising when we consider that the average annual returns of the main stock market index the S&P 500 is about 9% over a long period from 1926 to date. Especially if we take into account that in the last 12 years, after the great financial crisis, these returns have been very high, and that there is a statistical fact that we cannot ignore: that of the reversal to the mean.
What was concluded was precisely that these expectations were influenced by the anchoring effect of recent years, whether consciously or unconsciously, combined with another important bias that we will see in another article called today (or recency bias).
In fact, analysing the recent average annual returns for 10-year periods, those from 2008 to 2018 were 11.3% and those of the immediately preceding period, from 2007 to 2017, only 6.3%, i.e. almost half.
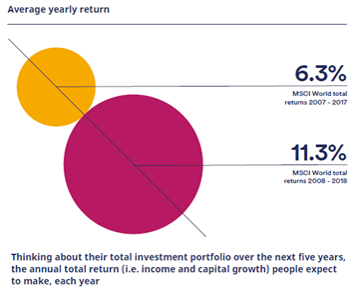
People expect returns of more than 10% because they were the ones they’ve noticed recently, or that have been anchored in their memory.
It is very important to have this bias present because too high expectations usually end in disappointment and are not in favour of the continuity of investments, as was also demonstrated in the survey.
https://corporatefinanceinstitute.com/resources/knowledge/trading-investing/anchoring-bias/
https://www.behavioraleconomics.com/resources/mini-encyclopedia-of-be/naive-allocation/


