The Credit Suisse Global Investment Returns Yearbook is based on a unique database that provides a historical record of the real returns of stocks, bonds, cash and currencies from 35 countries. The data covers both developed and emerging markets, and goes back to 1900.
This is the fourth time we’ve covered this annual publication by Elroy Dimson, Paul Marsh & Mike Staunton, who published the world’s reference book on financial data “Triumph of the Optimists” in 2000.
In addition to the regular analysis of historical data, the publication addresses some relevant topics in each year.
The 2020 edition focused on ESG investments, and investment in emerging countries compared to the most advanced economies.
The 2021 edition focused on forecasts of future long-term returns on equities and bonds, and on the performance of asset returns in emerging economies and their comparison with advanced economies.
The 2022 edition analysed how stocks and bonds performed during different inflation regimes and during periods of rising interest rates, two current concerns, and the importance of diversification, both in the number of securities and in international terms.
This summary of this current publication contains four excerpts from the 2023 annual report.
The first excerpt describes the database used, which is at its core and covers all major asset categories in 35 countries (including three new markets this year). Most of these markets, as well as the 90-country world index, have 123 years of data dating back to 1900.
The second excerpt explains why a long-term perspective is needed to understand risk and return in equities and bonds and summarises the long-term evidence on equity returns.
The third excerpt provides medium-term projections of the return on stocks and bonds.
The fourth excerpt focuses on the relationship between investment in goods and inflation.
The outlook for long-term performance of stocks and bonds in periods of instability
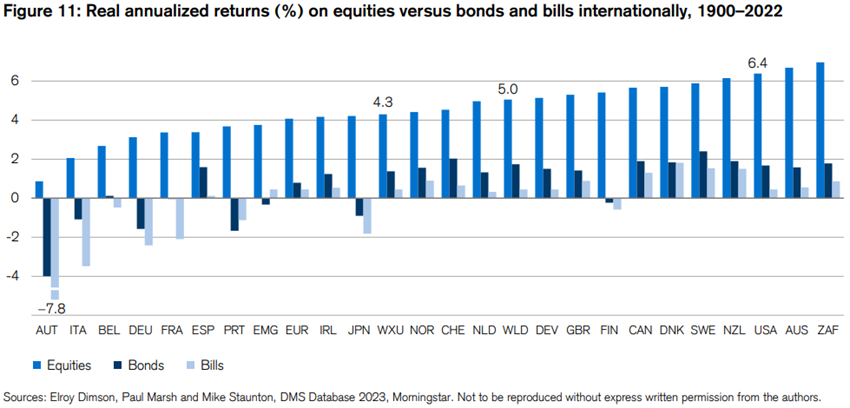
Analysis of long-term returns shows how stocks have outperformed bonds and treasury bills in every country since 1900, reflecting the basic principles of risk and return.
While bonds have delivered equity-like returns since the 1980s, the inflationary shock of 2022 meant that real bond returns were the worst on record for many countries, including the US, UK, Switzerland and developed markets in general.
While stocks have enjoyed excellent long-term returns, they are not and never have been the hedge against inflation that many observers suggest.
Risk premiums are there for a good reason
There is a historical risk premium in equity and bond returns relative to treasury bills, as the necessary trade-off for volatility and liquidity risk.
After a prolonged period of high and stable real returns, this report documents the stressed periods of bonds and stocks over time.
We know that portfolio diversification can mitigate these risks. However, the benefits of diversification are reaped in the long term, not in the short term, as recent performances of 60/40 stock/bond strategies have shown (relying excessively on recent negative correlations between the two assets rather than on analysis of historical records).
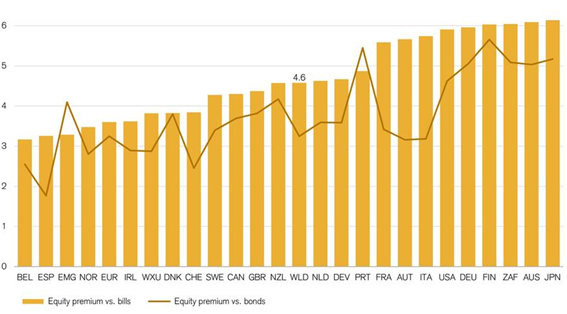
Medium-term asset return expectations
The following chart shows the relationship between the real interest rate in a given year and the real return on an investment in stocks and bonds in the five years immediately following:
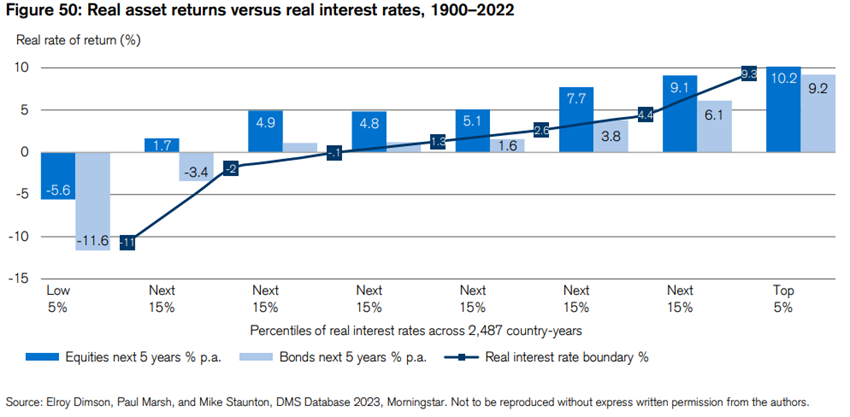
The bars show the average real returns on bonds and stocks, including reinvested yields, over the next five years. For example, the first pair of bars shows that during the years in which a country had a real interest rate of less than -11%, the average annualized real return over the following five years was -5.6% for stocks and -11.6% for bonds.
The first three bands comprise 35% of all observations and refer to real interest rates below zero.
Negative real interest rates have been recorded in about a third of all years. These low real rates often came in inflationary times.
There is a clear relationship between the current real interest rate and subsequent real returns for both stocks and bonds.
The regression analysis of real interest rates on real stock and bond yields confirms this, producing highly significant coefficients.
It should also be noted that, in all the bands presented, stocks provided a higher return than bonds.
When real interest rates are low, the expected future returns of risk assets are also lower.
However, during periods when real interest rates fall unexpectedly, this will tend to provide an immediate boost to asset prices and, consequently, yields, even though potential returns have been reduced.
These patterns were prevalent for much of the 21st century until 2021.
The revaluation of commodities in an era of stagflation
The report investigates the pernicious influence of inflation on bond and equity returns, but also the role of commodities in this regard.
As rising commodity prices, including oil and gas, have contributed to the resurgence of inflation, the report explores whether commodity investment offers a hedge against inflation.
The following chart shows that for stocks and bonds, real returns tend to be higher when economic growth is higher and inflation is lower:
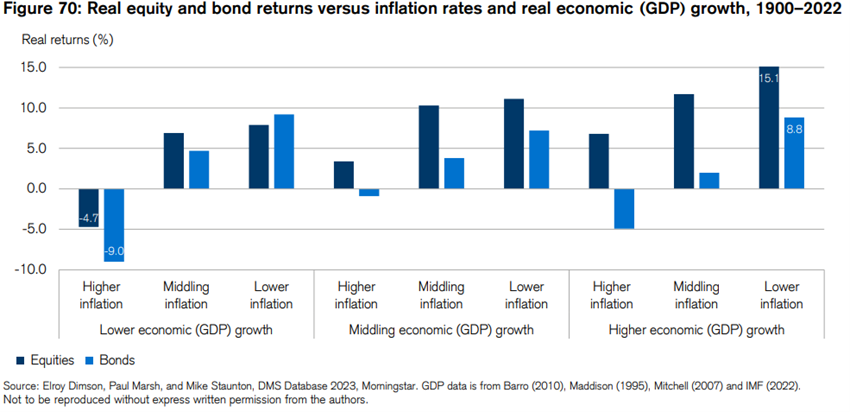
Within each growth category, the returns on stocks and bonds increase as inflation decreases.
While individual commodities on average gave a negative annualized real return of -0.49%, an equally weighted portfolio of those same commodities gave a positive return of +2.04%. Booth and Fama (1992) call this the “return of diversification”.
The bottom line is that commodity futures portfolios provided attractive risk-adjusted long-term returns, yielding a premium over treasury bills of more than 3%, albeit with some large and long drawdowns. These portfolios also provide a hedge against inflation, in contrast to most other assets.
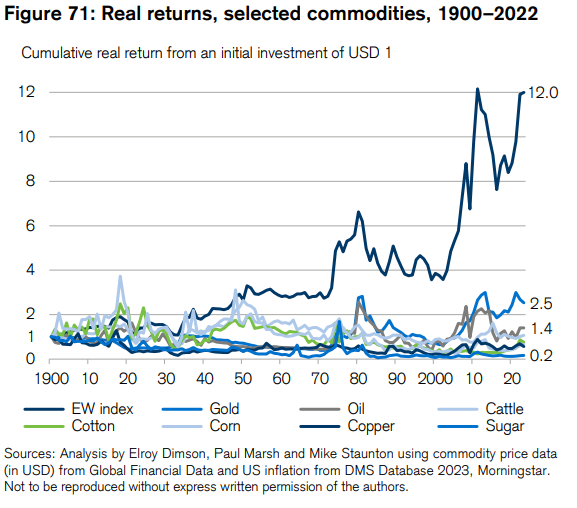
The following chart shows the excesses of cumulative 1871-2022 inflation returns from an initial investment of USD 1 in futures compared to US stocks and bonds.
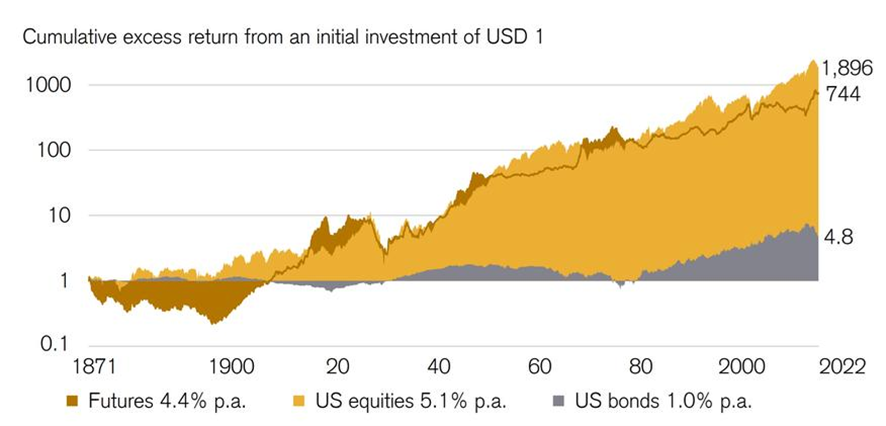
In that period, the annualized risk premium of U.S. equities against treasury bills was 5.1%, while the annualized risk premium of commodity futures was 4.4%.
The annual volatilities of the two excess return series were very similar, at -19.5% for equities and 20.0% for commodity futures.
The correlations of asset classes with inflation
The chart below shows the correlation between annual inflation and real asset returns from 1900 to 2022 (although inflation-linked bonds, commercial real estate, and gold have later start dates):
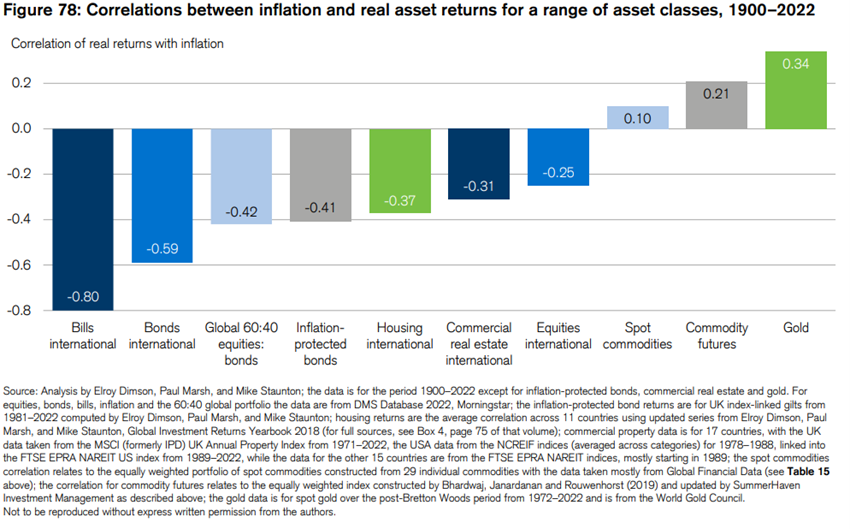
Bonds, treasury bills, stocks and real estate make up the vast majority of investment assets traded globally. The chart shows that all of them have negative correlations with inflation.
To find positive correlations – assets that, on average, benefit from inflation – we need to enter the world of commodities.
The real return on an equally weighted portfolio of commodities had a positive correlation of 0.10 with inflation. However, the long-term excess profitability has been low and almost certainly negative on a post-cost basis.
However, as we have seen above, the real return of an equally weighted commodity futures portfolio correlates with inflation by 0.21, and offers an acceptable long-term risk premium.


