Households of the richest countries have a wealth of 5 times the net annual disposable income
Who invests the most in the world? How are household assets distributed in the various countries? Are there preferences or marked differences between savings and investments?
These are relevant questions to understand if there are factors and what are the factors that give rise to the differences in the investment choices of families.
In richer countries, households have most of their wealth in investments rather than savings, unlike less-rich countries
The OECD regularly presents the distribution of the average assets of households in the various countries between liquidity or savings (currency and deposits) and investments, distributed in shares and other equity, securities other than shares (mostly bonds), mutual funds, insurance products, pension funds, and others.
The following graph shows this distribution for the year 2018 ordering the various countries by the weight of savings against the investment components:
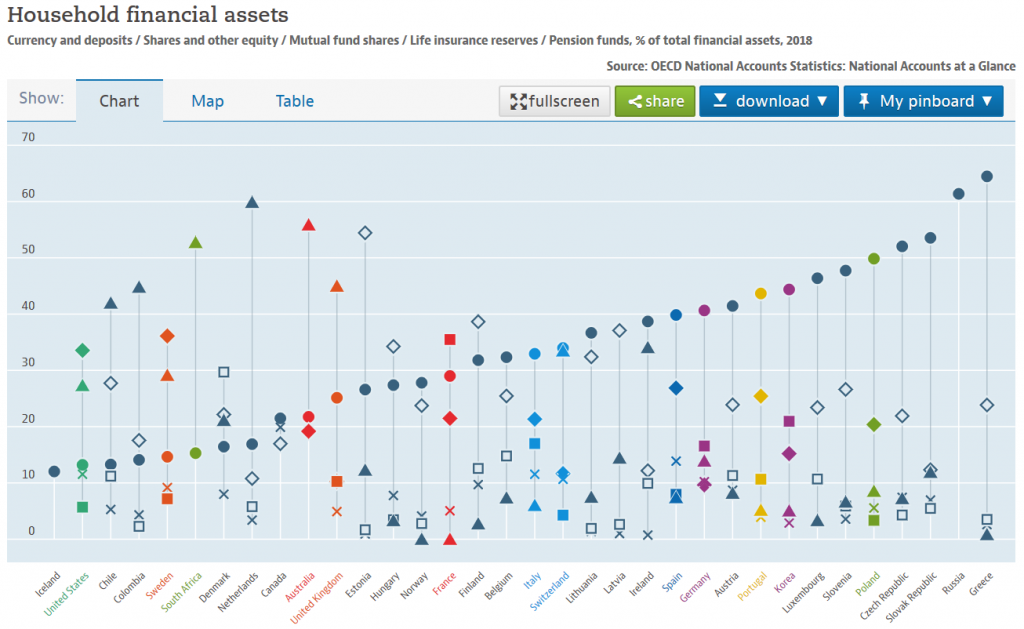
Household accounts – Household financial assets – OECD Data
The following conclusions can be drawn for average households in the OECD:
- Portugal is one of the countries with the highest savings (almost 50%) and fewer investments, at the level of the poorest countries in the OECD and only surpassed by Japan in the richest countries (combined effect of the fall in the Japanese stock market by more than 75%, or economic stagnation between 1990 and 2010, and ageing);
- The vast majority of advanced countries starting with the US (less than 15%), Sweden, Denmark, the Netherlands, Canada, Australia, the United Kingdom and France are the countries with the greatest investment weight and the smallest savings in terms of financial assets composition.
- In terms of investments, the component that is present across almost all advanced countries is direct investment in shares, which accounts for between 20% and 30% of the financial assets in those countries.
- There are countries with a large weight of pension funds in total assets, representing between 25% and 50%, such as the US, Sweden, the Netherlands, Australia, the UK and Ireland. In Portugal, pension funds have a weight of less than 10%;
- Mutual funds have a more or less constant weight in the various countries between 5% and 10%.
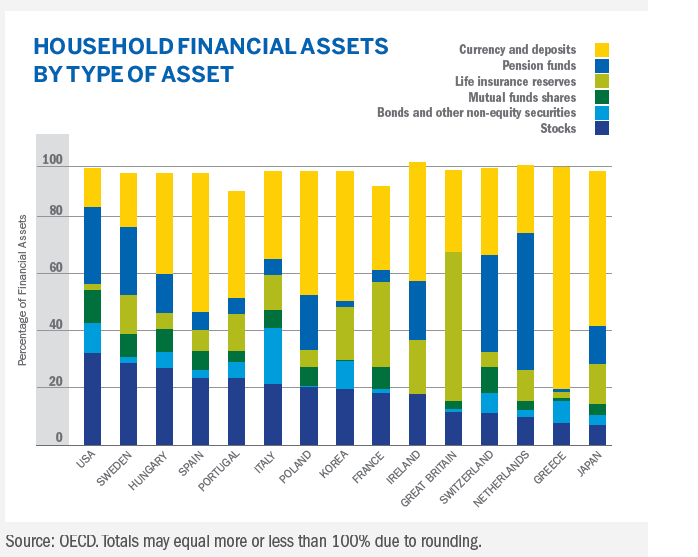
The following graph shows the same information of the breakdown of the financial assets of households in the world according to the OECD to a narrower number of countries, allowing for a better and easier visualization:
The following chart shows asset allocations only in mutual funds in 14 European countries in 2018:
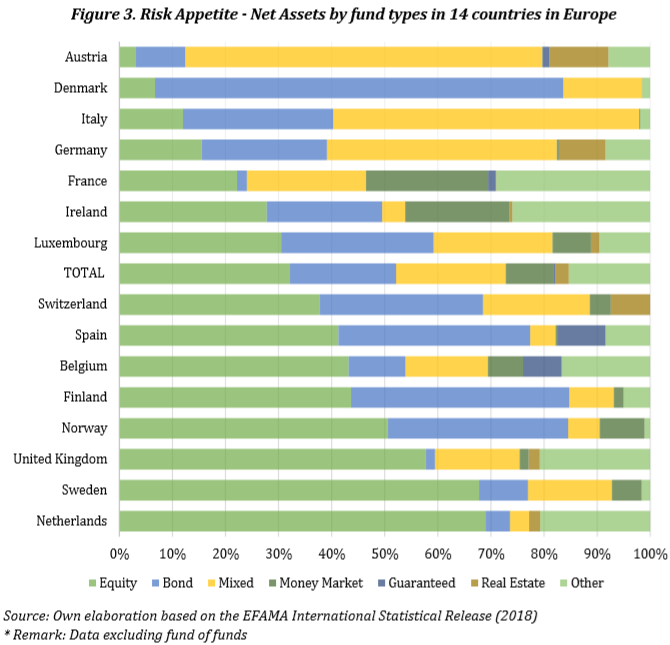
The main conclusions are as follows:
- On average, in these 14 countries, more than 30% are invested in equity funds, 20% in bond funds, 15% in mixed funds and 30% distributed among treasury funds, capital guaranteed capital and others.
- In general, the more developed countries, in terms of economic development, level of wealth and degree of development of capital markets, the greater the preference for investment in equity funds. In the Netherlands, Sweden, the United Kingdom, Norway, Belgium and Switzerland, the largest allocations are in equity funds, in contrast with Denmark, Italy and Germany, where the predominant investment is in bond and mixed funds.
- Selective and direct allocations dominate in the two main assets, stocks and bonds, to the detriment of mixed or balanced ones. Mixed funds have only a great expression in Austria, Italy and Germany.
In short: Households in the most advanced countries invest more and contribute more to pension funds. Households in less-than-rich countries typically make more savings, whether in currency or bank deposits.
Regardless of the reasons there is one certainty: by investing more, households of rich countries become richer and those of the poorest get poorer, which accentuates their inequalities.
Households of the richest countries have a wealth of 5 times the net annual disposable income
The OECD also regularly publishes household wealth as a percentage of disposable income, with the latest figures for 2016:
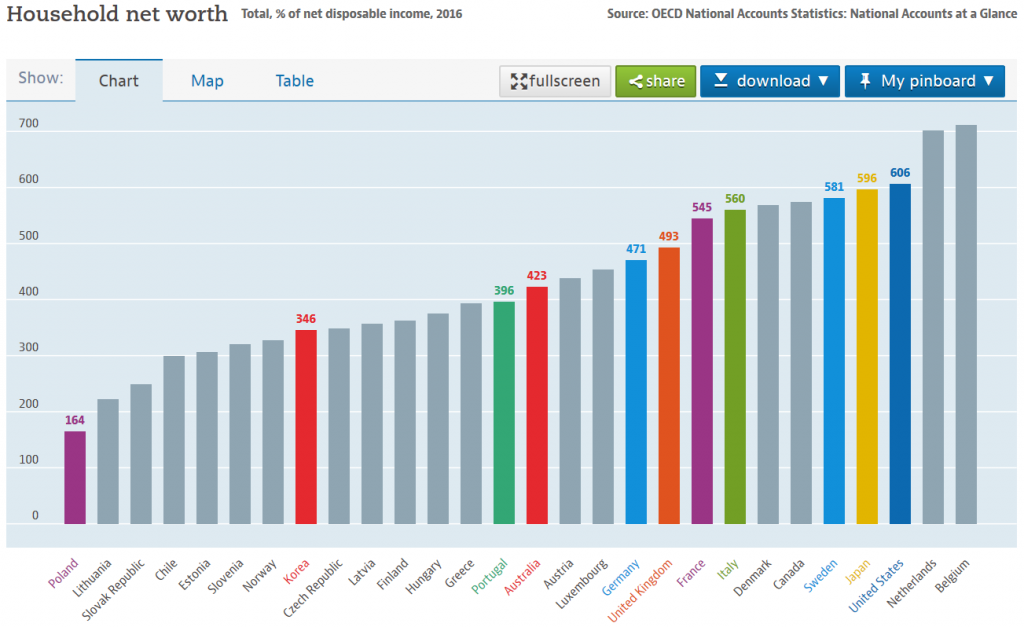
Households in the richest countries have an average wealth valued at between 5 and 6 times their disposable income and the poorest between 1.5 and 3 times. Portugal has an average wealth of almost 4 times the disposable income.
For the picture to be complete it is necessary to see how the disposable income of households in the various countries corrected by purchasing power parity.
The OECD also publishes these data, the most current being those of 2017:
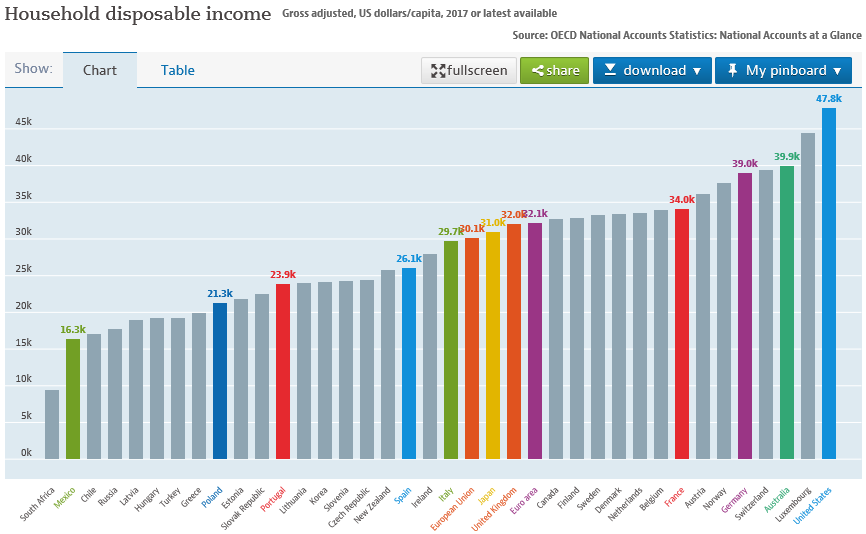
The US leads with nearly $50,000 of average annual disposable income. The European Union reaches $30,000 and Portugal stands at $21,300.
It remains to be seen to what extent the realities of wealth and development, socio-economic, financial, cultural differences, financial market importance, financial education, tax models or other reasons explain these differences.
It is also necessary to consider that these data are for households, in average terms, and may be influenced and biased by inequalities in the distribution of income and wealth in each country.


