• About us
    • Who we are
    • Mission
  • Contacts
  • English
    • Português (Portuguese (Portugal))
    • Español (Spanish)
    • Français (French)
  • Login
Investorpolis
[xyz-ips snippet="Banners-Publicitarios"]
  • Home
  • Investing Series Guide
    • All
    • I. Goal Based Investing
    • II. Compounding & Inflation
    • III. Assets Risks & Returns
    • IV. Efficient Diversification
    • IX. Sustainable Investing and ESG
    • V. The Investor
    • VI. Assets and Investments
    • VII. Index Funds
    • VIII. Successful Investing
    • XI. Other Topics
    Choosing Mutual Funds Series: Part 7 – The Largest Fund Management Companies

    Choosing Mutual Funds Series: Part 7 – The Largest Fund Management Companies

    Maximizing the time invested in the stock market instead of choosing the times to invest: Part 3 – The market cycles and the mean reversion

    Maximizing the time invested in the stock market instead of choosing the times to invest: Part 3 – The market cycles and the mean reversion

    Choose P4 Mutual funds series – Evaluate and use the benchmarks and ratings of funds

    Choose P4 Mutual funds series – Evaluate and use the benchmarks and ratings of funds

    Simple Portfolios (DIY) Series Part 3: The traditional 60/40 Portfolio, the pros and cons, and how to execute it

    Simple Portfolios (DIY) Series Part 3: The traditional 60/40 Portfolio, the pros and cons, and how to execute it

    Investing in Secular Stocks Series: Part 4.1 – The 3 Valuation Methods and Fundamental Analysis

    Investing in Secular Stocks Series: Part 4.1 – The 3 Valuation Methods and Fundamental Analysis

    Simple Portfolio Series (DIY) Part 2: The Traditional Portfolio 60/40, what it is, for whom, and its performance

    Simple Portfolio Series (DIY) Part 2: The Traditional Portfolio 60/40, what it is, for whom, and its performance

    Trending Tags

      • I. Goal Based Investing
      • II. Compounding & Inflation
      • III. Assets Risks & Returns
      • IV. Efficient Diversification
      • V. The Investor
      • VI. Assets and Investments
      • VIII. Successful Investing
      • IX. Sustainable Investing and ESG
      • X. Kits and Tips
      • XI. Other Topics
    • Wealth and Investing
      • All
      • Investing
      • Wealth
      Financial Markets Outlook 2024: US and Japanese stocks gains, and 10-year US bond yields below 4%

      Financial Markets Outlook 2024: US and Japanese stocks gains, and 10-year US bond yields below 4%

      Financial Markets Outlook 2024 from the world’s largest investment banks: Disparity in forecasts for U.S. economic growth results in projections for the S&P 500 between 4,500 and 5,000 points, with interest rates on 10-year U.S. bonds below 4%

      Financial Markets Outlook 2024 from the world’s largest investment banks: Disparity in forecasts for U.S. economic growth results in projections for the S&P 500 between 4,500 and 5,000 points, with interest rates on 10-year U.S. bonds below 4%

      Investing in Large, Medium or Small Caps: Part 4 – The Valuation of Equity Capitalization Classes

      Investing in Large, Medium or Small Caps: Part 4 – The Valuation of Equity Capitalization Classes

      Investing in Small, Medium or Large Caps: Part 3 – The market cycles of stocks capitalization segments

      Investing in Small, Medium or Large Caps: Part 3 – The market cycles of stocks capitalization segments

      Investing in Small, Medium or Large Caps: Part 2 – Features and pros and cons of stocks caps segments

      Investing in Small, Medium or Large Caps: Part 2 – Features and pros and cons of stocks caps segments

      Investing in large, mid or small caps: Part 1 – The capitalization classes of stocks and their long-term performance

      Investing in large, mid or small caps: Part 1 – The capitalization classes of stocks and their long-term performance

      Trending Tags

        • Investing
        • Wealth
      • Retirement & Savings
        • All
        • Retirement
        • Savings
        Retirement Series #3: Choice of asset allocation. Part 2 – The allocations preferred by experts and investors

        Retirement Series #3: Choice of asset allocation. Part 2 – The allocations preferred by experts and investors

        Retirement Series #3: Choice of asset allocation. Part 1 – The effect on accumulated capital

        Retirement Series #3: Choice of asset allocation. Part 1 – The effect on accumulated capital

        Retirement Series: How much money do we need to live through retirement?

        Retirement Series: How much money do we need to live through retirement?

        Retirement Series: Part 1 – Overview – A backwards view

        Retirement Series: Part 1 – Overview – A backwards view

        How many years do our public or social pensions last?

        What is the replacement rate of retirement pensions?

        Trending Tags

          • Retirement
          • Savings
        • Tools
          • All
          • Calculators
          • Publications
          • Sites and apps
          Yield curve

          Yield curve

          OECD Composite Leading indicator

          OECD Composite Leading indicator

          The Conference Board index

          The Conference Board index

          Baltic Dry Index

          Baltic Dry Index

          Retail sales

          Retail sales

          ADP Employment Report

          ADP Employment Report

          Trending Tags

          • calculators
          • Calculators
          • Publications
          • Sites and apps
        • More
          • All
          • Best of
          Best Of Mutual Funds Series: Dividend Stocks for Investors Outside the U.S.

          Best Of Mutual Funds Series: Dividend Stocks for Investors Outside the U.S.

          Best Of Mutual Funds Series: Dividend Stocks for U.S. Investors

          Best Of Mutual Funds Series: Dividend Stocks for U.S. Investors

          Best Of Mutual Funds Series: Investment Grade Bonds, Indexed, for Eurozone Investors

          Best Of Mutual Funds Series: Investment Grade Bonds, Indexed, for Eurozone Investors

          Best Of Mutual Funds Series: US Bonds, Indexed, for US Investors

          Best Of Mutual Funds Series: US Bonds, Indexed, for US Investors

          Best Of Mutual Funds Series: Passive, US Large Stocks, for Non-US Investors

          Best Of Mutual Funds Series: Passive, US Large Stocks, for Non-US Investors

          Best Of Mutual Funds Series: Passive Large US Stocks for US Investors

          Best Of Mutual Funds Series: Passive Large US Stocks for US Investors

          Trending Tags

            • Best of
            • Reviews
            • Snapshots
            • Others
          No Result
          View All Result
          • Home
          • Investing Series Guide
            • All
            • I. Goal Based Investing
            • II. Compounding & Inflation
            • III. Assets Risks & Returns
            • IV. Efficient Diversification
            • IX. Sustainable Investing and ESG
            • V. The Investor
            • VI. Assets and Investments
            • VII. Index Funds
            • VIII. Successful Investing
            • XI. Other Topics
            Choosing Mutual Funds Series: Part 7 – The Largest Fund Management Companies

            Choosing Mutual Funds Series: Part 7 – The Largest Fund Management Companies

            Maximizing the time invested in the stock market instead of choosing the times to invest: Part 3 – The market cycles and the mean reversion

            Maximizing the time invested in the stock market instead of choosing the times to invest: Part 3 – The market cycles and the mean reversion

            Choose P4 Mutual funds series – Evaluate and use the benchmarks and ratings of funds

            Choose P4 Mutual funds series – Evaluate and use the benchmarks and ratings of funds

            Simple Portfolios (DIY) Series Part 3: The traditional 60/40 Portfolio, the pros and cons, and how to execute it

            Simple Portfolios (DIY) Series Part 3: The traditional 60/40 Portfolio, the pros and cons, and how to execute it

            Investing in Secular Stocks Series: Part 4.1 – The 3 Valuation Methods and Fundamental Analysis

            Investing in Secular Stocks Series: Part 4.1 – The 3 Valuation Methods and Fundamental Analysis

            Simple Portfolio Series (DIY) Part 2: The Traditional Portfolio 60/40, what it is, for whom, and its performance

            Simple Portfolio Series (DIY) Part 2: The Traditional Portfolio 60/40, what it is, for whom, and its performance

            Trending Tags

              • I. Goal Based Investing
              • II. Compounding & Inflation
              • III. Assets Risks & Returns
              • IV. Efficient Diversification
              • V. The Investor
              • VI. Assets and Investments
              • VIII. Successful Investing
              • IX. Sustainable Investing and ESG
              • X. Kits and Tips
              • XI. Other Topics
            • Wealth and Investing
              • All
              • Investing
              • Wealth
              Financial Markets Outlook 2024: US and Japanese stocks gains, and 10-year US bond yields below 4%

              Financial Markets Outlook 2024: US and Japanese stocks gains, and 10-year US bond yields below 4%

              Financial Markets Outlook 2024 from the world’s largest investment banks: Disparity in forecasts for U.S. economic growth results in projections for the S&P 500 between 4,500 and 5,000 points, with interest rates on 10-year U.S. bonds below 4%

              Financial Markets Outlook 2024 from the world’s largest investment banks: Disparity in forecasts for U.S. economic growth results in projections for the S&P 500 between 4,500 and 5,000 points, with interest rates on 10-year U.S. bonds below 4%

              Investing in Large, Medium or Small Caps: Part 4 – The Valuation of Equity Capitalization Classes

              Investing in Large, Medium or Small Caps: Part 4 – The Valuation of Equity Capitalization Classes

              Investing in Small, Medium or Large Caps: Part 3 – The market cycles of stocks capitalization segments

              Investing in Small, Medium or Large Caps: Part 3 – The market cycles of stocks capitalization segments

              Investing in Small, Medium or Large Caps: Part 2 – Features and pros and cons of stocks caps segments

              Investing in Small, Medium or Large Caps: Part 2 – Features and pros and cons of stocks caps segments

              Investing in large, mid or small caps: Part 1 – The capitalization classes of stocks and their long-term performance

              Investing in large, mid or small caps: Part 1 – The capitalization classes of stocks and their long-term performance

              Trending Tags

                • Investing
                • Wealth
              • Retirement & Savings
                • All
                • Retirement
                • Savings
                Retirement Series #3: Choice of asset allocation. Part 2 – The allocations preferred by experts and investors

                Retirement Series #3: Choice of asset allocation. Part 2 – The allocations preferred by experts and investors

                Retirement Series #3: Choice of asset allocation. Part 1 – The effect on accumulated capital

                Retirement Series #3: Choice of asset allocation. Part 1 – The effect on accumulated capital

                Retirement Series: How much money do we need to live through retirement?

                Retirement Series: How much money do we need to live through retirement?

                Retirement Series: Part 1 – Overview – A backwards view

                Retirement Series: Part 1 – Overview – A backwards view

                How many years do our public or social pensions last?

                What is the replacement rate of retirement pensions?

                Trending Tags

                  • Retirement
                  • Savings
                • Tools
                  • All
                  • Calculators
                  • Publications
                  • Sites and apps
                  Yield curve

                  Yield curve

                  OECD Composite Leading indicator

                  OECD Composite Leading indicator

                  The Conference Board index

                  The Conference Board index

                  Baltic Dry Index

                  Baltic Dry Index

                  Retail sales

                  Retail sales

                  ADP Employment Report

                  ADP Employment Report

                  Trending Tags

                  • calculators
                  • Calculators
                  • Publications
                  • Sites and apps
                • More
                  • All
                  • Best of
                  Best Of Mutual Funds Series: Dividend Stocks for Investors Outside the U.S.

                  Best Of Mutual Funds Series: Dividend Stocks for Investors Outside the U.S.

                  Best Of Mutual Funds Series: Dividend Stocks for U.S. Investors

                  Best Of Mutual Funds Series: Dividend Stocks for U.S. Investors

                  Best Of Mutual Funds Series: Investment Grade Bonds, Indexed, for Eurozone Investors

                  Best Of Mutual Funds Series: Investment Grade Bonds, Indexed, for Eurozone Investors

                  Best Of Mutual Funds Series: US Bonds, Indexed, for US Investors

                  Best Of Mutual Funds Series: US Bonds, Indexed, for US Investors

                  Best Of Mutual Funds Series: Passive, US Large Stocks, for Non-US Investors

                  Best Of Mutual Funds Series: Passive, US Large Stocks, for Non-US Investors

                  Best Of Mutual Funds Series: Passive Large US Stocks for US Investors

                  Best Of Mutual Funds Series: Passive Large US Stocks for US Investors

                  Trending Tags

                    • Best of
                    • Reviews
                    • Snapshots
                    • Others
                  No Result
                  View All Result
                  Investorpolis
                  No Result
                  View All Result
                  Home Investing Series Guide

                  Why invest in stocks?

                  22 de March, 2020
                  in Investing Series Guide, VI. Assets and Investments
                  Reading Time: 14 mins read
                  0 0
                  0
                  Share on FacebookShare on Twitter

                  Reason and logic are the most important decision factors to compel us to do something. We only do what makes sense to us and with a purpose. Only after comes the how, how much, in what, when and where. There are 5 great reasons to invest in the stocks of the biggest companies in the world.

                  #1: Because stocks are the financial asset with the highest returns in the medium and long term and the only one that affords significant asset appreciation in real terms

                   #2: Because in the medium and long term the risk of investing in stocks is much mitigated

                   #3: Because we have medium-and long-term goals that are not achieved otherwise (with bonds, and even less with deposits and savings accounts)

                  #4: Because diversification of investments between stocks and bonds allows us to balance the return and risk, and adjust them to our personal profile

                  #5: Because we cannot ignore the wealth creation coming from the returns and capital appreciation of the investment in stocks

                  #1: Because stocks are the financial asset with the highest returns in the medium and long term and the only one that affords significant asset appreciation in real terms

                  Stocks are the financial asset with greater returns in the medium and long term.

                  The following graph shows the cumulative returns of 2 major financial asset classes in the U.S. of 1900 to 2017:

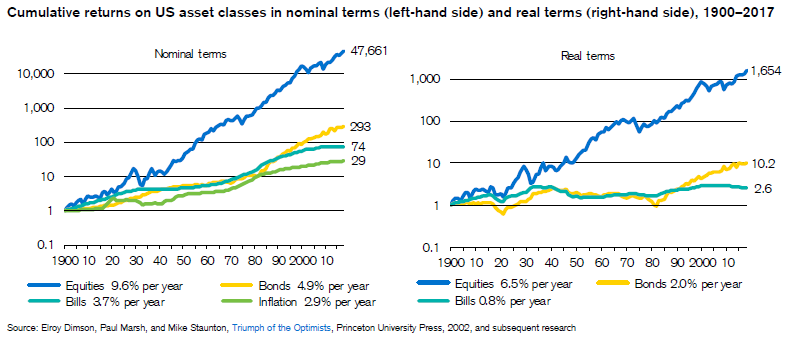
                  The stocks of large companies, measured by the S&P 500 index, had an average annual return of 9.6%.

                  The average annual return of the 10-year Treasury bond was only 4.9 percent, still well above the average annual return of 3.7% of 3-month Treasury bills (the main short-term investment of commercial banks, and as such, the ceiling interest rate reference they pay for deposits), and average annual inflation rate of 2.9%.

                  A dollar invested in 1900 would have generated in 2017, after 117 years, $47.661 if invested in stocks of large companies. The same dollar would result in a $293 capital if invested in Treasury bonds and $74 if invested in Treasury bills.

                  Due to inflation, a dollar in 1900 would have the same purchasing power than $29 in 2017. To get the value of the previous capital, in real terms, we would have to divide the values by the inflated dollar. 

                  The value of the capital invested in stocks of large companies increased 162 times more than the one invested in Treasury bonds. In real terms, the accumulated capital would be $1.654 in shares of large companies.

                  The accumulated capital in real terms would be $9.9 in bonds and just $2.6 in Treasury bills (it is proof that deposits and savings accounts don’t yield enough, even in the very long term). 

                  Expect 117 years, for what? – may someone ask.

                  Although 117 years may be a purpose in life, such as the transmission of a heritage in inheritance, we can see from the chart that this stock appreciation happens gradually, and for long periods, briefly interrupted by falls in some years.

                  Therefore, it is not necessary to wait that long. It is an evolution along almost a straight line with some occasional breaks, called market corrections.

                  As we shall see below, it is precisely to mitigate the risk of these market fluctuations and capture all their potential gains, that one should recommend investment in stocks for timeframes from two to three years.

                  The next years will be different and worse than the past – others say! We live the present and the recent past so intensely that we tend to think that the problems and risks happen only now.

                  If we remember that in these 117 years are included two great world wars, two major financial crises (great depression and great financial crisis), periods of hyper-unemployment and hyperinflation, several monetary crises, multiple bankruptcies of States and companies, etc., nothing could sound more fake. History repeats itself: with progress and crises. 

                  The following graph shows the distribution of the annual rates of returns of the stocks of large US companies, given by S&P 500 its main market index, between 1928 and 2017:

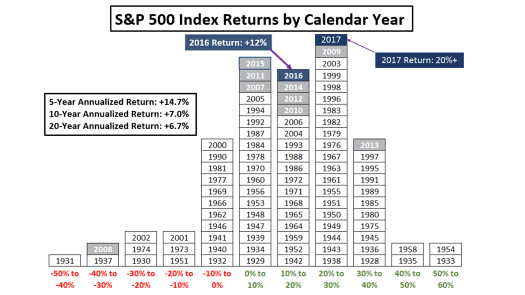
                  You can easily see that this excess of the annual average rate of return was positive in more than 2/3 of the years. This rates difference was more negative in the years of the great depression, the great financial crisis, and the technology bubble.  

                  The U.S. case is not unique. The chart below shows the average annual return rates of major stocks indexes and government bonds, in real terms (inflation deducted), registered in several countries of the world, between 1900 and 2017:

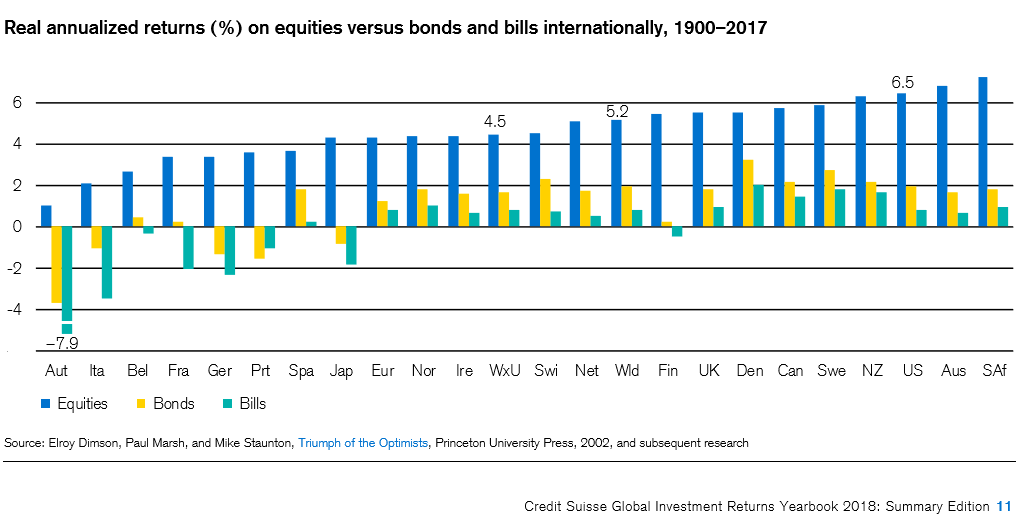
                  The average annual rate of return of the stocks of large companies worldwide was 5.2%, less than that of 6.5% in the US. This was more than double the rate of Treasury bonds and incomparably greater than 0.5% of Treasury bills.

                  Another useful way to evaluate the returns between stocks and bonds is to compare their values for periods longer than a year but, for example, for 10 year periods:

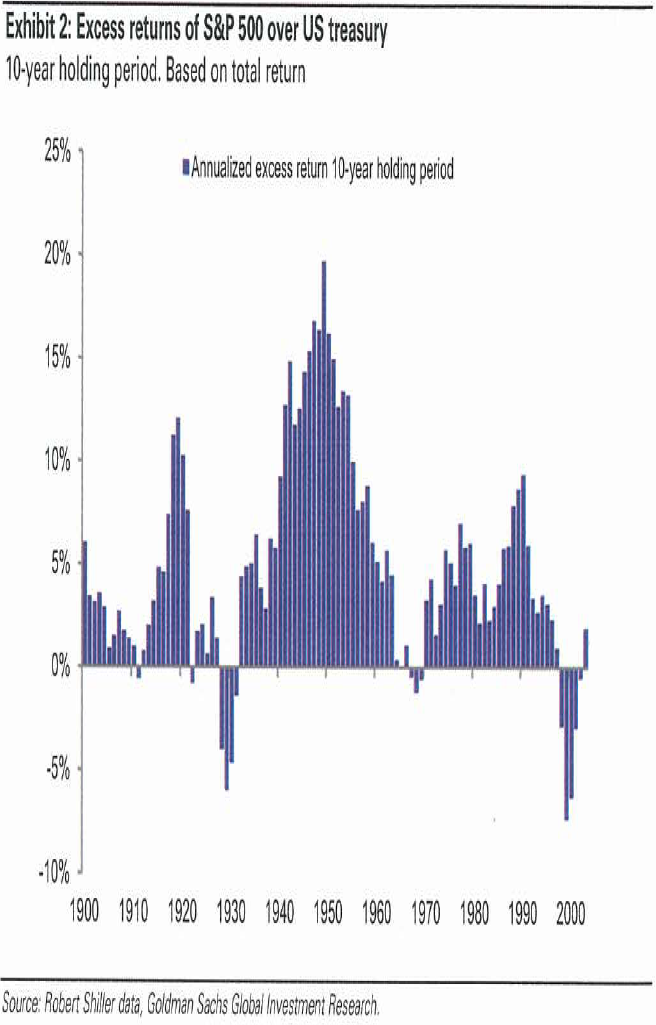
                  This comparison is useful because many of our financial goals have a timeframe of not less than 10 years.

                  As we can see rare are the occasions when the annual average rates of return for periods of 10 years of the stocks of large companies were lower than government bonds. This situation occurred in just 12 of the 113 total cases, centred in periods of financial crises in the late 30s, and the 2000 years.

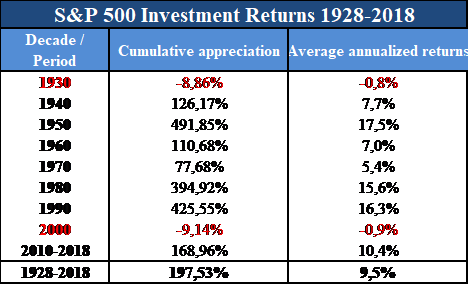
                  The following table shows the average annual return rates for decades in the U.S., from 1930 to date:

                  .

                  The S&P 500 average annual rates of return were negative, and very slightly negative, only in the 1930 and 2000. The average annual rate of return in this period was 9.5% per year.

                  The following graph shows the evolution of the main stock market indexes from 2007 to date:

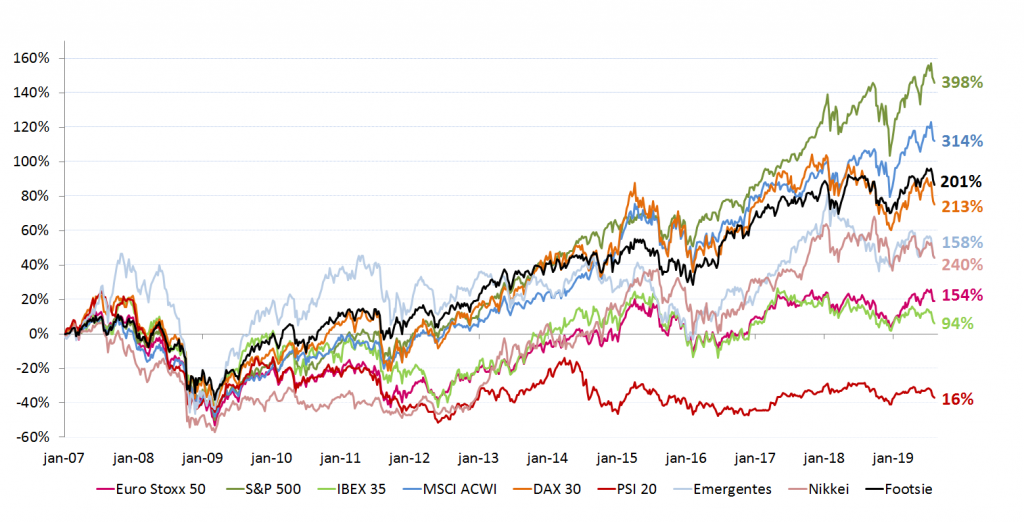
                  The great financial crisis of 2007-08, started by the subprime in the US, brought down all major indexes stock market indexes between 40% and 60%, due to the contagion of globalization of markets.

                  In late 2008 and early 2009, all the main indexes began to recover, but two distinct realities.

                  The American, German and World indexes surpassed the pre-crisis levels, registering accumulated valuations in excess of 200% and even 300% from the March 2009 lows.

                   The remaining European indices, in particular the Euro zone (Eurostoxx 50), French (CAC40) and the Spanish (IBEX35 index), have not yet reached the pre-crisis levels, due to the great European sovereign debt crisis of 2011-12.

                  The Portuguese index (PSI20 was), not even exceeded the minimum levels of the pre-crisis of 2009.

                  #2: Because in the medium and long term the risk of investing in stocks is much mitigated

                  The stocks have higher returns, but have also more risk than bonds. There is no free lunch in finance!

                  The following graph shows the rates of return and risk of both assets, in the U.S. since 1950 to date:

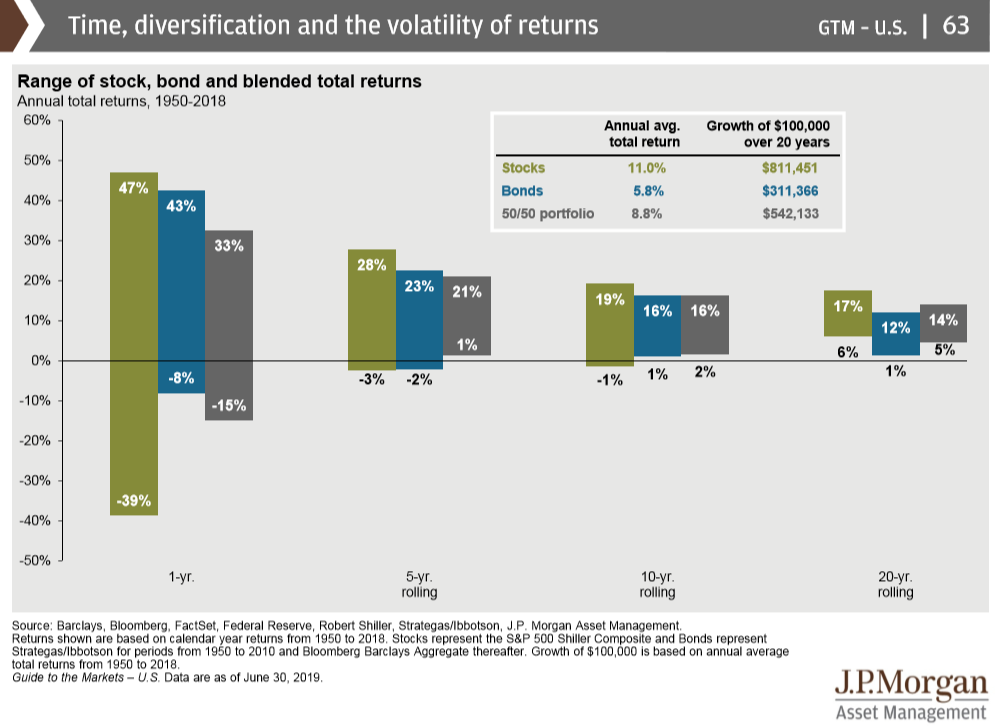
                  The stocks of large corporations had annual average rates of return of 11%, almost double the 5.8 percent of the Treasury bonds.

                  However, stocks had much stronger price swings than bonds. During this period, there were years in which the stocks lost 39%, while the bonds did not lose more than 8% on their worst year.

                  However, this situation changes radically when we look at the rates of return on both assets for a period longer than 5 years. Stocks lost a maximum of 3% a year in 5-year periods, very close to 2% per year of bonds. In 10 and 20-year periods, stocks are even more interesting.

                  More important than the ranges of fluctuation is the frequency or probability of occurrence.

                  The following graph shows the percentage of periods in which the rates of return of the stocks of large companies have beaten the Government bonds and Treasury bills, in the intermediate term (5 years) and long term (more than 10 years), in the period from 1926 to 2015:

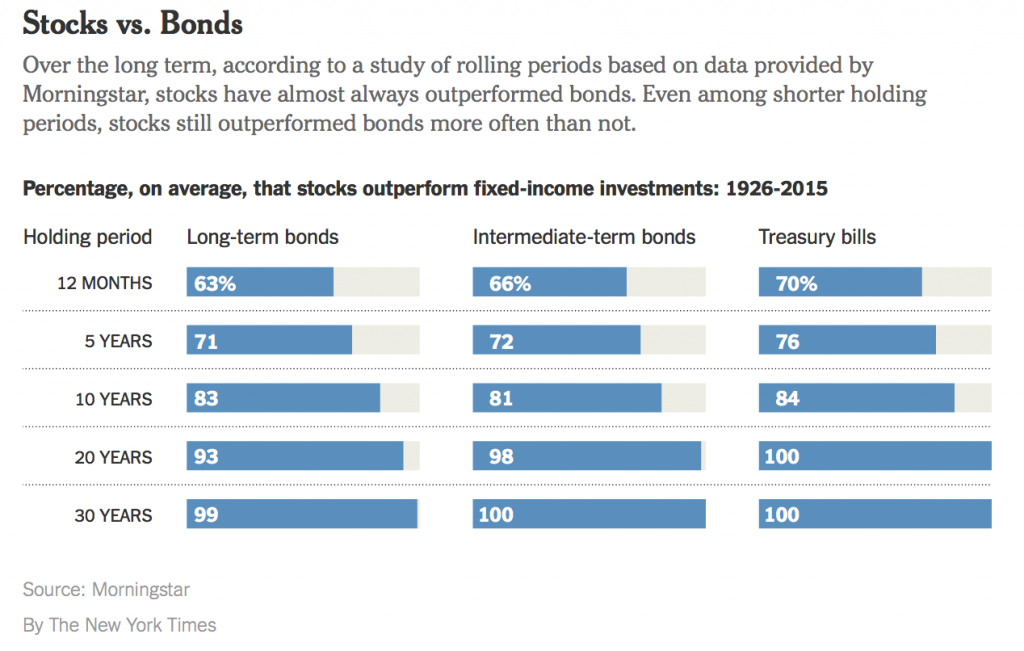
                  In 63% of the years the stocks rates of return have exceeded the long-term bonds. These percentages rise to 71% in periods of 5 years, 83% in 10 years, 93% in 20 years and 99% in 30 years.

                  That’s why we say that stocks are unbeatable in the medium and long term. Increasing the timeframe of investments reduces the risk, both for stocks or bonds but more for the former.

                  #3: Because we have medium-and long-term goals that are not achieved otherwise (with bonds, and even less with deposits and savings accounts)

                  What are our key financial goals?

                  The answer to this question is fundamental because the goals, such as needs, interests or aspirations, are the reason and motivation we don’t spend, save and invest for the future.

                  Gallup conducts an annual survey in the U.S. on the major financial concerns of respondents, and the most recent shown the following results:

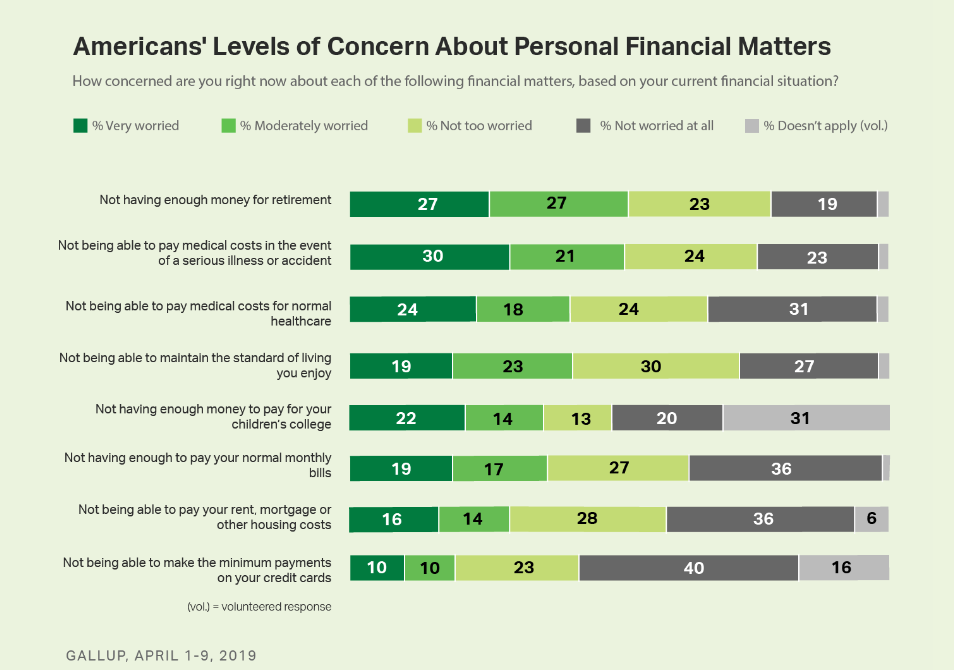
                  We see that at the top of the priorities of concerns arise goals that are divided between the long term, such as the retirement, being able to maintain the standard of living, pay for children’s college, and the medium term, such as, have funds to meet emergencies or unexpected accidents, illness or health care. 

                  These end up having more importance than others which are clearly of short term, like paying monthly bills, paying rent, mortgage or credit cards.

                  What we can conclude is that we have our everyday life reasonably controlled, but not what it goes beyond that, and that’s what concerns us. So, these should be the primary financial investment goals.

                  However, often we have most of our wealth held in cash or liquid assets, which yield little or almost nothing, and we invest a small piece of it in financial assets, with much higher returns.

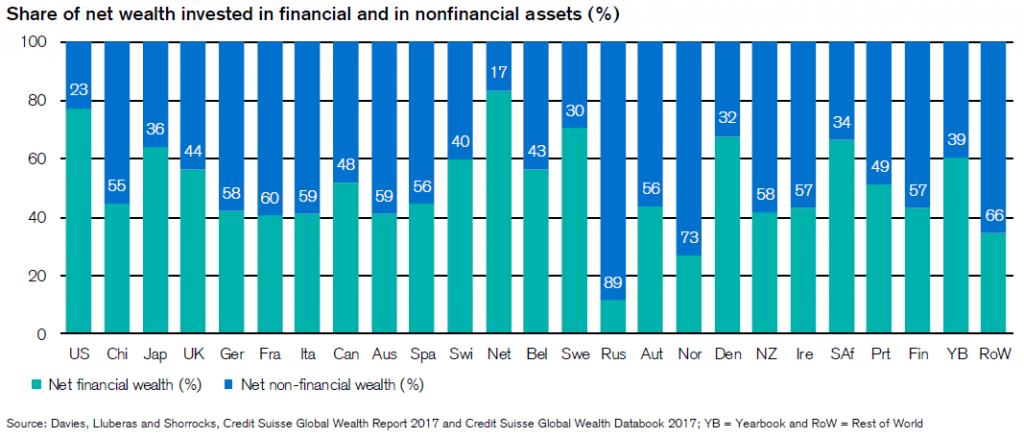
                  In most countries household wealth is invested in non-financial assets, especially in housing. This investment does not yield!

                  Investment in financial assets only prevails in countries such as the USA, Japan, the Netherlands, Sweden, Denmark and South Africa. In Portugal, wealth is distributed equally between financial and non-financial assets.

                  The following graph shows the composition of the financial assets of households in several countries:

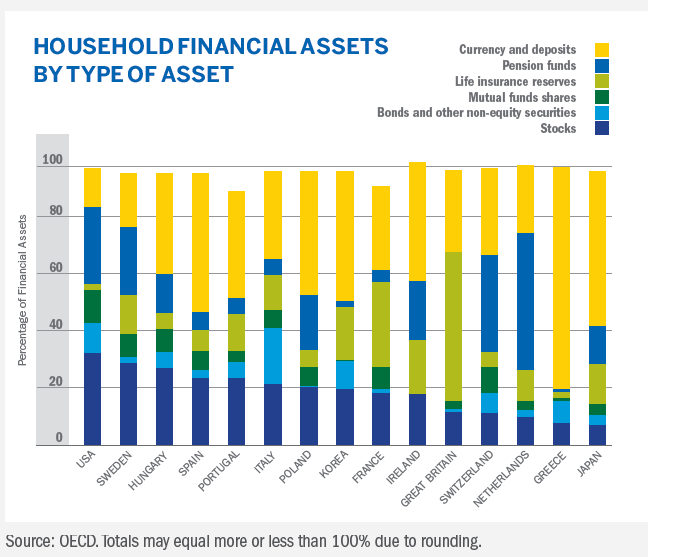
                  Cash and deposits predominate in Portugal, Spain, Ireland, Greece, Japan and some countries of Eastern Europe. Financial assets such as stocks and bonds, held directly or through investment funds, pension plans or insurance futures, have a large weight in the US, Sweden, Italy, Switzerland and the Netherlands.

                  #4 savings: Because diversification of investments between stocks and bonds allows us to balance the return and risk, and adjust them to our personal profile

                  Diversification with stocks and bonds allows us to fine tune the levels of return and risk adjusted to our situation and financial goals

                  Diversification by asset classes is made by combining investments in stocks and bonds, determining the levels of return and risk that we want, and enable us to optimize and improve the efficiency of the investment portfolio.

                  The following graph shows the average annual nominal and real (inflation deducted) rates of return and risk (assessed by 5% worst and best annual outcomes) provided by different combinations of investments in stocks and bonds during the period 1926 to 2015:

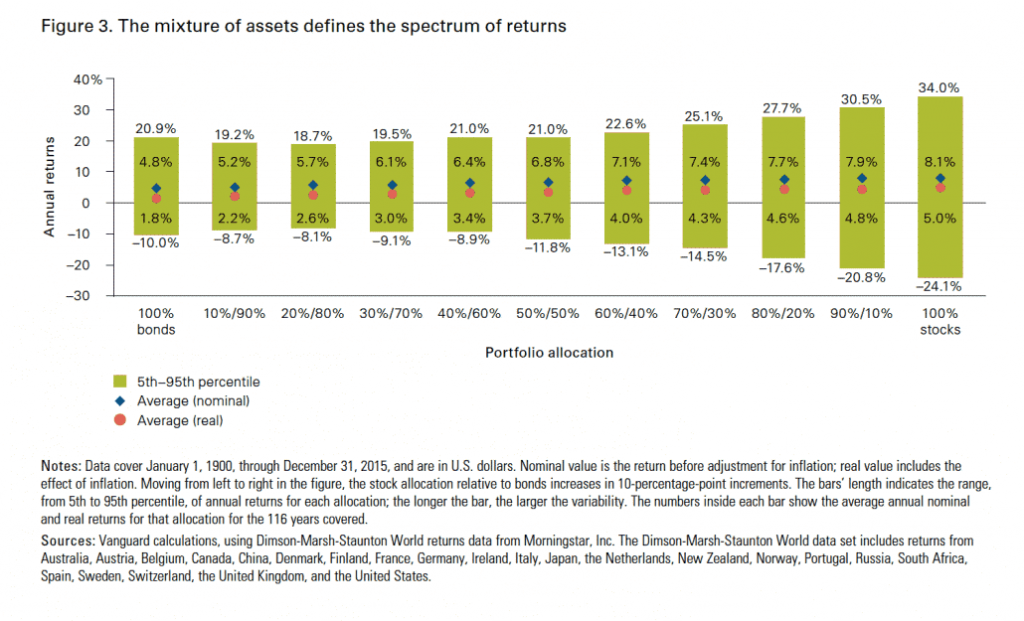
                  If 100% was invested in Treasury bonds, the average real annual return had been 1.8% and the result ranged from -10% and + 20.9%. In the opposite cash of 100% investment in stocks of large companies, the average real annual rate of return was 5% and the yields ranged from-24.1% and + 34%. In the middle, the 50/50 in stocks and bonds, the average annual real rate of return was 3.7% and the intervals range between -11.8% and +21%.

                  Because time length improves the return/risk trade-off, we must take into account the term of the investments in the decision of the financial assets mix.

                  As the increase of the investment period reduces the risk, asset management professionals use rules for diversification of investments that depend on the age of the investor

                  A commonly used rule followed by individuals and professionals of wealth management, is one that links the investor’s age to his asset allocation.

                  The following graph shows the rule recommended by Blackrock, one of the largest asset managers in the world, to people from the 20 to the more than 70 years of age:

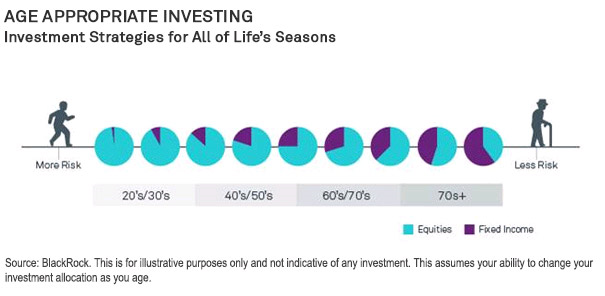
                  At the beginning of our active life we have a very long time ahead of us, and we should have an allocation almost entirely made up of stocks of large companies.

                  As we get old, we should moderate this allocation, introducing a bond component with increasing relevance.

                  When we reach the age of 70 years old, the largest allocation should be made in bonds.

                  The same professionals also use similar rules on the basis of the date targeted for the purpose of investment, in particular, to retirement date

                  The following graph shows how the Vanguard, one of the largest asset managers in the world, makes stocks and obligations allocations for the particular case of their retirement target portfolios that have 65 years old as the official date:

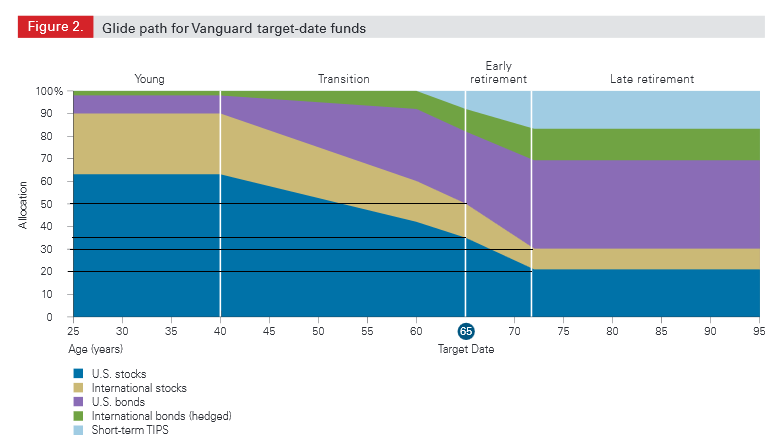
                  Between 20 and 40 years of age, we should invest 90% of our retirement fund in stocks, leaving only 10% for bonds.

                  From 40 years up to 60 we are decreasing gradually the allocation of stocks to 60%, and then up to 70 years of age, more sharply to the 30%, in order to mitigate the risk of stocks when the accumulated capital should be to your peak.

                  From that age onwards the allocation should stabilize at that level.

                  #5: Because we cannot ignore the wealth growth coming from the returns and capital appreciation of the investment in stocks

                  As we saw previously, stocks are the only asset that provides a strong wealth building in the medium and long term.

                  The following graph shows the accumulated capital, in nominal and real terms, resulting from an investment of 100.000 in different proportions of stocks and bonds for a period of 50 years, with reference to the historical rates of return (9.6% and 4.9% in nominal terms, and 6.5% and 2.0% in real terms):

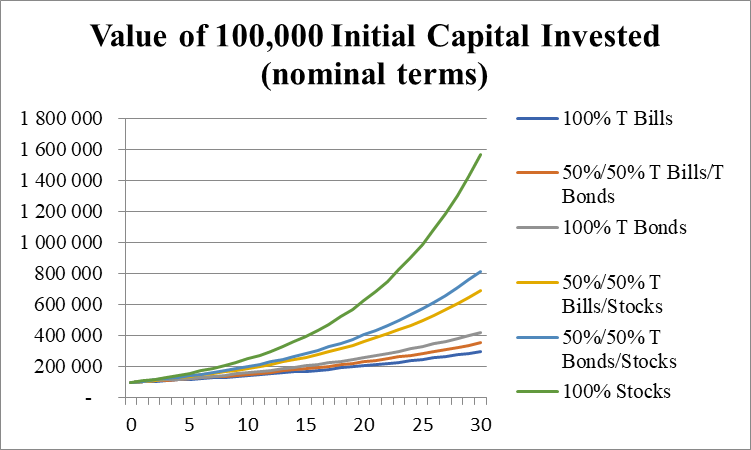
                  The investment of a capital of 100,000 at historically assets rates of return would result in capital of 297,000, 420,000 and 1,564,000 if invested in Treasury bills (returns equivalent to deposits), 10-year Treasury bonds or stocks of large U.S. companies, respectively. We see that even a mix of 50/50 Treasury bills and stocks results in a capital of 690,000 that is much higher than the one of 100% in bonds. The 50/50 mix of bonds and shares results in a capital of 816,000, double the investment in bonds alone.

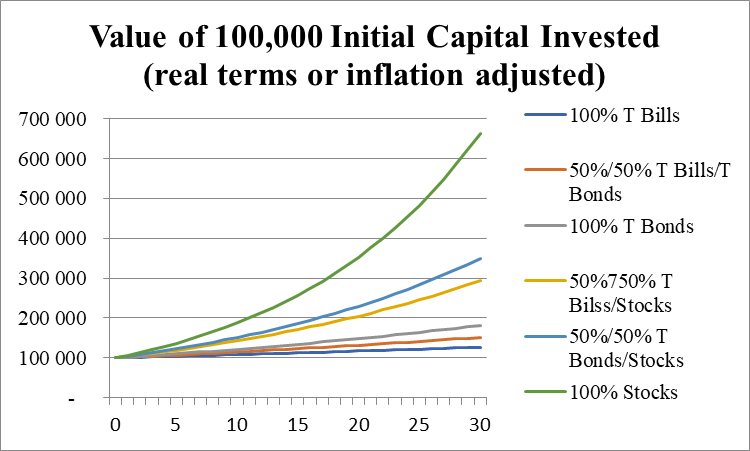
                  In real terms or adjusted for inflation, that same investment of a capital of 100,000 at historically assets rates of return would result in capital of 127,000, 181,000 and 661,000 if invested in Treasury bills (returns equivalent to deposits), 10-year Treasury bonds or stocks of large American companies, respectively.

                  We see that even a mix of 50/50 Treasury bills and stocks results in a capital of 293,000, which is almost double that of 100% in bonds. The 50/50 mix of bonds and shares results in a capital of 348,000.

                  Stocks are clearly the financial asset with the highest returns and the only one that provides significant wealth growth in real terms.

                  Their main advantage is the ability and the potential for wealth building, which allows us to achieve more financial goals.

                  They are very useful when we have investment time horizons over 2 or 3 years, becoming unbeatable in horizons more than 10 or 20 years, through the mitigation of risk by time.

                  They are the energy, youth and vitality of our financial net worth.

                  They must accompany us all life long, almost 100% at the beginning, and 30% in old age.

                  To ignore the investment in stocks is to waste a significant part of our financial life, as not investing in more profitable terms must also be seen as a loss.

                  Previous Post

                  Why invest in bonds?

                  Next Post

                  Families in the richest countries invest more, accentuating inequalities

                  Investadmin

                  Investadmin

                  Related Posts

                  Choosing Mutual Funds Series: Part 7 – The Largest Fund Management Companies
                  Investing Series Guide

                  Choosing Mutual Funds Series: Part 7 – The Largest Fund Management Companies

                  22 de May, 2023
                  Maximizing the time invested in the stock market instead of choosing the times to invest: Part 3 – The market cycles and the mean reversion
                  Investing Series Guide

                  Maximizing the time invested in the stock market instead of choosing the times to invest: Part 3 – The market cycles and the mean reversion

                  14 de April, 2023
                  Choose P4 Mutual funds series – Evaluate and use the benchmarks and ratings of funds
                  Investing Series Guide

                  Choose P4 Mutual funds series – Evaluate and use the benchmarks and ratings of funds

                  27 de March, 2023
                  Simple Portfolios (DIY) Series Part 3: The traditional 60/40 Portfolio, the pros and cons, and how to execute it
                  Investing Series Guide

                  Simple Portfolios (DIY) Series Part 3: The traditional 60/40 Portfolio, the pros and cons, and how to execute it

                  27 de March, 2023
                  Investing in Secular Stocks Series: Part 4.1 – The 3 Valuation Methods and Fundamental Analysis
                  Investing Series Guide

                  Investing in Secular Stocks Series: Part 4.1 – The 3 Valuation Methods and Fundamental Analysis

                  27 de March, 2023
                  Simple Portfolio Series (DIY) Part 2: The Traditional Portfolio 60/40, what it is, for whom, and its performance
                  Investing Series Guide

                  Simple Portfolio Series (DIY) Part 2: The Traditional Portfolio 60/40, what it is, for whom, and its performance

                  28 de January, 2023
                  Next Post

                  Families in the richest countries invest more, accentuating inequalities

                  Leave a Reply

                  Your email address will not be published. Required fields are marked *

                  Trending

                  Financial Markets Outlook 2024: US and Japanese stocks gains, and 10-year US bond yields below 4%

                  Financial Markets Outlook 2024: US and Japanese stocks gains, and 10-year US bond yields below 4%

                  27 de November, 2023
                  Financial Markets Outlook 2024 from the world’s largest investment banks: Disparity in forecasts for U.S. economic growth results in projections for the S&P 500 between 4,500 and 5,000 points, with interest rates on 10-year U.S. bonds below 4%

                  Financial Markets Outlook 2024 from the world’s largest investment banks: Disparity in forecasts for U.S. economic growth results in projections for the S&P 500 between 4,500 and 5,000 points, with interest rates on 10-year U.S. bonds below 4%

                  27 de November, 2023
                  Investing in Large, Medium or Small Caps: Part 4 – The Valuation of Equity Capitalization Classes

                  Investing in Large, Medium or Small Caps: Part 4 – The Valuation of Equity Capitalization Classes

                  27 de November, 2023
                  Investing in Small, Medium or Large Caps: Part 3 – The market cycles of stocks capitalization segments

                  Investing in Small, Medium or Large Caps: Part 3 – The market cycles of stocks capitalization segments

                  14 de November, 2023
                  Investorpolis

                  We developed this blog because we believe that only a small learning effort is needed to make a big change in the decisions and results of our investments and financial assets.

                  Main categories

                  • Investing Series Guide
                  • Wealth and Investing
                  • Retirement & Savings
                  • Tools
                  • More

                  Newsletter

                  Sign to our mailing list to receive updates direct to your inbox!

                  *We don’t spam

                  • Privacy Policy
                  • Cookie Policy
                  • Contacts

                  © 2021 - Investorpolis / Powered by Delta Soluções

                  • pt-pt Português
                  • fr Français
                  • es Español
                  • en English
                  • Home
                  • Investing Series Guide
                    • I. Goal Based Investing
                    • II. Compounding & Inflation
                    • III. Assets Risks & Returns
                    • IV. Efficient Diversification
                    • IX. Sustainable Investing and ESG
                    • V. The Investor
                    • VI. Assets and Investments
                    • VII. Index Funds
                    • VIII. Successful Investing
                    • X. Kits and Tips
                    • XI. Other Topics
                  • Retirement & Savings
                    • Retirement
                    • Savings
                  • Wealth and Investing
                    • Investing
                    • Wealth
                  • Tools
                    • Calculators
                    • Publications
                    • Sites and apps
                  • More
                    • Best of
                    • Reviews
                    • Snapshots
                    • Others
                  • About us
                    • Who we are
                    • Mission
                  • Login
                  • Cart

                  © 2021 - Investorpolis / Powered by Delta Soluções

                  Welcome Back!

                  Login to your account below

                  Forgotten Password?

                  Retrieve your password

                  Please enter your username or email address to reset your password.

                  Log In
                  We use cookies on our website to give you the most relevant experience by remembering your preferences and repeat visits. By clicking “Accept All”, you consent to the use of ALL the cookies. However, you may visit "Cookie Settings" to provide a controlled consent.
                  Cookie configurationCookie PolicyAcceptReject
                  Manage consent

                  Privacy Overview

                  This website uses cookies to improve your experience while you navigate through the website. Out of these, the cookies that are categorized as necessary are stored on your browser as they are essential for the working of basic functionalities of the website. We also use third-party cookies that help us analyze and understand how you use this website. These cookies will be stored in your browser only with your consent. You also have the option to opt-out of these cookies. But opting out of some of these cookies may affect your browsing experience.
                  Advertisement
                  Advertisement cookies are used to provide visitors with relevant ads and marketing campaigns. These cookies track visitors across websites and collect information to provide customized ads.
                  Analytics
                  Analytical cookies are used to understand how visitors interact with the website. These cookies help provide information on metrics the number of visitors, bounce rate, traffic source, etc.
                  Functional
                  Functional cookies help to perform certain functionalities like sharing the content of the website on social media platforms, collect feedbacks, and other third-party features.
                  Necessary
                  Necessary cookies are absolutely essential for the website to function properly. These cookies ensure basic functionalities and security features of the website, anonymously.
                  Others
                  Other uncategorized cookies are those that are being analyzed and have not been classified into a category as yet.
                  Performance
                  Performance cookies are used to understand and analyze the key performance indexes of the website which helps in delivering a better user experience for the visitors.
                  SAVE & ACCEPT

                  Add New Playlist

                  Are you sure want to unlock this post?
                  Unlock left : 0
                  Are you sure want to cancel subscription?