The valuation of the capitalization classes of stocks
The factors that most influence stocks performance cycles by capitalization are economic growth, interest rates, and overall market risks
This is the fourth article on investing in subclasses of capitalization of company shares.
In the first one, we saw that, contrary to what many people think, small and mid-cap stocks have provided the highest returns in the very long term.
In the second article, we analyzed the differentiated characteristics of each subclass or capitalization segments and the advantages and disadvantages of investing in each strategy or market segment.
In the third article, we analyzed the differentiated behavior of the equity market capitalization segments throughout the various economic cycles.
In this article, we will discuss the fluctuation bands and the determining factors of the valuation of equity capitalization segments.
In the Tools folder we have developed in detail some of the main indices of the world stock markets with the largest market capitalizations, namely the MSCI ACWI for the world market, the Dow Jones IA 30, S&P 500 and the Nasdaq in the US, and in Europe, the Eurostoxx 50 and the FTSE 100).
We also include the Russell 2000 index of U.S. small and mid-caps.
The valuation of the capitalization classes of stocks
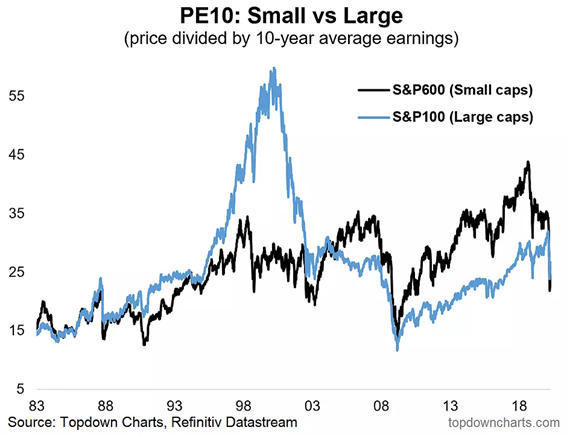
The following chart shows the evolution of the Schiller PER of US large-cap (S&P 100) and small-cap (S&P 600) stocks between 1983 and 2018:

Between 1983 and 1992, the PER of the two capitalization segments had the same values, between 15x and 25x, but from 1993 onwards the ratio of small caps skyrocketed and reached 55x in the technology bubble (versus 35x in large caps).
Between 2001 and 2007 the two ratios stabilized at around 25x to 30x, having fallen to almost 10x at the lows of the subprime crisis.
Since 2009, the leadership has shifted, with large caps (between 25x and 35x) having higher PERs than small caps until the pandemic in 2020 (15x to 25x).
The Schiller PER (CAPE), or adjusted to the economic cycle based on the normalization of results using the average of the last 10 years, is more useful because by doing this smoothing it makes the analysis more robust due to the greater volatility of the results of small caps.
However, it has the disadvantage of being a less available indicator, and therefore less used than the traditional PER.
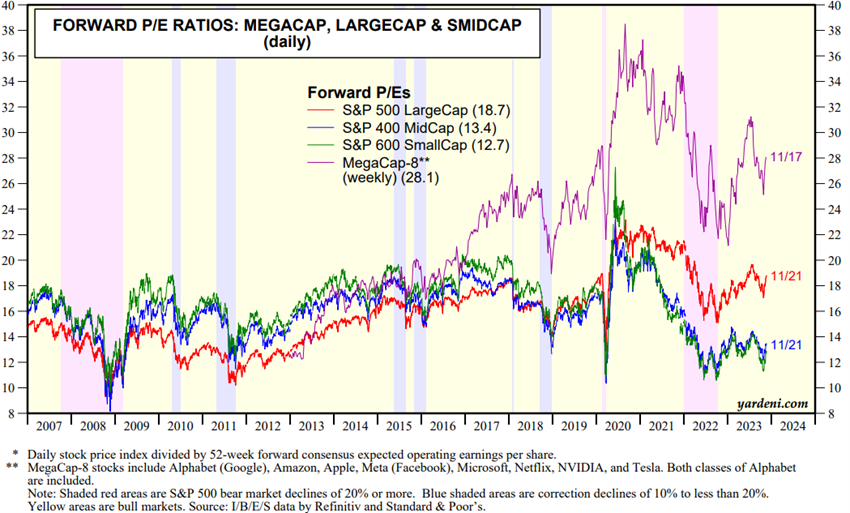
The following chart compares the evolution of the traditional forward PER for small, medium, large, and even mega-cap S&P indices since 2007 (the 8 largest companies):

In the initial period, small and mid-caps quoted the PER higher by about +2x to +3x than large caps (16x versus 14x on average), but from 2015 onwards the situation was reversed, mainly due to the effect of the very high PER of mega-caps.
Today, large caps (S&P 500) have a PER of 18.6x, while the PER of small caps (S&P 600 SmallCap) is 12.7x and that of mid-caps (S&P 400 MidCap) is 13.4x, while that of 8 MegaCaps is 27.6x).
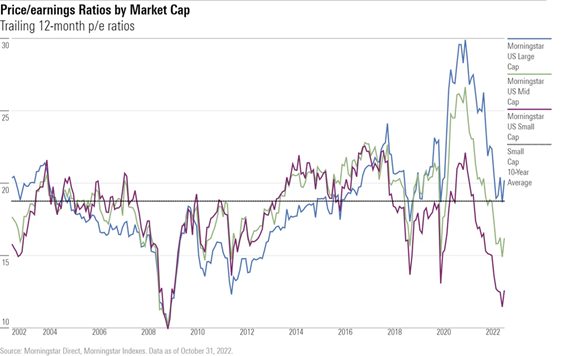
We can draw the same conclusion about the PER behaviors of the different capitalizations by using the Morningstar indices instead of the S&P:

What these two graphs above also show is that there is currently a large PER discrepancy unfavorable to small and mid-caps.
This discrepancy becomes even clearer when we use a longer story, albeit with different action universes.
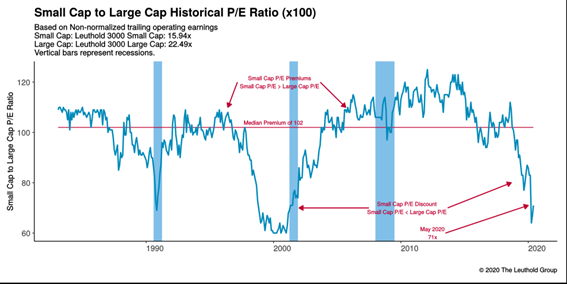
Leuthold tracks about 3000 U.S. stocks and aggregates them into the “small caps” and “large caps” subclasses.
The evolution of the ratio of PER multiples of small-cap and large-cap stocks in the US since 1979 has been as follows:

During this period, the median PER premium was 102 in favour of small caps.
In May 2020, the average PER for small caps was 16x and that of large caps was 22.5x, a discount of around 71% for small caps that already came from 2018 and was greatly aggravated by the pandemic.
The performance gap between small caps and large caps has been widening to historic lows, a trend seen in times of economic stress and investor caution, possibly signaling that the economy could worsen.
At this stage, large-caps are delivering much better earnings growth than small-caps.
The factors that most influence stocks performance cycles by capitalization are economic growth, interest rates, and overall market risks
When small- and mid-cap stocks start underperforming large stocks of this magnitude, it usually also means that investors are worried.
In this situation, investors focus on large companies that are easy to trade with and discard smaller companies generally considered riskier, especially if they believe there could be a recession.
This is due to the fact that US small caps are more exposed to the domestic market and are therefore more sensitive to changes in economic growth.
Investors also prefer large-caps in times of economic uncertainty because small-caps have more debt.
Small caps have worse debt-to-equity and net debt-to-EBITDA ratios, and are more sensitive to interest rates.


