Market cycles and valuations of company capitalization classes
This is the third article on investing in subclasses of capitalization of company shares.
In the first one, we saw that, contrary to what many people think, small and mid-cap stocks have provided the highest returns in the very long term.
In the second article, we analyzed the different characteristics of each subclass and the advantages and disadvantages of investing in each strategy or market segment.
However, these two segments of the stock market also behave differently depending on the economic context or cycles.
Economic cycles have a great influence on the performance of stocks in general, but also of their main segments, so it is important to understand their influence and effects.
This is the initial focus of this article, which then looks at the valuation of these classes of shares.
In the Tools folder, we have developed in detail some of the main indices of the world stock markets of the stocks with the largest market capitalizations, namely the MSCI ACWI for the Worldwide Marketor Dow Jones IA 30, S&P 500 and Nasdaq in the U.S., and Europe, the Eurostoxx 50 and FTSE 100).
We also include the Russell 2000 index of U.S. small and mid-caps.
The market cycles of the various classes of company capitalizations
Contrary to what history shows, many people think that large-cap stocks are the ones that provide the highest rate of return, given the recent history, especially associated with mega-caps.
As we saw earlier, the stocks with the highest annual rate of return over the very long term were small and mid-caps.
However, there are periods when large-cap stocks have better returns than those of small and medium-sized companies, and other periods when the opposite is true.
That is, there are cycles in terms of the performance of the different capitalizations of the companies in the stock market.
Financial markets behave differently throughout economic cycles, with emphasis on the two main assets, stocks and bonds:
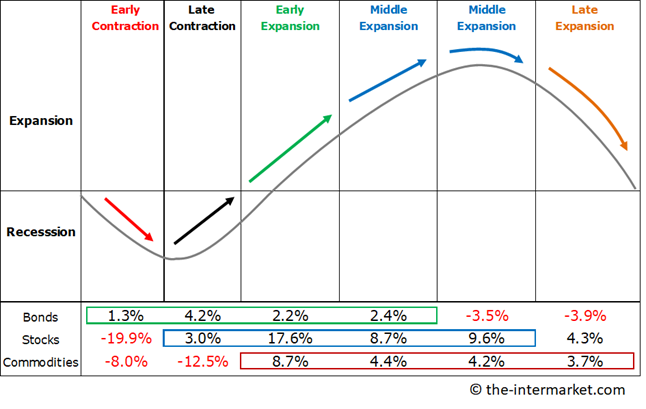
Stocks of different capitalizations also evolve differently in the economic phases of expansion, recession, contraction and recovery, amplifying the movements of stocks in general due to their greater sensitivity.
And the same is also true of the segments or styles of growth and value of companies’ shares.
The values and direction of economic growth, interest rates and inflation are the most influential factors in business cycles.
The following chart shows the ratio of valuation performances of small-cap versus large-cap stocks in the U.S. since 1925, highlighting the cycles of each of these subclasses (defined by a performance level of 35% or higher):
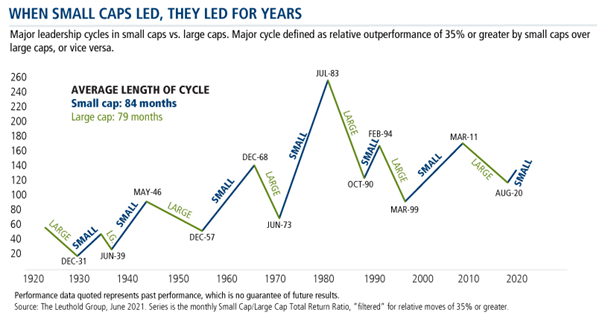
There have been seven periods in which small caps outperformed large caps.
On average, these periods lasted just over 7 years.
The most recent period, between 1999 and 2011, lasted approximately 13 years – almost double the average.
Since 1979, although the overall performance of the Russell 200 and S&P 500 indices has been similar and their correlation generally high – 0.8 on average, ranging from 0.6 to 0.96 on a one-year moving basis – they have sometimes diverged significantly:
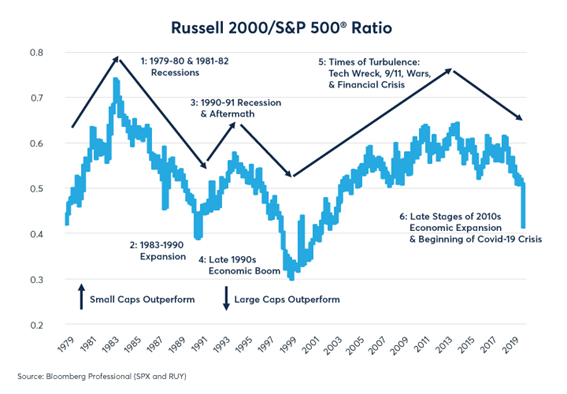
Small caps outperformed large caps during the period of economic turmoil (oil shock 1979-83, 1990-94 and tech bubble and subprime crisis 1999-2014).
Large-cap stocks have done better than small-cap companies typically during economic expansions.
There have been three periods of outperformance by large caps.
Between 1983-90, during the boom of the 1980s, the S&P 500 outperformed the Russell 2000 by 91%.
From 1994-99, during the boom of the 1990s, the S&P 500 outperformed the Russell 2000 by 92 percent.
Finally, between 2013-20, in the final stages of the recovery of the 2010s, the S&P 500 outperformed the Russell 2000 by 29% by the end of December 2019 and then outperformed it by another 20% during the first three months of 2020.
The Russell 2000 has a lower weight of technology stocks than the S&P 500.
More recently, the evolution of the major U.S. capitalization indices has been as follows:
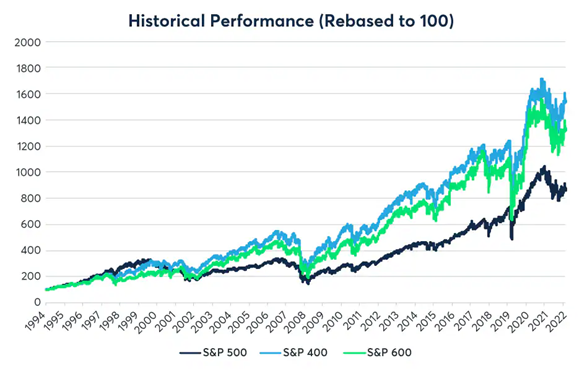
Since 2014, large caps have recovered relative to small caps.
Small-cap stocks have been especially hard hit during the pandemic.
Large caps often outperform in the later stages of bull markets and during strong economic expansions.
At the level of the world market index, given by the MSI All-Country World Index, the cycles of capitalization performance have been as follows in this millennium:
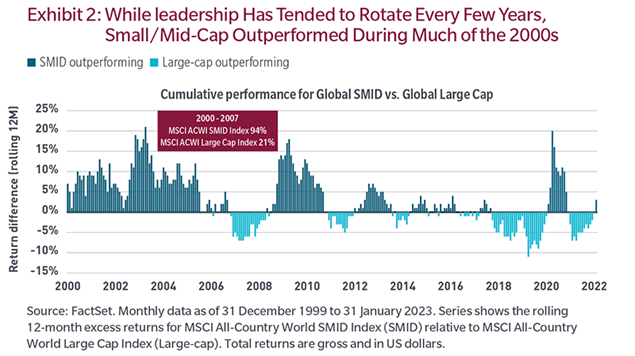
Between 2000 and 2007, small and mid-caps had a cumulative appreciation of 94% against 21% for large caps, followed by the two years of the subprime crisis in which large caps were better.
Between 2009 and 2018, small-caps did better again, except for brief periods.
Since 2018, large-caps have seen better valuations overall.


