What is a negative stock market cycle or a bear market?
The problem is that negative cycles or bear markets arise with a lot of intensity and severity causing sharp falls and losses: From 1870 to our days there have been 15 crises in the US stock market
All investors fear the arrival of equity market crises, so it is worth analysing and getting to know them. Because it is necessary to know if we can recognize them and how we should act.
What is a negative stock market cycle or a bear market?
The definition most often used to identify the deep negative cycles of the stock market, or bear markets is when the market depreciates more than 20% since its peak level. Falls between 10% and 20% are considered technical corrections. Although these numbers have some arbitrariness, they have the advantage of being objective.
Another definition of a bear market is when investors become too risk averse. As we know, most investors are naturally risk-averse, requiring compensation or a premium to incur it. However, there are times when this aversion becomes excessive, and investors do not support devaluations, retract, and sell, often in panic and usually at an advanced stage of the fall and therefore at a very low level. A market crisis, in which investors move away from the market, can take many months and even a few years.
We will look at the negative cycles of the US stock market because it is the largest equity market in the world, currently representing about more than 65%, the most developed and the one for which we have the most reliable historical data.
Putting the stock market cycles in perspective: the positive cycles, ascending or bull markets are the normal state of the markets, and the negative cycles, of falling or bear markets the exceptions
Before we go directly into market crises it is good to put in perspectives all market cycles, expansion and crises.
The following graph shows the occurrence of these cycles between 1956 and 2017:
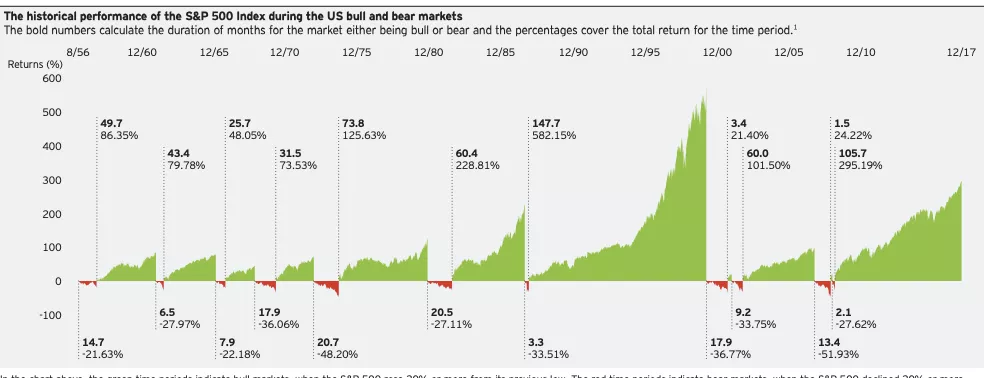
In these 60 years there have been 9 positive cycles and as many negative cycles.
Three aspects clearly jump into sight:
- We spend much more time in expansion cycles or bull markets than in negative cycles or bear markets (which should not come as a surprise because we know that average returns are about 10% per year in historical terms (from 1926 to today).
- The different duration of cycles that are much longer in positive cycles than in negative cycles. While those last for several years, the latter last for months or up to 3 years at most.
- Obviously linked to the previous point, the different accumulated performance of the cycles, as the positive cycles have cumulative appreciations of more than 70% and some of several hundred percentage points, while the negative cycles rarely exceed -40% or -50%.
This means that negative cycles are much shorter and more intense when compared to positive cycles.
The following graph translates this reality with more evidence:
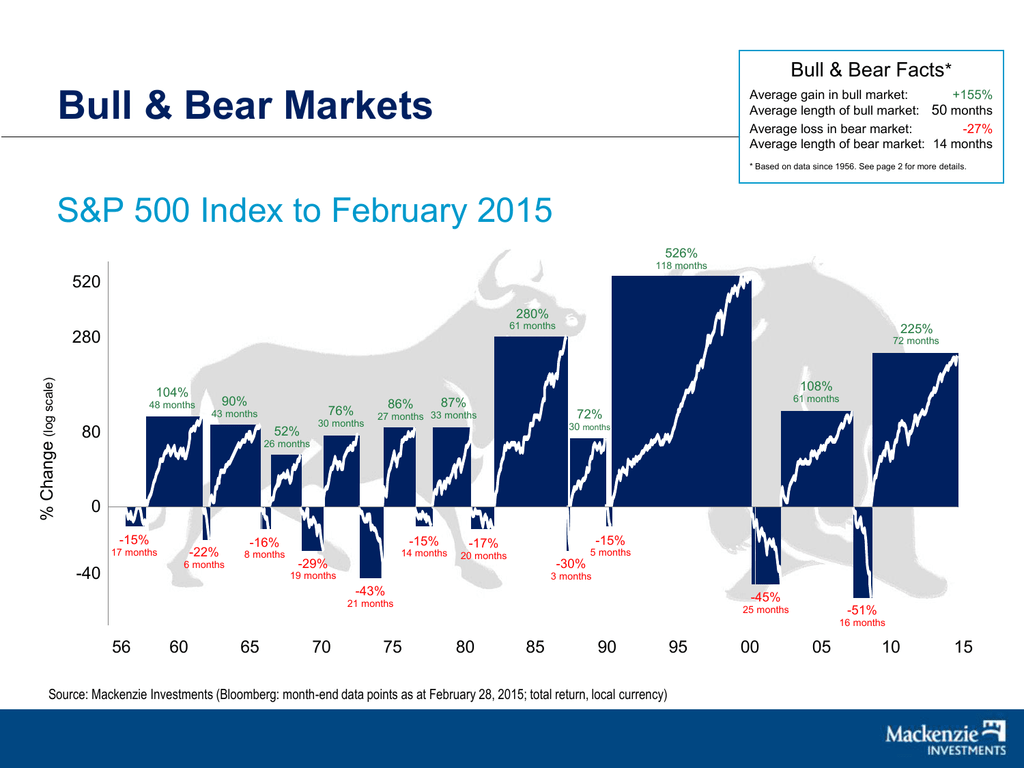
Positive cycles (bull markets) have an average duration of 50 months rising by 155% in average terms, while negative cycles (bear markets) only last 14 months on average and record average losses of 29%.
Put another way, we typically live in expanding and occasionally in contraction markets.
The bull market is almost always active and present, emerging the bear market after long periods and hibernation.
In conclusion, the normal state of the markets is expansion or bull market, but negative cycles, crises or bear markets are more intense and severe.
The problem is that negative cycles or bear markets arise with a lot of intensity and severity causing sharp falls and losses: From 1870 to our days there have been 15 crises in the US stock market
In the following chart, we can see the evolution of the US stock market since 19870, pointing out the bear markets in red:
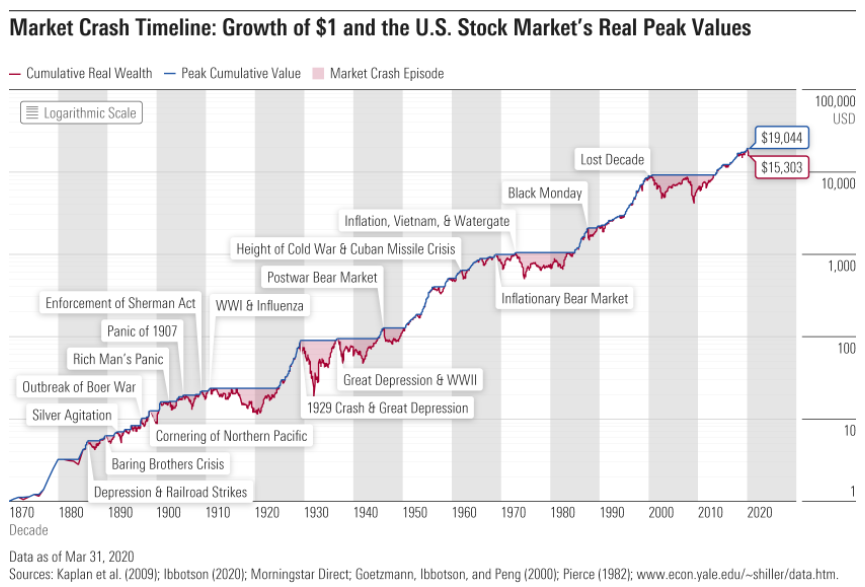
It should be stressed that this chart uses the logarithmic scale for easy reading, which means that each interval corresponds to a doubling of the values.
It is clear once again the very interesting profitability of investment in the equity market. The growth of the capital invested in stocks is significant and has no match in the main asset classes. It is not a linear line, because there are great advances and setbacks, but a constant line can be drawn over time that will translate the 10% nominal annual returns and the 6.5% real annual returns (or purchasing power terms).
In the following table, 14 of the 15 main crises since 1926 (lack of the March 2020 pandemic) are identified, ordered by their degree of severity or by the percentage variation of the interval between the previous market peak and the bottom levels reached:
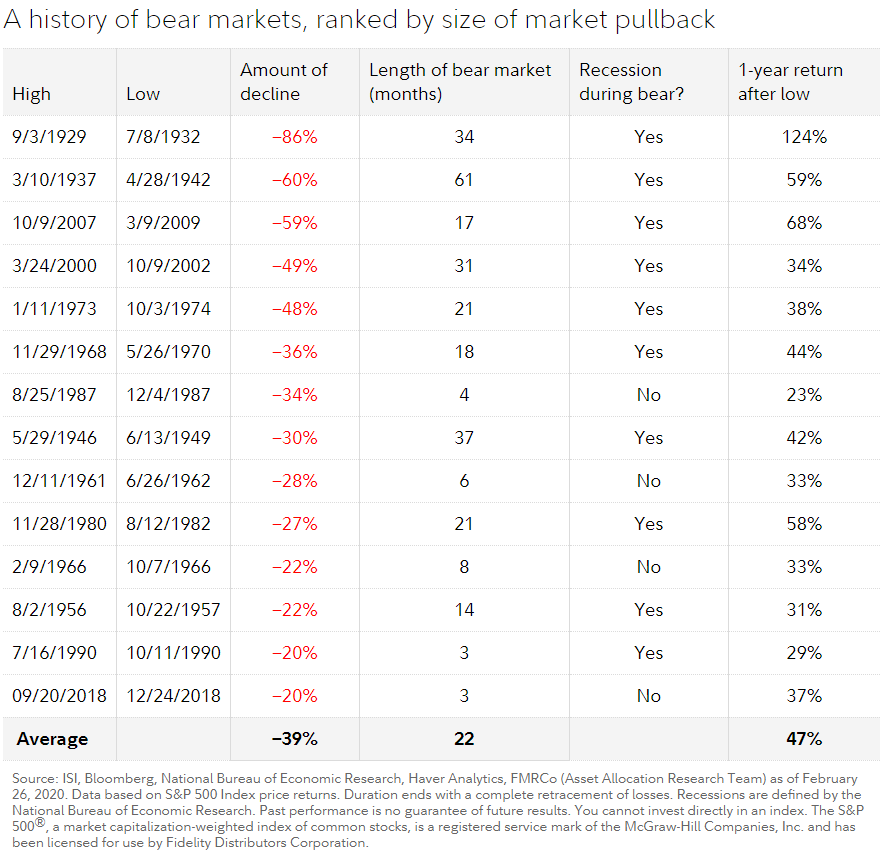
Chronologically, we have (1) the Great Depression of 1929-32, (2) the beginnings of World War II of 1937-42, (3) the post-war recession of 1946-49, (4) the Cuban crisis of 1956-57, (5) the inflationary crisis of 1961-62, (6) the Vietnam War of 1968-1970, (7) the 1st oil crisis of 1973-74, (8) the 2nd oil crisis of 1980-82 , (9) the credit crisis of 1966 (10) to Black Monday 1987, (11) the mini crisis of 1990, (12) the technological bubble of 2000-02, (13) the Great Financial Crisis of 2007-09, (14) the mini crisis of 2018 (15) and, unmarked, that of the Covid-19 pandemic from March to May of 2020.
We see that the declines varied between 20% and 86%. There were 8 major crises, with falls of more than 30%, highlighting by its severity the Great Depression with a devaluation of -86%, World War II with -60%, the Great Financial Crisis with -59%, the technological bubble with -49%, the 1st oil crisis with -48%, the Vietnam war with -36%, the Black Monday with -34% and the post-war with -30%.
The duration of crises varies widely between the 3 months of the pandemic crisis and the 61 months of the World War II crisis.
Of the 14 crises, 10 were accompanied by economic recessions. The four exceptions are the Black Monday 1987, the inflationary crisis of 1961-62, the Vietnam war of 1967-68, and the 2018 crisis.
It is important to note that:
- Recessions make crises deeper and longer.
- Exceptions are usually mini-crisis, less severe and especially with shorter duration and faster recovery.
We can also see that in general and as you would expect, the deeper the crisis the longer the recovery time.
Finally, it can also be concluded that the more severe the crisis, the more pronounced the recovery in the first year after inflection. Profitability in the first year of the post-crisis period is higher in cases where falls have been more pronounced.
Another conclusion we can draw is that markets recover much of the losses in the first year (note: remember that sometimes mathematics is treacherous, because a loss of -50% or half is only fully recovered with a subsequent gain of +100% or double).
The following graph shows the recovery time of crises, measured in years, and adjusted in terms of dividends and inflation, between 1906 and 2017:
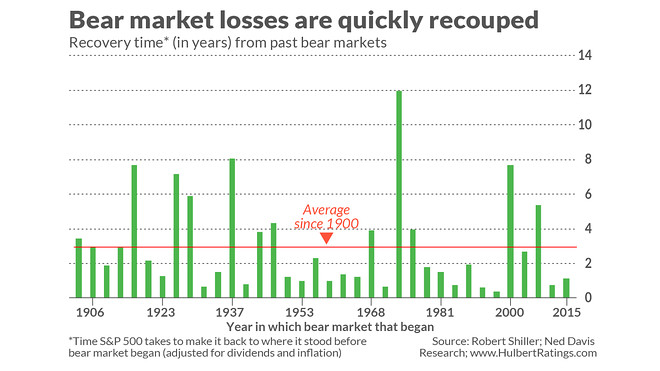
Usually and as we have seen, recovery from crises are rapid. The average recovery time is 3 years. The longest recovery time occurred in the Great Depression, which was 12 years if we joined its phases, that of the 10-year technology bubble also accounting for its two phases and the first oil shock of 8 years 1973-74 due to the weak growth that followed.
Since World War to 2017, the bear markets history was as follows:
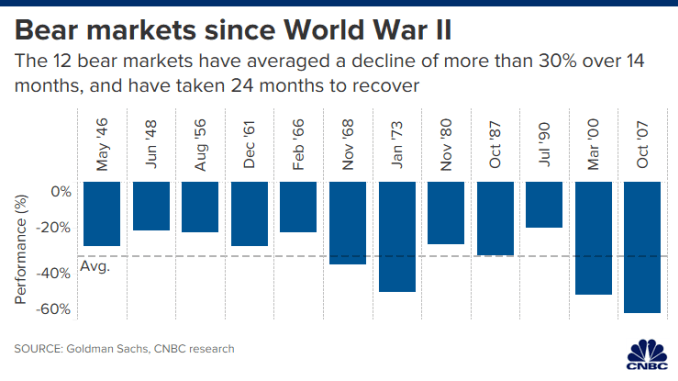
The 12 negative cycles took an average of 14 months to record 30% average falls and took 34 months on average to recover from the minimum levels.
We can see the speed of market crises in the following chart measures in terms of the number of days to reach 30% of losses, which covers a period from 1926 to date:
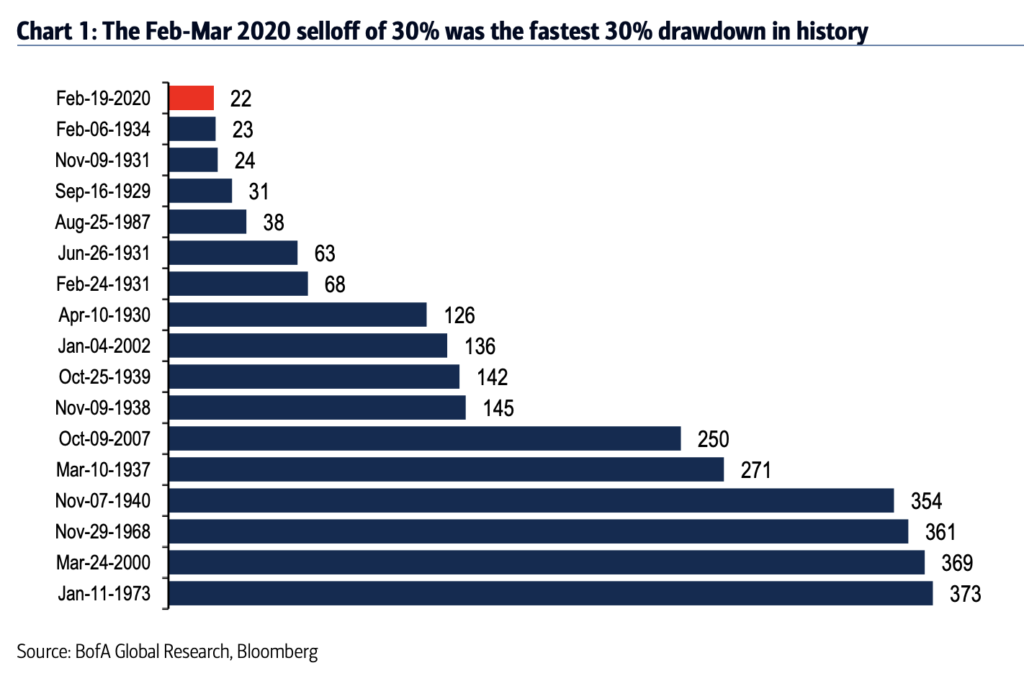
We see that the longest crises lasted about a year to reach the 30% drop, particularly in the first oil crisis, the technology bubble, the Vietnam War and World War II. Crises typically last 4 to 9 months to reach a 30% drop, but there are several abrupt crises, which reach -30% quickly, such as those that emerged intermittently in the Great Depression and the pandemic crisis of March 2020.
The biggest problem is that there have been 3 major market crises that took more than 20 years to return to the pre-crisis peak level value in terms of purchasing power
What we have seen before does not seem to justify a great deal of concern about bar markets. However, as we have seen, not all crises are the same and there are some crises that are very pronounced.
The following graph shows the evolution of the profitability of the S&P 500 index in real terms (adjusted for inflation) from 1906 to 2015:
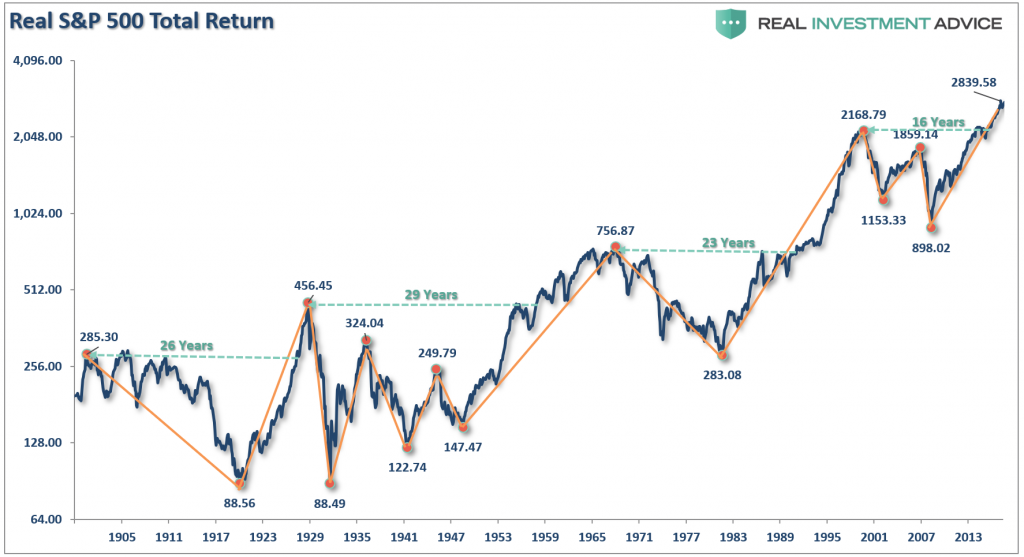
We see that in this period there were 4 very prolonged crises that took decades to return to previous maximum levels in real terms. Those who invested in 1903 only recovered the capital in 1929, that is, 26 years later, those who did so in 1929 had to wait 29 years until 1958, those who invested in 1965 needed 23 years in 1989, and those who did in 2000 only began to earn in 2016, after 16 years.
That is, we have 4 long periods, 3 of them over 20 years.
We should be concerned about these major crises because as we will see if we are unlucky enough to invest at or near the maximum level immediately before one of this the fall starts, it may take us more than 20 years to recover the invested capital in terms of purchasing power.
20 years corresponds to an investment cycle for retirement for many, because only at the age of 40, after the families created, many families begin to have the margin and capacity for large savings.
This is the reason we say that for financial success it is very advantageous to be young investors, or to start investing in the initial phase of so-called secular positive cycles, as well as disadvantageous to do so in the early stages of secular negative cycles.
From the reading of the following chart, which shows the gains and losses of number of points of the S&P 500 index between 1902 and 2017, the impact of major crises is better perceived:
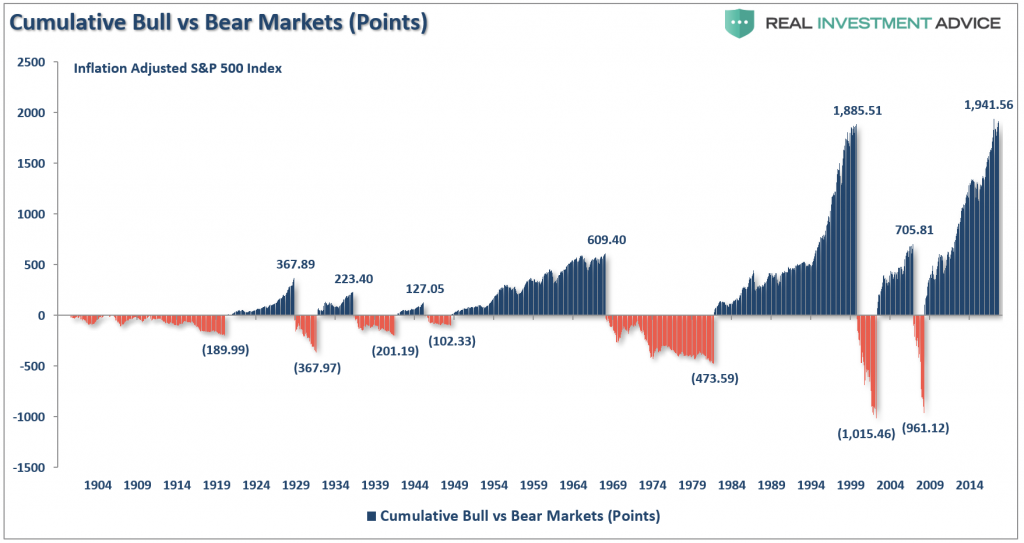
It is easy to conclude that a significant part of the gains in expansion cycles are lost in subsequent negative cycles. We can see them all, but we just need to see the most significant ones. The 367 points achieved between 1919 and 1929 disappear in the Great Depression until 1934, of the 609 points earned from 1945 to 1969, 473 were lost to 1984, of the 1,885 points earned between 1984 and 1999 1,015 points with the technological bubble and the 705 points achieved up to the Great Financial Crisis compared with the 961 points lost in that crisis.
https://www.amazon.com/Stocks-Long-Run-Definitive-Investment/dp/0071800514


