• About us
    • Who we are
    • Mission
  • Contacts
  • English
    • Português (Portuguese (Portugal))
    • Español (Spanish)
    • Français (French)
  • Login
Investorpolis
[xyz-ips snippet="Banners-Publicitarios"]
No Result
View All Result
No Result
View All Result
Investorpolis
No Result
View All Result
Home Investing Series Guide

Investing in index funds: The S&P 500, the main index of stock markets

10 de May, 2020
in Investing Series Guide, VII. Index Funds
Reading Time: 5 mins read
0 0
0
Share on FacebookShare on Twitter

The S&P is the inescapable benchmark of the global stock market and should be part of any investment portfolio

 The S&P 500 Index

 Long and recent year historical performance of the S&P 500 index

The S&P is the inescapable benchmark of the global stock market and should be part of any investment portfolio

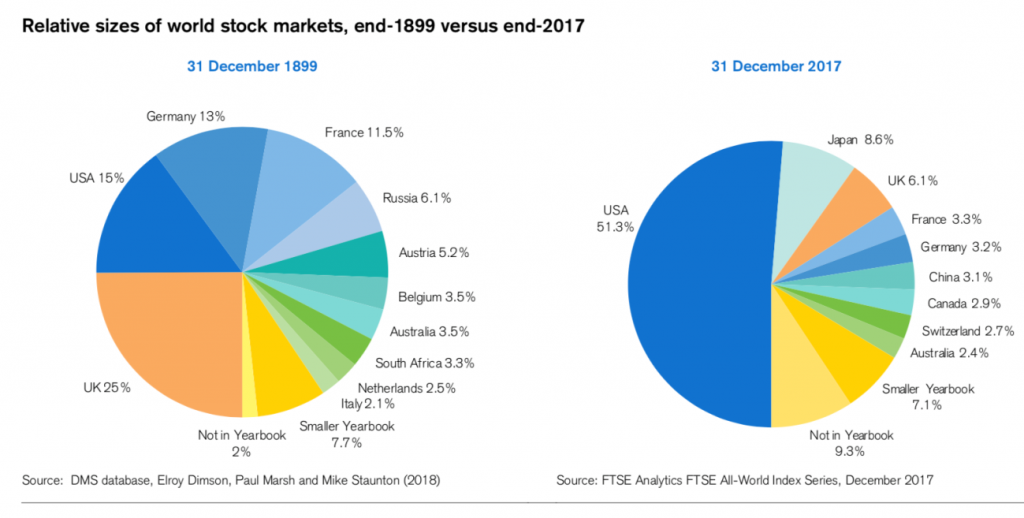
The US accounts for more than 50% of the world’s stock markets:

Imagem relacionada

The S&P 500 (created in 1957) growing importance replaced the original DJIA 30 (Dow Jones Industrial Average) (created in 1896) as the leading US market index.

The S&P 500 is more encompassing, as it is based on a larger sample of total U.S. stocks, and is weighted by market value whereas the Dow Jones is price weighted.

To this extent it is the indispensable reference of the world’s stock markets and must integrate any and all investor investment portfolios, whether institutional or private.

It is the most used, followed and analysed index of the capital markets. Its movement is studied and followed to the smallest detail by all investors, private and institutional, of various natures, because its evolution determines the behaviour of other indices worldwide.

That is why we use this index in many of our articles.

The S&P 500 Index

As of March 2020, it consists of 506 shares of the 500 largest US companies (includes 6 preferred shares), covering a stock capitalization of more than $25 billion, corresponding to 80% of the US global stock market’s stock market capitalization.. 

Apple’s largest capitalization is $1.2 trillion, the average and median capitalization is $43 billion and $17 billion, respectively; the lowest capitalization is $760 million.

To integrate the index, companies must be domiciled in the US, have enough liquidity-capable stocks for buying and selling and be profitable in the previous year (meaning that companies that have had losses are not included in the index even if they have a high value and exceed many of the profitable 500 that integrate it). 

The index is an index weighted by capitalization, that is, movements in stock prices with higher market capitalizations (the stock price times the number of shares in circulation) have a greater impact on the value of the index than companies with lower market capitalization.

The S&P 500 is widely regarded as the best single indicator of US large-cap stocks. 

There are more than USD 9.9 trillion indexed or compared to the index, with indexed assets comprising approximately $3.4 trillion of that total. 

Its sectoral composition is as follows:

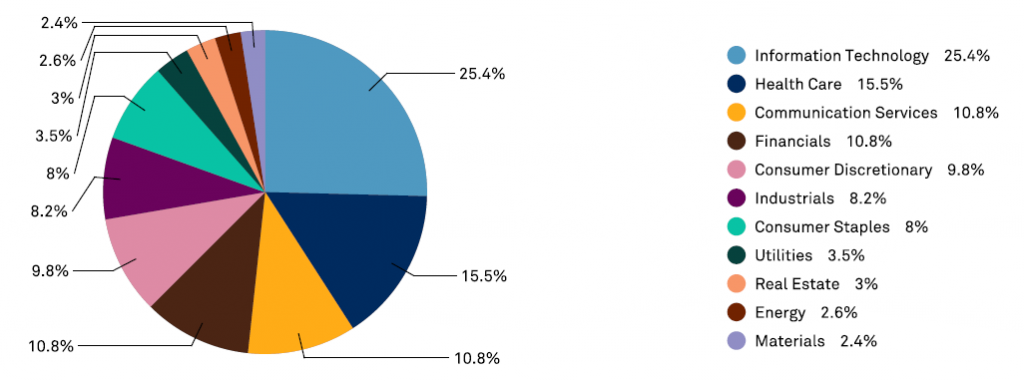
The largest sector is information technology with 25%, followed by health care with 16%, communication services and financial with 11% each, consumer discretionary, industrials and consumer staples with 8%-9% each, and subsequently utilities, real estate, energy and materials.

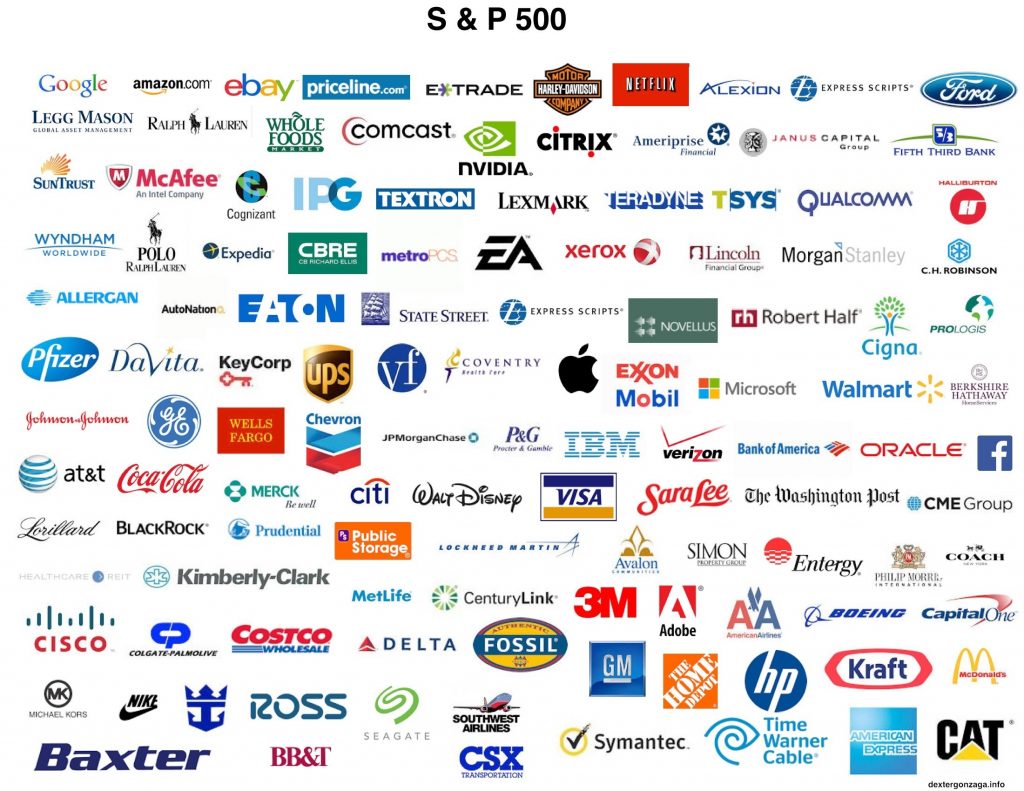
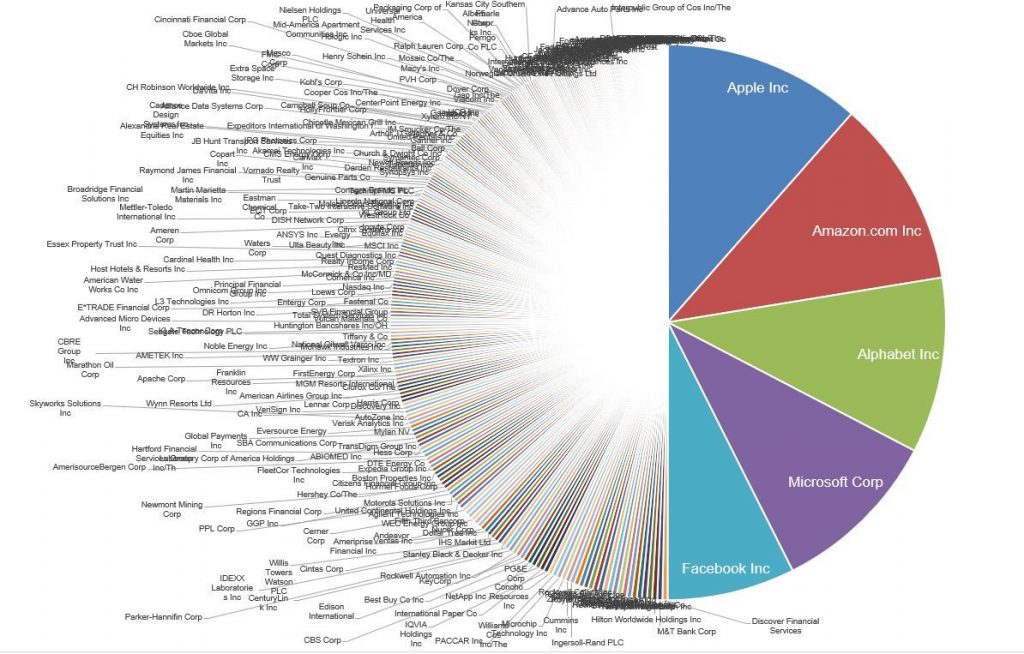
The following chart shows the logos of some of the companies that make up the S&P 500, in which we can recognize many of the world’s largest companies and whose goods we consume and are consumed worldwide.

Its top 10 companies with a 25% combined weight are the following:

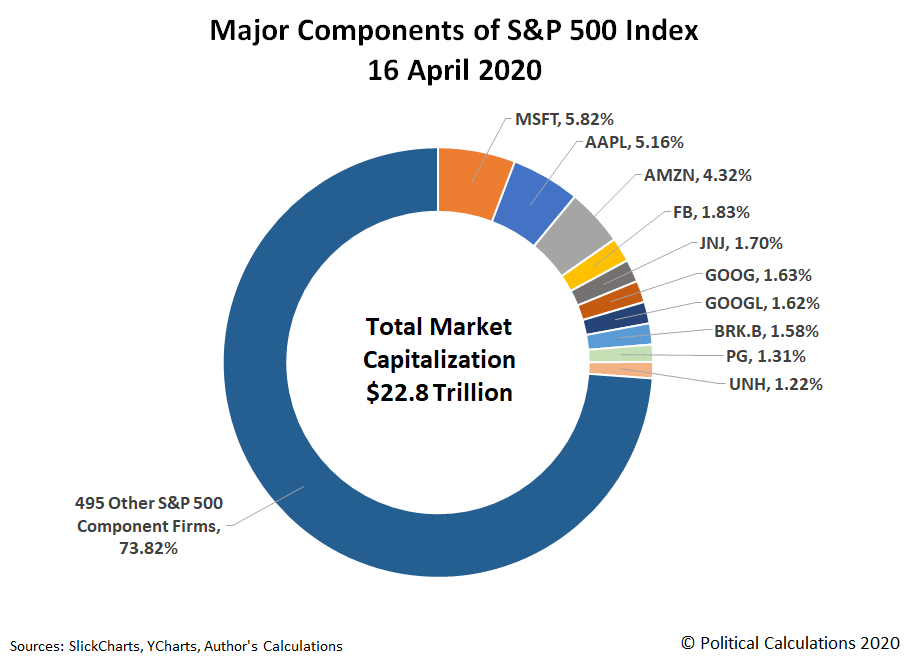
The following graph compares and shows that the 5 largest technology companies, the FAAMG, have a weight equivalent to the nearly 300 companies with the lowest capitalization of the index:

The mutual funds that track the index were recommended as investments by Warren Buffett, John C. Bogle and Tony Robbins for investors with long-term horizons.

In the following link we have a brief feature of this index:

https://ca.spindices.com/indices/equity/sp-500

Long and recent year historical performance of the S&P 500 index

The following graph shows the return on investment in various assets between 1926 and 2018, including the stocks of large companies, which are represented by the evolution of the S&P 500 index:

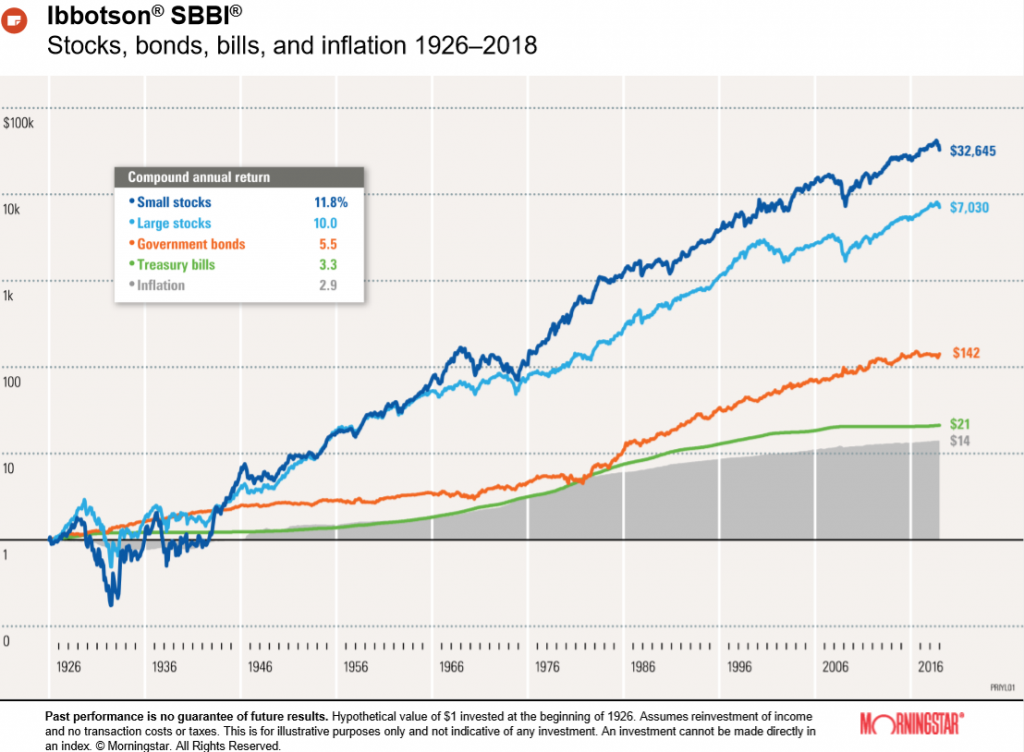
The S&P 500 posted an average annual nominal return of 10%, well above the 5.5% per year provided by 10-year treasury bonds and the 3.3% annual yield on 3-month treasury bills, and only surpassed by small companies stocks of 11.8% per year. The index recorded valuations in 74% of the years.

The following graph shows the annual real returns provided by the S&P 500, which represents the market compared to indices in other countries between 1900 and 2017:

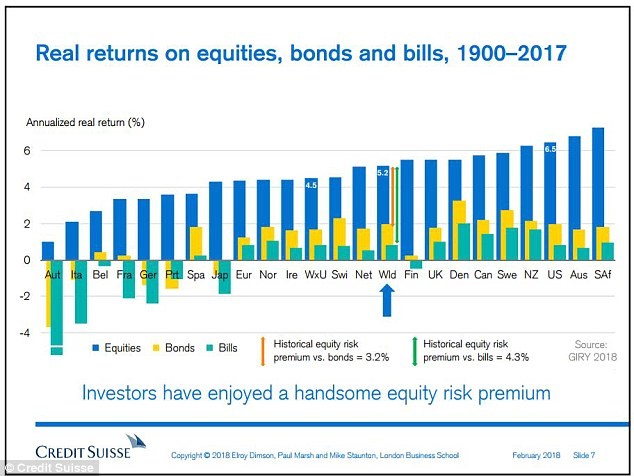
The S&P 500’s real annual rate of return (deducted from inflation) was 6.5% compared to 4.5% for the world excluding the US.

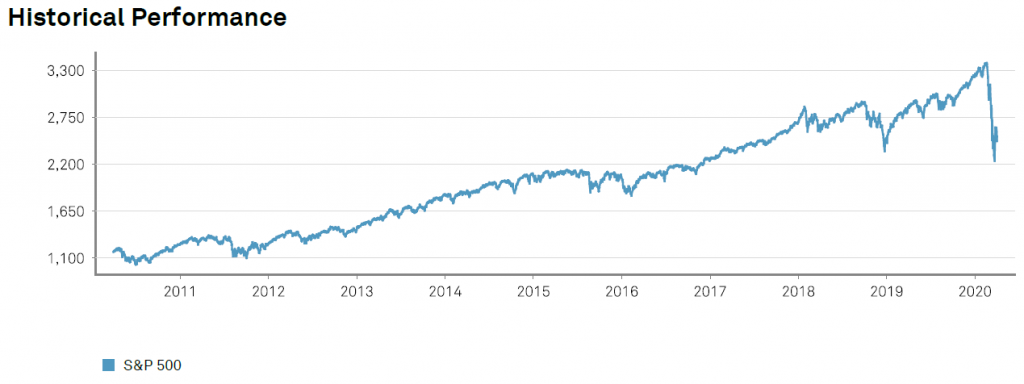
The evolution of the S&P 500 index in recent years through March 2020 was as follows:

The following table shows the annualized returns over the last 10 years:

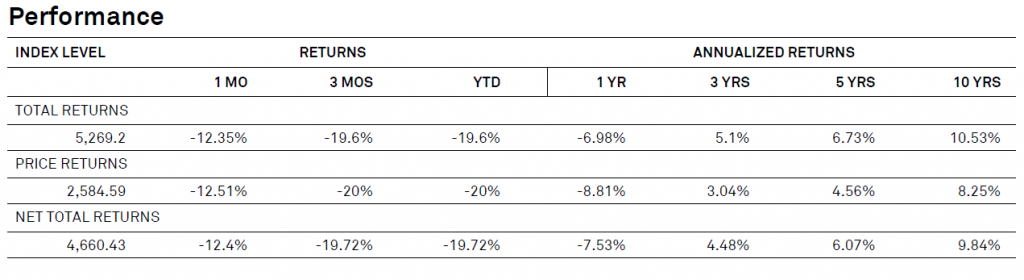
The annualized return of the S&P 500 was -7%, +5.1%, 6.7% and 10.5% in investments made in the 1, 3, 5 and 10 years more recent.

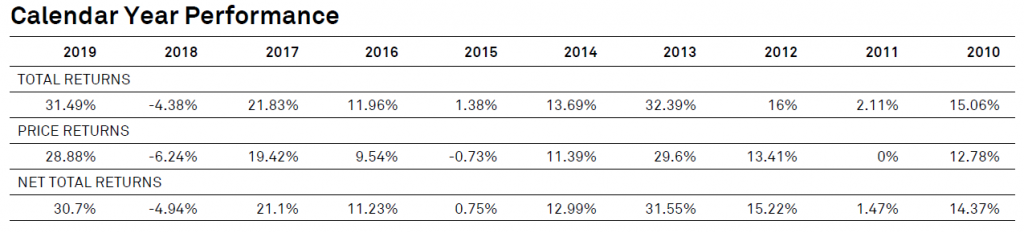
The following table shows the performance observed in each year of the last 10 years:

Previous Post

How to know our investor profile through profiling questionnaires

Next Post

Investing in index funds: the main regional indices of the developed stock markets ex-US

Investadmin

Investadmin

Related Posts

Asset allocation by economic cycles, and the importance of age in asset allocation
Investing Series Guide

Asset allocation by economic cycles, and the importance of age in asset allocation

11 de August, 2024
The 4 Financial Asset Allocation Strategies Used by Individual Investors
Investing Series Guide

The 4 Financial Asset Allocation Strategies Used by Individual Investors

11 de August, 2024
Investing in Secular Stocks Series: Part 4.3 – Relationship between ROIC and the PER and PEG market multiples
Investing Series Guide

Investing in Secular Stocks Series: Part 4.3 – Relationship between ROIC and the PER and PEG market multiples

4 de July, 2024
Investing in Secular Stocks Series: Part 4.2 – The Importance of ROIC in Fundamental Valuation
Investing Series Guide

Investing in Secular Stocks Series: Part 4.2 – The Importance of ROIC in Fundamental Valuation

4 de July, 2024
Investing in index funds or products: The S&P 500 Equal-Weight, as an alternative to the S&P 500
Investing Series Guide

Investing in index funds or products: The S&P 500 Equal-Weight, as an alternative to the S&P 500

20 de June, 2024
Individual investors have a too short time horizon, and this short-sightedness comes at a high cost
Investing Series Guide

Individual investors have a too short time horizon, and this short-sightedness comes at a high cost

14 de June, 2024
Next Post

Investing in index funds: the main regional indices of the developed stock markets ex-US

Leave a Reply

Your email address will not be published. Required fields are marked *

Trending

Effects of Trump’s Trade Tariffs on Financial Investments Series: P1 – Framework

Effects of Trump’s Trade Tariffs on Financial Investments Series: P1 – Framework

8 de May, 2025
Series Investments in the Artificial Intelligence Cycle: Part 2 – The main branches of AI

Series Investments in the Artificial Intelligence Cycle: Part 2 – The main branches of AI

29 de April, 2025
2Q25 Financial Markets Outlook: Zombieconomics, or the monumental cost of Trump’s astronomical reciprocal tariffs

2Q25 Financial Markets Outlook: Zombieconomics, or the monumental cost of Trump’s astronomical reciprocal tariffs

4 de April, 2025
Thematic Investments Series: Part 3. What are the main megatrends?

Thematic Investments Series: Part 3. What are the main megatrends?

28 de March, 2025
Investorpolis

We developed this blog because we believe that only a small learning effort is needed to make a big change in the decisions and results of our investments and financial assets.

Main categories

  • Investing Series Guide
  • Wealth and Investing
  • Retirement & Savings
  • Tools
  • More

Newsletter

Sign to our mailing list to receive updates direct to your inbox!

*We don’t spam

  • Privacy Policy
  • Cookie Policy
  • Contacts

© 2021 - Investorpolis / Powered by Delta Soluções

  • pt-pt Português
  • fr Français
  • es Español
  • en English
  • Home
  • Investing Series Guide
    • I. Goal Based Investing
    • II. Compounding & Inflation
    • III. Assets Risks & Returns
    • IV. Efficient Diversification
    • IX. Sustainable Investing and ESG
    • V. The Investor
    • VI. Assets and Investments
    • VII. Index Funds
    • VIII. Successful Investing
    • X. Kits and Tips
    • XI. Other Topics
  • Retirement & Savings
    • Retirement
    • Savings
  • Wealth and Investing
    • Investing
    • Wealth
  • Tools
    • Calculators
    • Publications
    • Sites and apps
  • More
    • Best of
    • Reviews
    • Snapshots
    • Others
  • About us
    • Who we are
    • Mission
  • Login
  • Cart

© 2021 - Investorpolis / Powered by Delta Soluções

Welcome Back!

Login to your account below

Forgotten Password?

Retrieve your password

Please enter your username or email address to reset your password.

Log In
We use cookies on our website to give you the most relevant experience by remembering your preferences and repeat visits. By clicking “Accept All”, you consent to the use of ALL the cookies. However, you may visit "Cookie Settings" to provide a controlled consent.
Cookie configurationCookie PolicyAcceptReject
Manage consent

Privacy Overview

This website uses cookies to improve your experience while you navigate through the website. Out of these, the cookies that are categorized as necessary are stored on your browser as they are essential for the working of basic functionalities of the website. We also use third-party cookies that help us analyze and understand how you use this website. These cookies will be stored in your browser only with your consent. You also have the option to opt-out of these cookies. But opting out of some of these cookies may affect your browsing experience.
Advertisement
Advertisement cookies are used to provide visitors with relevant ads and marketing campaigns. These cookies track visitors across websites and collect information to provide customized ads.
Analytics
Analytical cookies are used to understand how visitors interact with the website. These cookies help provide information on metrics the number of visitors, bounce rate, traffic source, etc.
Functional
Functional cookies help to perform certain functionalities like sharing the content of the website on social media platforms, collect feedbacks, and other third-party features.
Necessary
Necessary cookies are absolutely essential for the website to function properly. These cookies ensure basic functionalities and security features of the website, anonymously.
Others
Other uncategorized cookies are those that are being analyzed and have not been classified into a category as yet.
Performance
Performance cookies are used to understand and analyze the key performance indexes of the website which helps in delivering a better user experience for the visitors.
SAVE & ACCEPT

Add New Playlist

Are you sure want to unlock this post?
Unlock left : 0
Are you sure want to cancel subscription?