• About us
    • Who we are
    • Mission
  • Contacts
  • English
    • Português (Portuguese (Portugal))
    • Español (Spanish)
    • Français (French)
  • Login
Investorpolis
[xyz-ips snippet="Banners-Publicitarios"]
No Result
View All Result
No Result
View All Result
Investorpolis
No Result
View All Result
Home Investing Series Guide

Investing in index funds: The Nasdaq 100, the benchmark technology index

13 de December, 2020
in Investing Series Guide, VII. Index Funds
Reading Time: 7 mins read
0 0
0
Share on FacebookShare on Twitter

The Nasdaq 100 is one of the three most relevant indices in the US stock market, a benchmark of the global stock market in terms of the most modern and innovative sectors and companies

The Nasdaq 100 Index (and the Nasdaq Composite)

Long historical performance and the last years of the Nasdaq 100 index

Comparison of the Nasdaq 100 with the S&P 500 and the DJIA 30

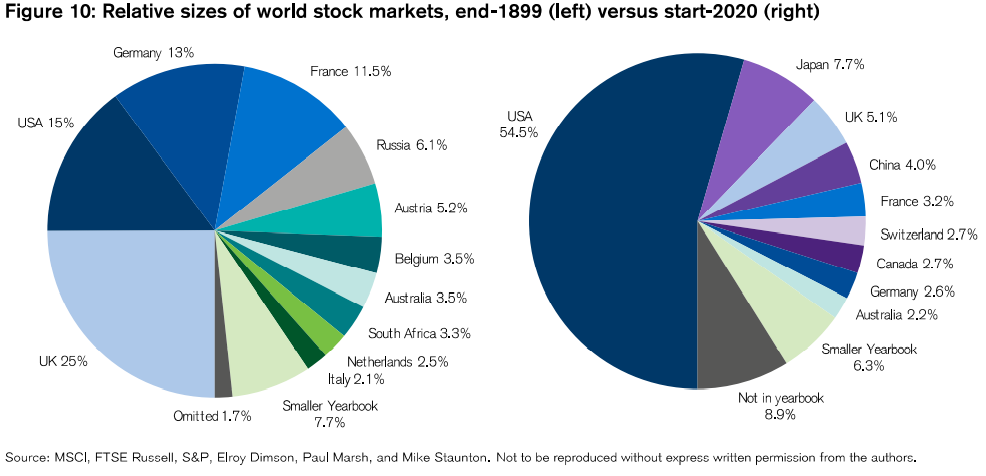
Remember the US accounts for more than 50% of the world’s stock markets:

The Nasdaq 100 is one of the three most relevant indices in the US stock market, a benchmark of the global stock market in terms of the most modern and innovative sectors and companies

The Nasdaq 100 is one of the three most relevant indices in the US stock market, alongside the S&P 500 and DJIA 30, and a global benchmark.

It has a strong pleading of modern economy, innovation, the present and the future, due to its heavy weight of technology companies.

The Nasdaq 100 Index and the Nasdaq Composite)

The Nasdaq 100 index is made up of the 100 largest US companies most actively traded on the Nasdaq stock exchange.

The index includes companies from various industries, with the exception of the financial industry, such as commercial and investment banks. These non-financial sectors include retail, biotechnology, industry, technology, healthcare, among others.

The index is a modified capital methodology. This method uses individual weights of the shares of the companies included according to their market capitalization. A restrictive weighting that limits the influence of the largest companies and balances the index with all members. To do this, Nasdaq reviews the composition of the index each quarter and weights if distribution requirements are not met foremen

The current market capitalization of the Nasdaq 100 is over $10 trillion.

Its sectoral composition is as follows:

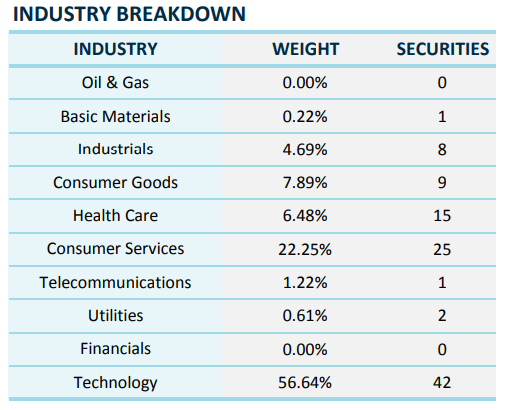
The largest sector is technology with 57%, followed by consumer services with 22%, consumer goods with 8%, biotechnology with 7%, and industry with 5%. Note the absence of the financial and energy sectors, with 0% each, and the derisory expression of public goods and raw materials.

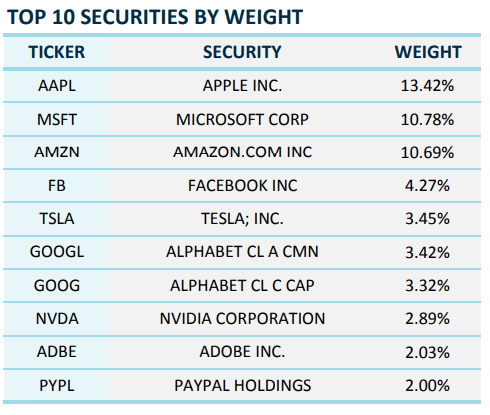
The 10 companies with the most weight in the index are as follows:

The companies that make up the Nasdaq 100 are as follows:

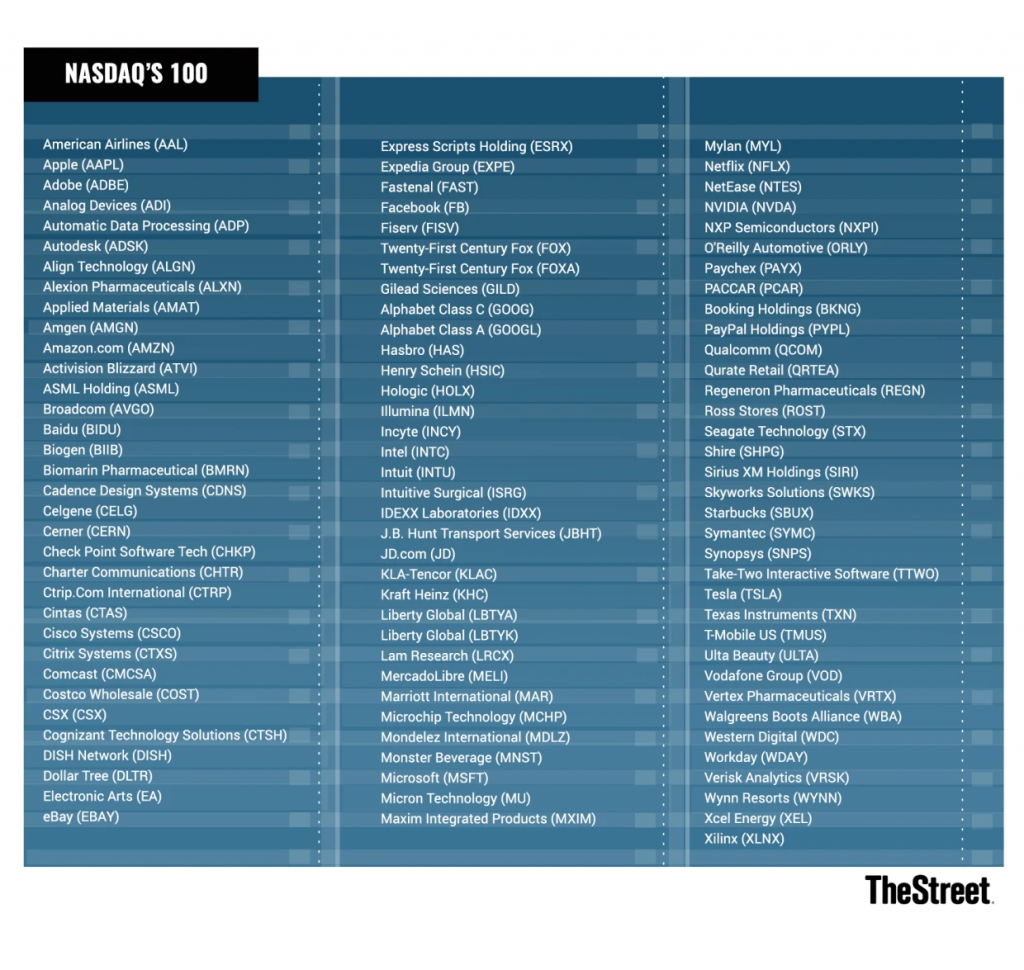
The identity brand of the Nasdaq 100 is the inclusion of many of the leading companies and pioneers of the modern world, integrating the largest stock market capitalizations in the world, starting with FAAMG, Tesla, Nvidia, Starbucks, large biotech companies, etc., as can be seen in the following 2 charts:

There is another major Nasdaq index, the Nasdaq Composite Index, which is the market capitalization-weighted index of more than 2,500 stocks listed on the Nasdaq stock exchange.

The Nasdaq Composite Index uses a market capitalization weighting methodology. The value of the index is equal to the total value of the weights of the shares of each of the securities constituted, multiplied by the last price of each guarantee.

In the following links we have a brief characteristic of the Nasdaq 100 and Nasdaq Composite indices:

https://indexes.nasdaq.com/docs/FS_XNDX.pdf

https://indexes.nasdaqomx.com/docs/FS_COMP.pdf

Long historical performance and the last years of the Nasdaq 100 index

The following chart shows the evolution of the Nasdaq 100 index since its inception in 1972:

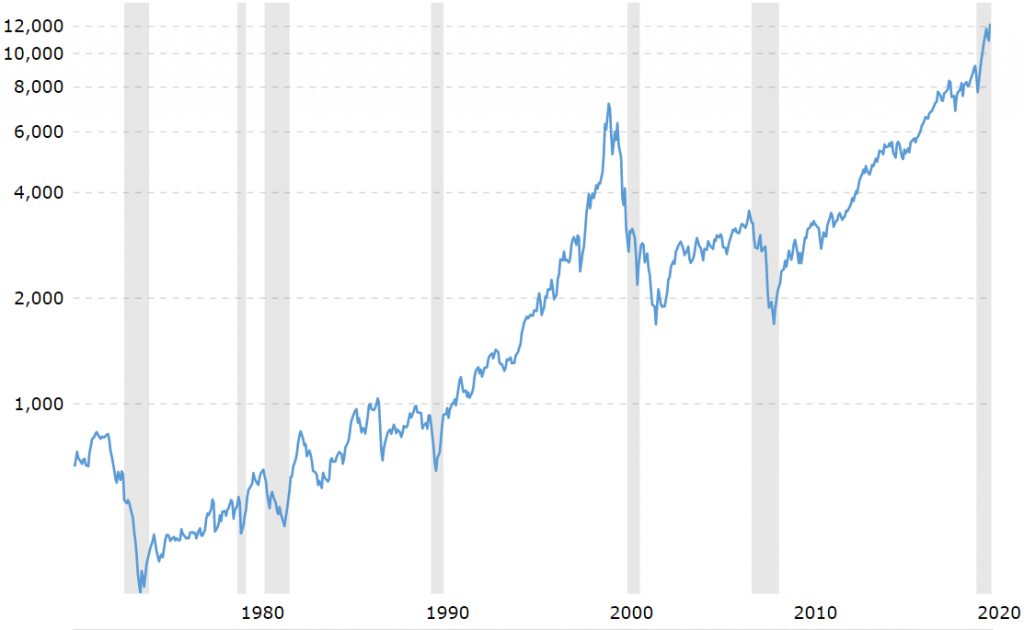
The Nasdaq 100 index posted an average annual nominal return above 11% in this period, slightly higher than the S&P 500 in the same period.

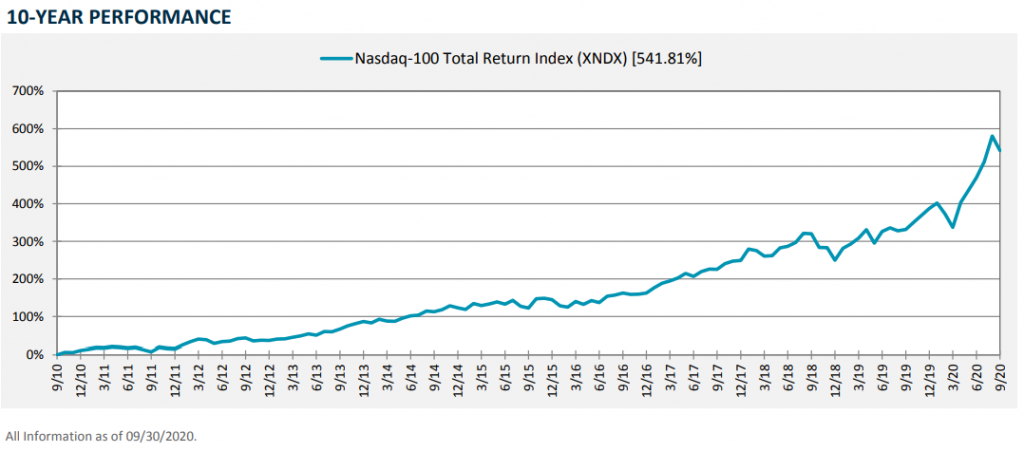
The evolution of the Nasdaq 100 index in the last 10 years to September 2020 was as follows:

Comparison of the Nasdaq 100 with the S&P 500 and the DJIA 30

The Dow contains only 30 stocks of major blue-chip companies listed on the NYSE and Nasdaq, is a stock-weighted index, and represents the largest companies in the various sectors.

The S&P 500 contains 500 stocks of the NYSE’s largest-cap companies, is weighted by stock market capitalization, and represents the US economy.

The Nasdaq 100 contains the top 100 capitalizations listed on this stock exchange, all non-financial, weighted by the market capitalization, and represents the modern, innovative and fundamentally the US technological economy.

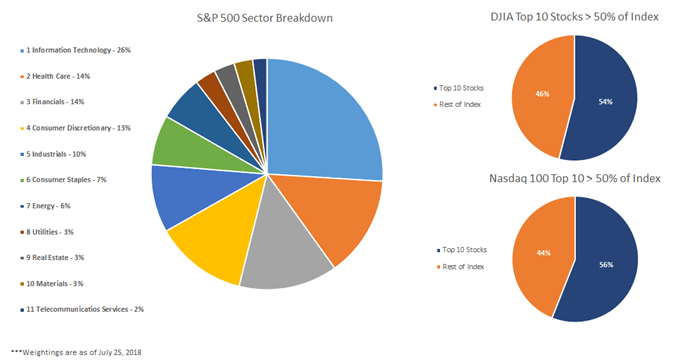
Both the Dow and Nasdaq 100 are impacted by the performance of individual stocks as they derive more than 50% of their value from the top 10 stocks. However, the S&P 500 is more diverse, with the top 10 stocks bearing a total weight of 26 percent (July 2018 data):

Each of the three indexes offers a different exposure. The Dow is the least volatile as it is major blue-chip companies with lower fluctuations, while the Nasdaq 100 is comparatively more volatile due to its considerable exposure to high-growth technology stocks. The S&P 500 is somewhere in the middle, but like most other indexes, it falls faster than rallies.

The following chart shows the comparative evolution of the Dow, S&P and Nasdaq 100 between 1999 and 2020:

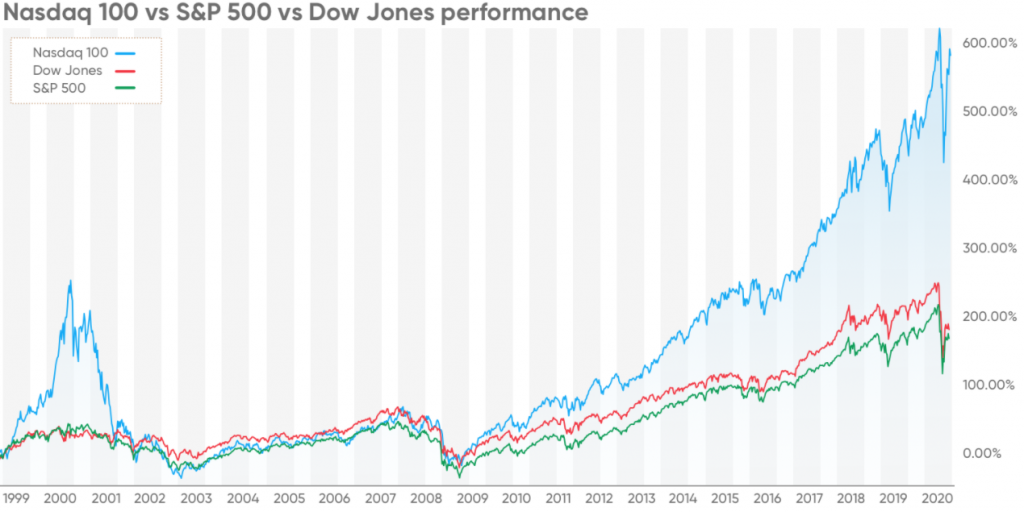
We see that in this 20-year period, Dow and S&P have had about the same performance, growing 200%, while the Nasdaq 100 performed clearly better, with a 600% appreciation.

In recent years, especially since the 2007/08 financial crisis, the Nasdaq 100 has outperformed the S&P 500 by far:

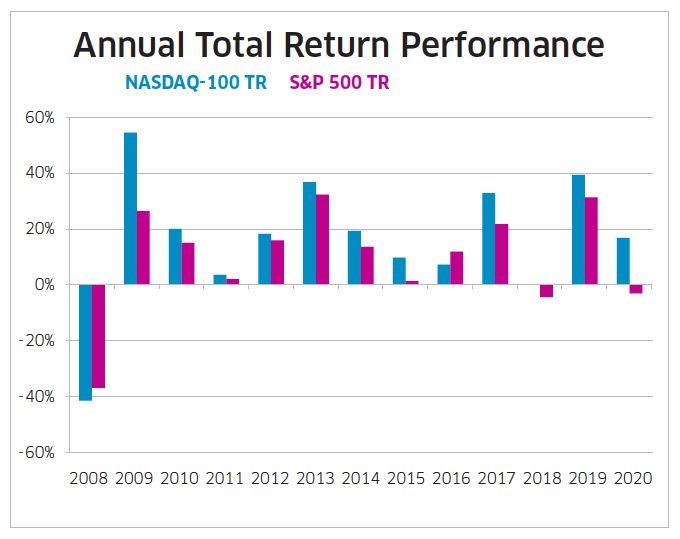
Nasdaq beat the S&P 500 every year except one.

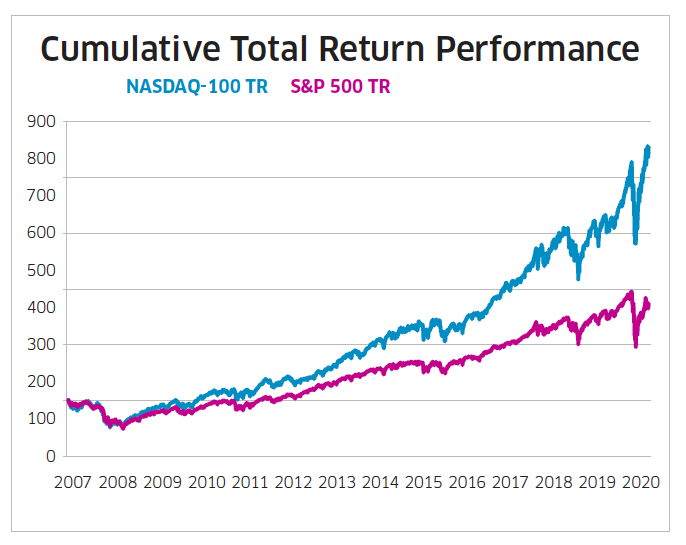
The Nasdaq 100 performance since 2007 was an impressive more than 850%, while the S&P 500 was close to 500%.

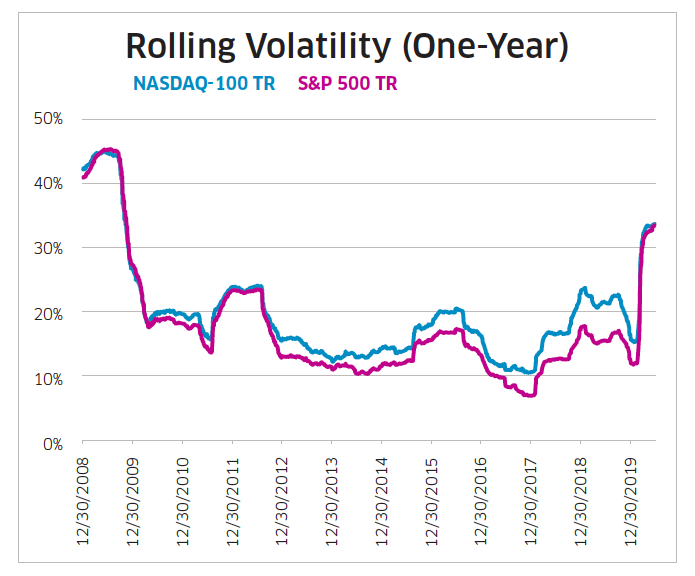
The volatility of the Nasdaq 100 was higher than that of the S&P, but with developments aligned and not far away.

The differences between these indices are fundamentally the result of their sectoral composition:

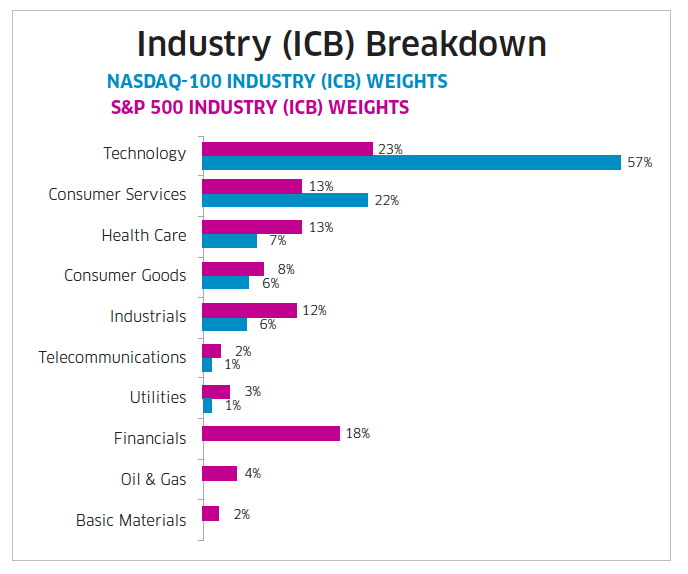
The weight of technology on the Nasdaq 100 is more than double the S&P 500 at 57%, as is consumer services at 22%, while the financial, energy and raw sectors do not appear on the Nasdaq 100 and account for nearly 25% in the S&P 500.

Currently there is a high concentration in the S&P 500, representing the 5 largest companies, the FAAMG, more than 20% of the index, a situation only verified in 1980 and 2000:

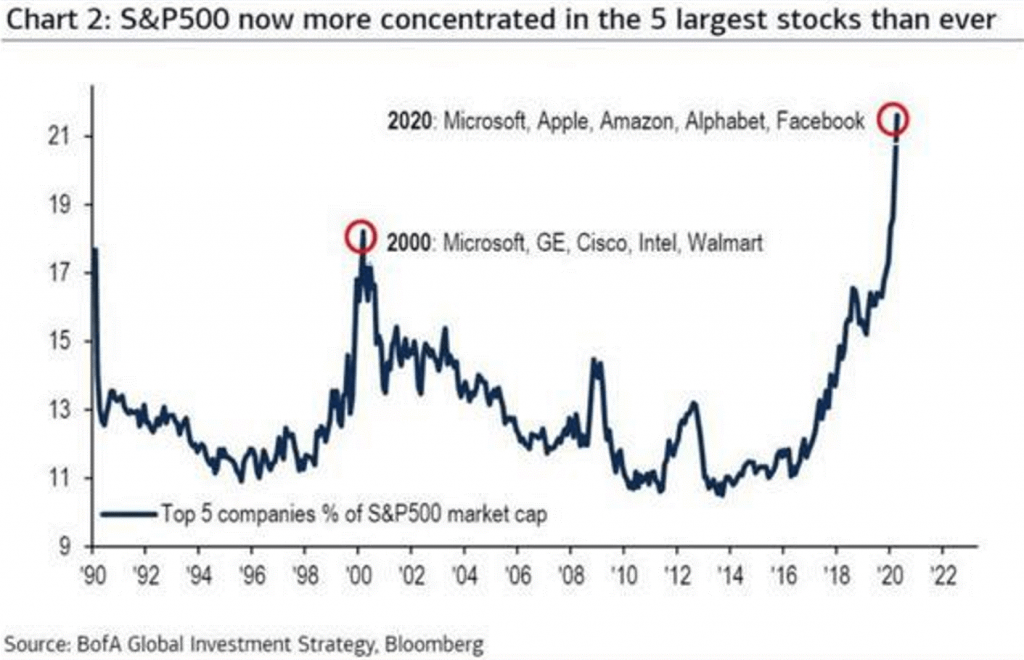
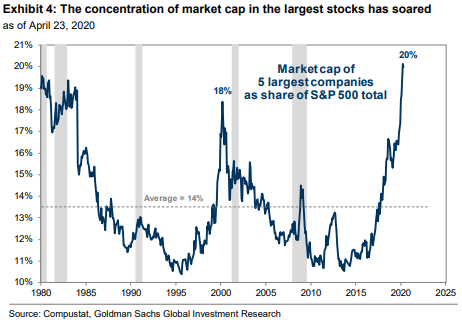
In the Nasdaq 100 this weight is much higher, around 43%.

Previous Post

Investing in index funds: The DJIA 30, the main historical index in the US

Next Post

Investing in Hedge Funds Part I: What are they?

Investadmin

Investadmin

Related Posts

Asset allocation by economic cycles, and the importance of age in asset allocation
Investing Series Guide

Asset allocation by economic cycles, and the importance of age in asset allocation

11 de August, 2024
The 4 Financial Asset Allocation Strategies Used by Individual Investors
Investing Series Guide

The 4 Financial Asset Allocation Strategies Used by Individual Investors

11 de August, 2024
Investing in Secular Stocks Series: Part 4.3 – Relationship between ROIC and the PER and PEG market multiples
Investing Series Guide

Investing in Secular Stocks Series: Part 4.3 – Relationship between ROIC and the PER and PEG market multiples

4 de July, 2024
Investing in Secular Stocks Series: Part 4.2 – The Importance of ROIC in Fundamental Valuation
Investing Series Guide

Investing in Secular Stocks Series: Part 4.2 – The Importance of ROIC in Fundamental Valuation

4 de July, 2024
Investing in index funds or products: The S&P 500 Equal-Weight, as an alternative to the S&P 500
Investing Series Guide

Investing in index funds or products: The S&P 500 Equal-Weight, as an alternative to the S&P 500

20 de June, 2024
Individual investors have a too short time horizon, and this short-sightedness comes at a high cost
Investing Series Guide

Individual investors have a too short time horizon, and this short-sightedness comes at a high cost

14 de June, 2024
Next Post
Investir em “Hedge Funds” ou Fundos de Retorno Absoluto Parte I: O que são?

Investing in Hedge Funds Part I: What are they?

Leave a Reply

Your email address will not be published. Required fields are marked *

Trending

Effects of Trump’s Trade Tariffs on Financial Investments Series: P1 – Framework

Effects of Trump’s Trade Tariffs on Financial Investments Series: P1 – Framework

8 de May, 2025
Series Investments in the Artificial Intelligence Cycle: Part 2 – The main branches of AI

Series Investments in the Artificial Intelligence Cycle: Part 2 – The main branches of AI

29 de April, 2025
2Q25 Financial Markets Outlook: Zombieconomics, or the monumental cost of Trump’s astronomical reciprocal tariffs

2Q25 Financial Markets Outlook: Zombieconomics, or the monumental cost of Trump’s astronomical reciprocal tariffs

4 de April, 2025
Thematic Investments Series: Part 3. What are the main megatrends?

Thematic Investments Series: Part 3. What are the main megatrends?

28 de March, 2025
Investorpolis

We developed this blog because we believe that only a small learning effort is needed to make a big change in the decisions and results of our investments and financial assets.

Main categories

  • Investing Series Guide
  • Wealth and Investing
  • Retirement & Savings
  • Tools
  • More

Newsletter

Sign to our mailing list to receive updates direct to your inbox!

*We don’t spam

  • Privacy Policy
  • Cookie Policy
  • Contacts

© 2021 - Investorpolis / Powered by Delta Soluções

  • pt-pt Português
  • fr Français
  • es Español
  • en English
  • Home
  • Investing Series Guide
    • I. Goal Based Investing
    • II. Compounding & Inflation
    • III. Assets Risks & Returns
    • IV. Efficient Diversification
    • IX. Sustainable Investing and ESG
    • V. The Investor
    • VI. Assets and Investments
    • VII. Index Funds
    • VIII. Successful Investing
    • X. Kits and Tips
    • XI. Other Topics
  • Retirement & Savings
    • Retirement
    • Savings
  • Wealth and Investing
    • Investing
    • Wealth
  • Tools
    • Calculators
    • Publications
    • Sites and apps
  • More
    • Best of
    • Reviews
    • Snapshots
    • Others
  • About us
    • Who we are
    • Mission
  • Login
  • Cart

© 2021 - Investorpolis / Powered by Delta Soluções

Welcome Back!

Login to your account below

Forgotten Password?

Retrieve your password

Please enter your username or email address to reset your password.

Log In
We use cookies on our website to give you the most relevant experience by remembering your preferences and repeat visits. By clicking “Accept All”, you consent to the use of ALL the cookies. However, you may visit "Cookie Settings" to provide a controlled consent.
Cookie configurationCookie PolicyAcceptReject
Manage consent

Privacy Overview

This website uses cookies to improve your experience while you navigate through the website. Out of these, the cookies that are categorized as necessary are stored on your browser as they are essential for the working of basic functionalities of the website. We also use third-party cookies that help us analyze and understand how you use this website. These cookies will be stored in your browser only with your consent. You also have the option to opt-out of these cookies. But opting out of some of these cookies may affect your browsing experience.
Advertisement
Advertisement cookies are used to provide visitors with relevant ads and marketing campaigns. These cookies track visitors across websites and collect information to provide customized ads.
Analytics
Analytical cookies are used to understand how visitors interact with the website. These cookies help provide information on metrics the number of visitors, bounce rate, traffic source, etc.
Functional
Functional cookies help to perform certain functionalities like sharing the content of the website on social media platforms, collect feedbacks, and other third-party features.
Necessary
Necessary cookies are absolutely essential for the website to function properly. These cookies ensure basic functionalities and security features of the website, anonymously.
Others
Other uncategorized cookies are those that are being analyzed and have not been classified into a category as yet.
Performance
Performance cookies are used to understand and analyze the key performance indexes of the website which helps in delivering a better user experience for the visitors.
SAVE & ACCEPT

Add New Playlist

Are you sure want to unlock this post?
Unlock left : 0
Are you sure want to cancel subscription?