


The last two decades have been of strong growth and convergence of financial wealth in Asia, but also in other emerging economies in relation to advanced economies
In Asia, 80% of gross financial assets are focused on Japan and China
In terms of gross financial assets per capita, Singapore already exceeds even Japan
Taiwan leads in terms of gross wealth as a percentage of GDP with more than 500%
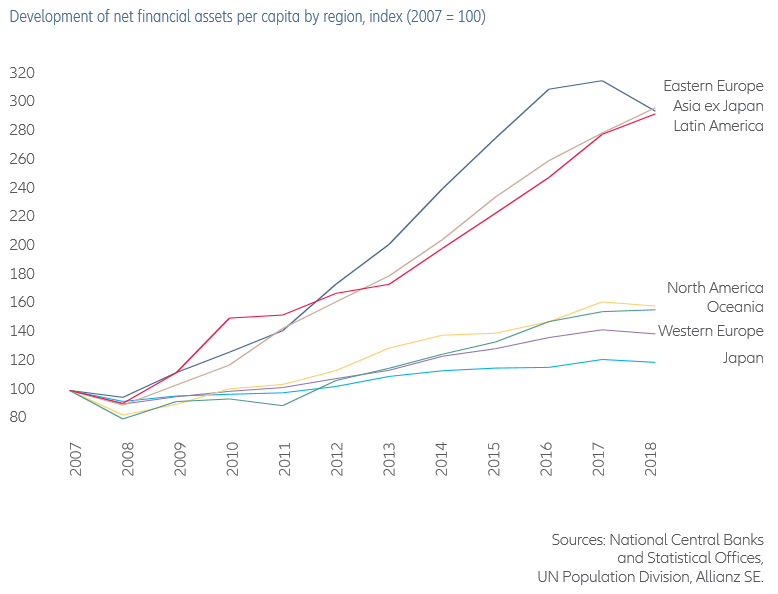
Over the past two decades, there has been a huge convergence of global wealth between poor and rich regions, with Asia ex-Japan, Eastern Europe and Latin America growing by almost 200%
Between 2007 and 2018, all emerging markets, Eastern Europe, Asia ex-Japan and Latin America experienced extremely high net financial asset growth per capita of around 200%.
In Eastern Europe, per capita financial assets grew at 10.3% per year in the same period, mainly driven by a reduction in debt levels.
Net financial assets per capita in Asia ex-Japan have grown at 10.2% per year since 2008, but last year net wealth in the region decreased by 6.7% mainly due to a 10.6% reduction in household wealth in China.
Latin America recorded a growth in net financial wealth per capita of 10.1% in that decade.
This growth pace in net financial wealth of emerging economies has surpassed by far that of advanced economies, which in the last 10 years has only grown by between 10% in Japan, 25% in Western Europe and 40% to 50% in Oceania and North America.
We had growth rates of more than 10% per year for emerging economies and between less than 1% and no more than 2.5% for advanced economies.
It was in China and India that the average wealth grew the most between 2000 and 2017, at an annual rate that is twice that of the world
The following two graphs show the growth of average wealth in fast-growing countries and major regions between 2000 and 2017, in terms of current and constant exchange rates:
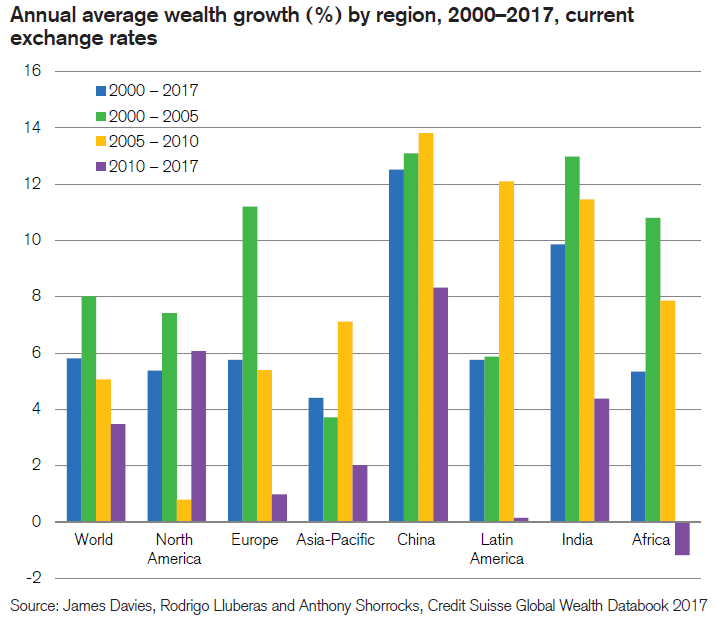
The growth rate of average wealth in China at current rates in these 17 years was above 8% per year, well above North America’s 6% per year, India’s 4% per year of 1% per year in Europe and just over 3.5% per year in the World.
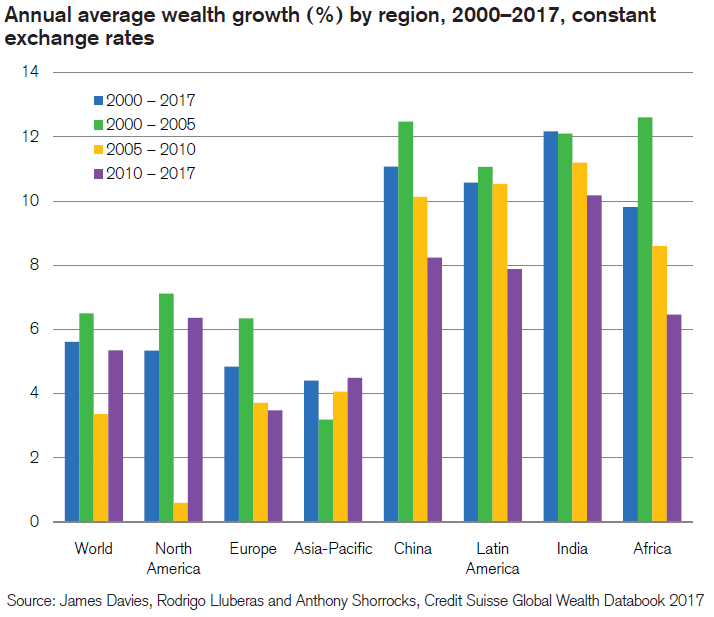
At constant rates terms, the wealth growth in the period was higher in India at 10% per year, followed by China with 8% per year and with Latin America almost on par, maintaining the 6% per year of North America, raising Europe to 3.8% per year and the World to almost 5.5% per year.
In Asia, 80% of gross financial assets are focused on Japan and China
In 2017, China already accounted for 50% of Asia’s gross financial assets, Japan 29%, South Korea 6%, Taiwan 5 2017, China already accounted for 50% of Asia’s gross financial assets, Japan 29%, South Korea 6%, Taiwan 5% and India 5%.
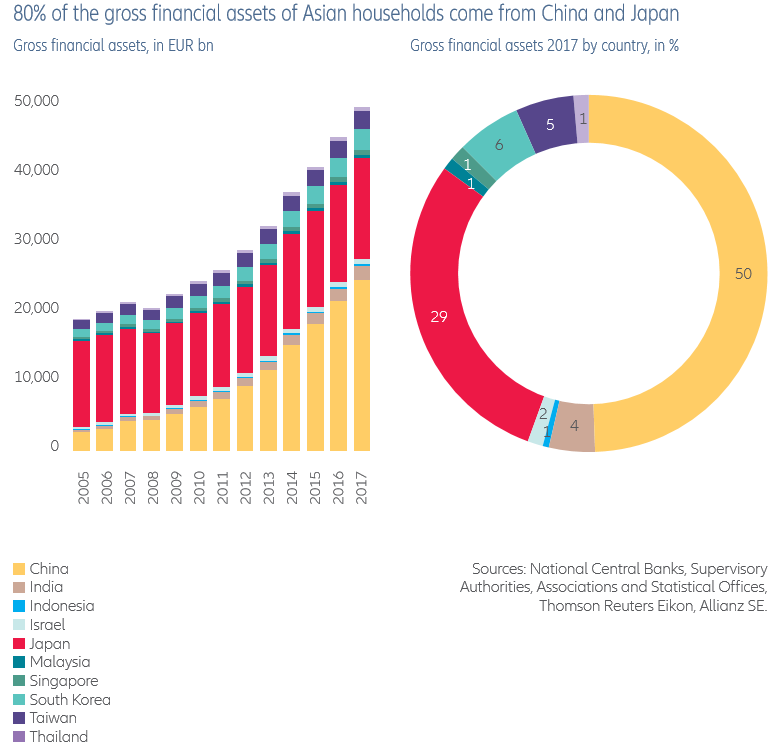
The progress of the Chinese economy is remarkable. In 2005 it had just over 10% of Asian gross financial wealth and grew fivefold to 50% in 2017.
As we have seen, Japan barely grows in terms of gross wealth, so it sees its weight in the region’s wealth falling from almost 80% in 2005 to 29% in 2017.
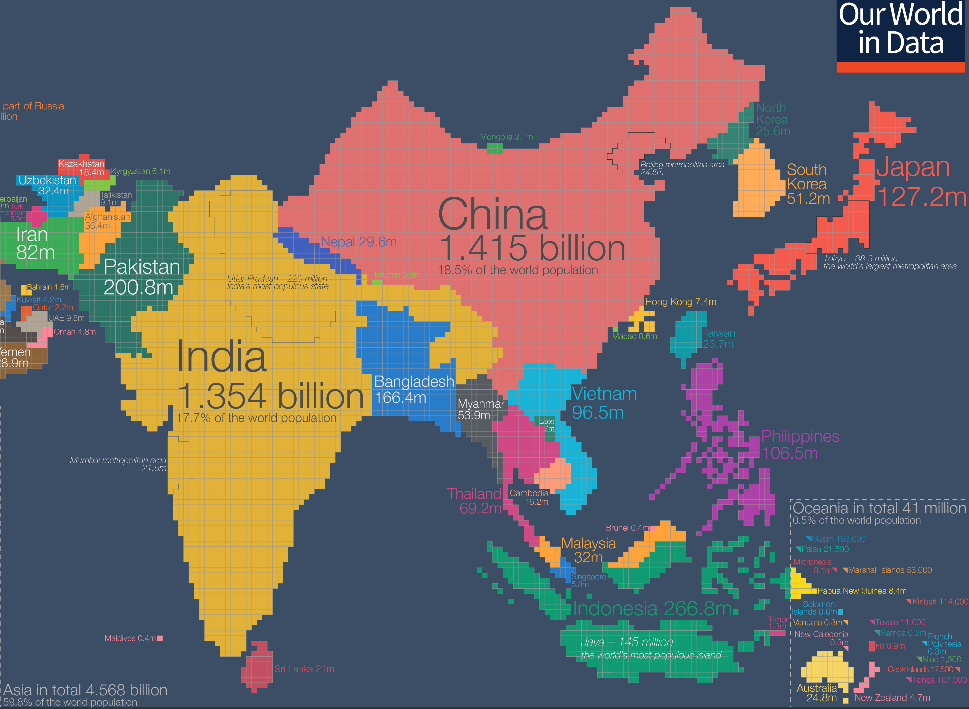
These aggregated wealth values per country are influenced not only by their economic dynamics but also by demographic factors, namely the size of the population and its degree of ageing.
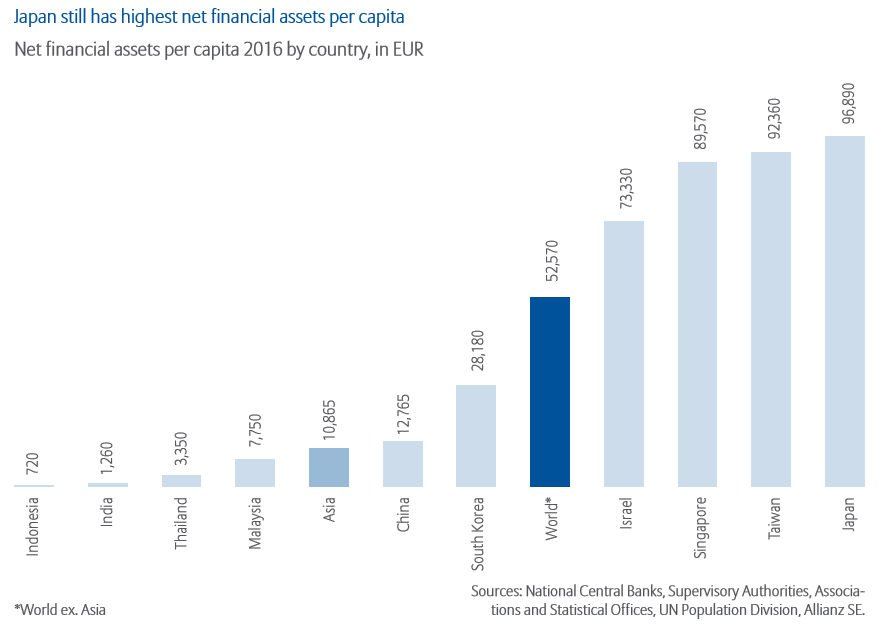
Japan is still the economy with the highest value of net financial assets per capita, but Taiwan and Singapore are close
Japan still holds the lead in terms of net financial wealth per capita, reaching $97,000, but is soon followed by Taiwan with $92,000 and Singapore with $90,000.
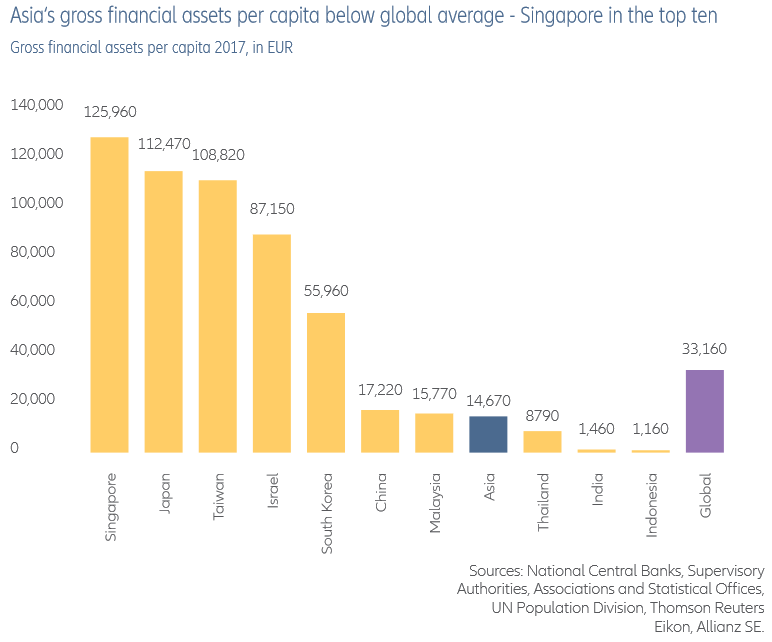
In terms of gross financial assets per capita, Singapore already exceeds even Japan
Gross financial assets per capita reflect the level of economic development and access to financial services of a large part of the population.
Singapore already surpasses Japan in terms of gross financial wealth per capita, with a value of $126,000 versus $112,000. Taiwan follows with $108,000.
Asian average is very low, at $14,760, less than half the global average of $33,160, much due to the value of financial wealth in India and Indonesia which are only $1,460 and $1,160, respectively.
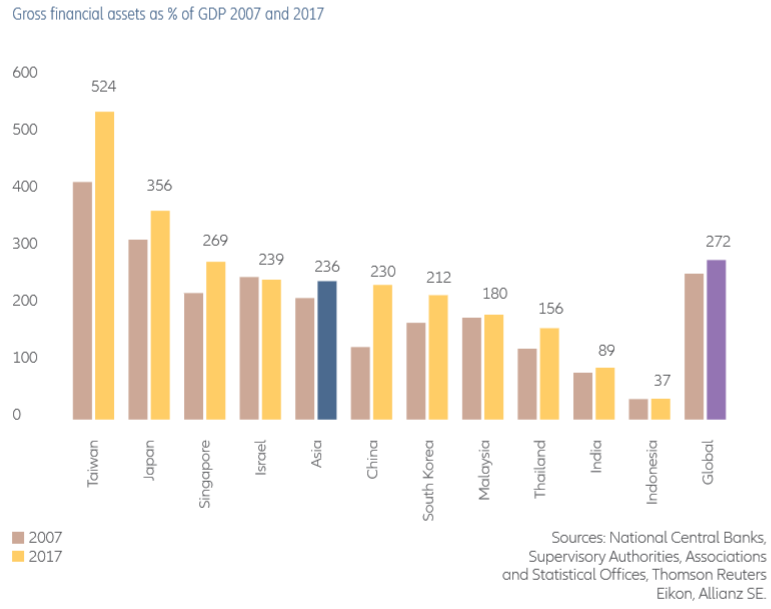
Taiwan leads in terms of gross wealth as a percentage of GDP with more than 500%
Typically, the higher the GDP per capita, the higher the financial wealth per capita.
Taiwan leads the region in terms of gross financial wealth as a percentage of GDP with 524%, followed by Japan with 356% and Singapore with 269%, compared with 272% of the world average.
At the opposite end we have India with 89% and Indonesia with 37%.
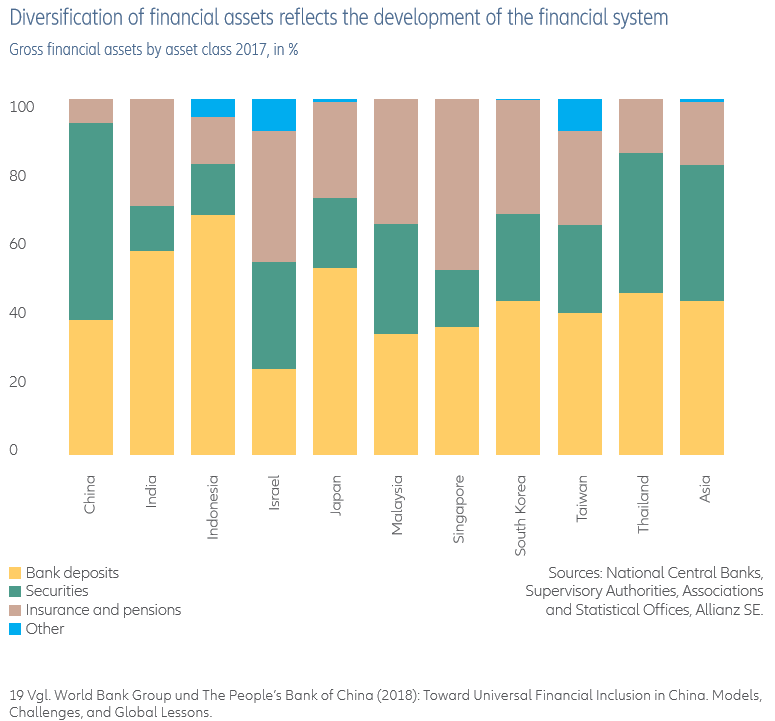
Japan, India, and Indonesia are among the most conservative countries in terms of financial investments in the region, and Asian tigers, the most diversified
Indonesia, India, and Japan are the countries with the highest percentage of allocation to deposits.
The same is true of China, although it does not translate from the data. The investment in securities in China is mainly in banking products called wealth management products, whose degree of opacity has been worrying and making the Chinese authorities act.
The conservatism in these countries is due to a historic poor performance of capital markets in Japan, the still incipient degree of development of the capital market and capital control regime in China and the level of poverty in India and Indonesia.
The 4 Asian tigers, Malaysia, Singapore, Taiwan, and South Korea have fewer deposits and invest more in bonds, insurance and pensions.
The capital market in Indonesia has appreciated more than 800% and India’s more than 600% in the last decade
In the last 17 years emerging markets have performed exceptionally well. Since the beginning of the new millennium, Indonesia’s stock market index has risen 800%, India’s 600%, and Thailand’s 250%, while major Chinese, Malaysian and Korean stock indices have risen 100%.
Markets in Japan, Taiwan and Singapore performed more modestly.
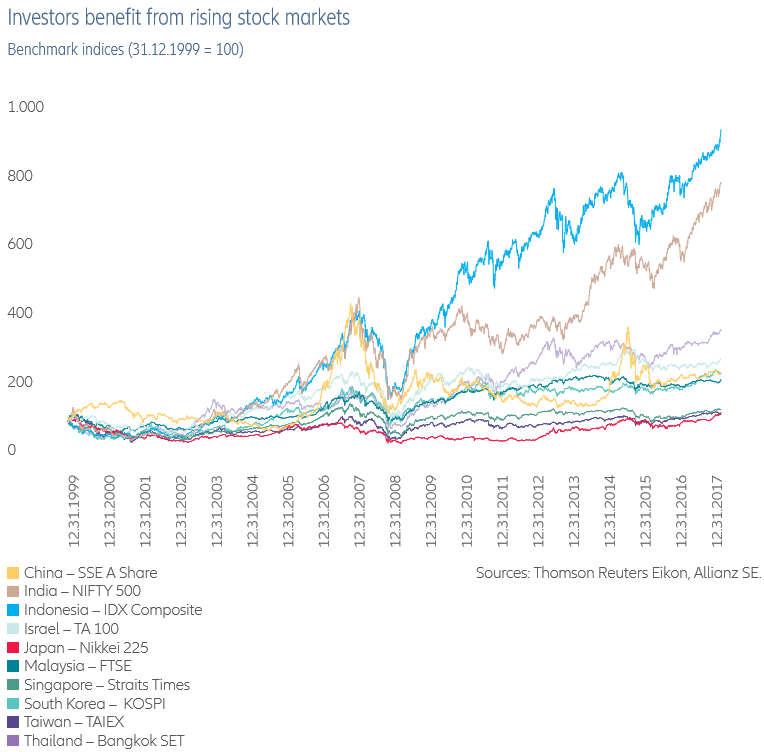
Too bad that households in India only held 12.6% of the financial assets invested directly in bonds, and Indonesian households 15%, which made them little benefit from those strong valuations.


