Main economic and financial indicators
Profit margins and revenue growth
Earnings Growth Rates
Valuation by PER and PCF multiples
The weight of FAAMG in the S&P 500, index, results and revenues
In the first article we made a brief general presentation, highlighting the history of its growth and appreciation.
In the second article we develop the weight, contribution and importance in market indices, as well as the distortions caused in market analysis if we do not take into account the effects of these heavyweights.
In the previous article, we saw in more detail what FAANGM actually are, starting with the analysis of their businesses, including some large numbers.
In this article we will review the main economic and financial indicators of these companies and that are the basis for the evaluation and performance of these companies in the market.
Main economic and financial indicators
The main economic and financial indicators of FAAMG are as follows:

For reference and comparison purposes, the following are the evaluation indicators for the largest 25 companies that make up the S&P 500:
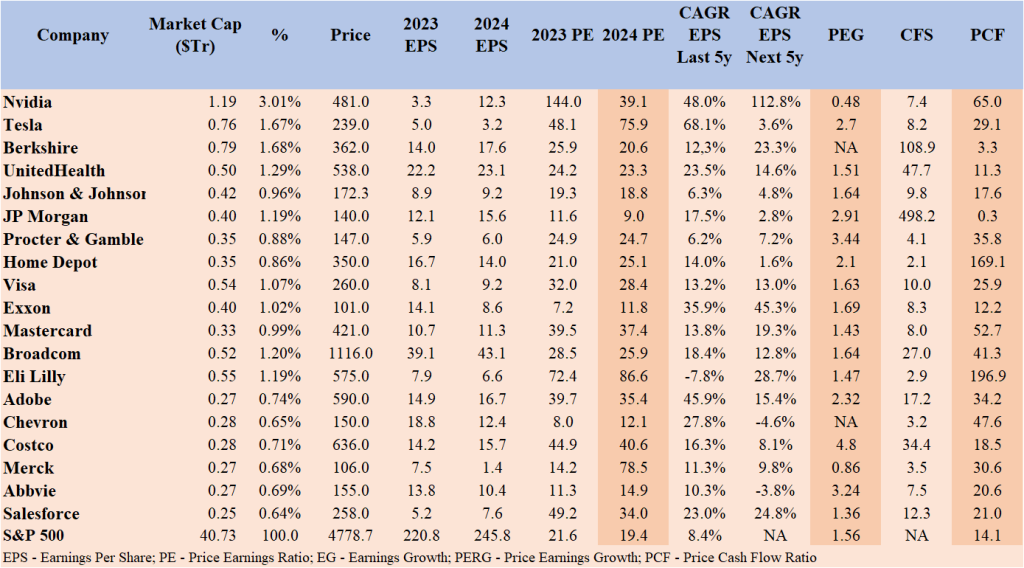
Next, we will analyze this varied set of indicators.
Profit margins and revenue growth
As we can see, FAAMG stands out for having a growth rate in revenues and results well above the S&P 500 average.
They are truly companies with a strong pace of growth, both in the past and foreseeably for the future.
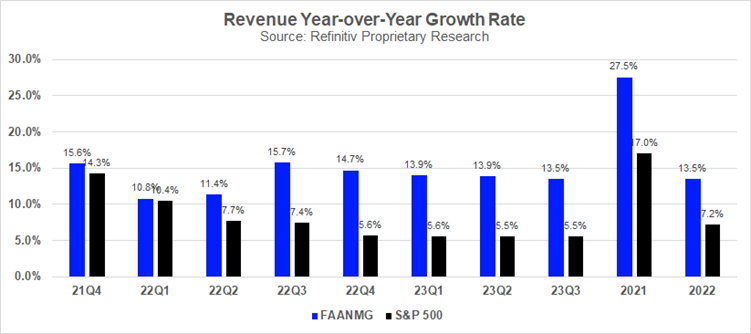
These companies, with the exception of Amazon, grow at average annual rates of revenues nearly double the S&P 500 average, around 15 percent versus less than 10 percent for the market average.
This trend has continued recently:
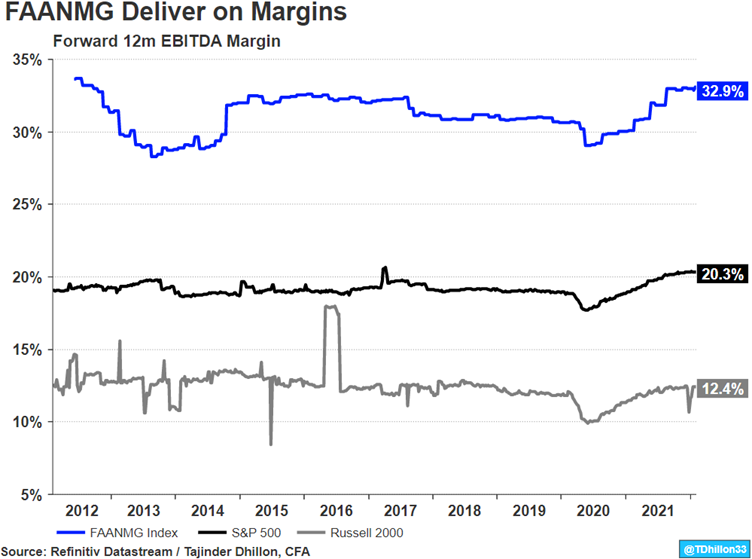
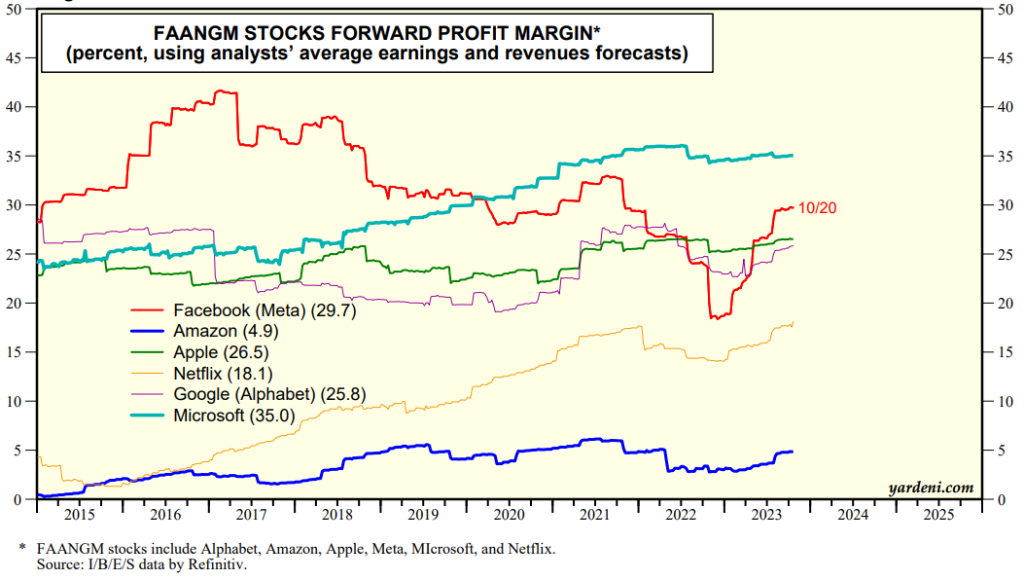
FAAMG, again with the exception of Amazon, also have profit margins much higher than the market average, between 22% and 35% versus the average of 12%.
This has been going on for a long time, as evidenced by the EBITDA margins compared to the S&P 500 index for large companies and the Russell 2000 for small and medium-sized companies:
In individual terms, the evolution of FAAMG’s profit margin has been as follows, showing great stability:
Earnings Growth Rates
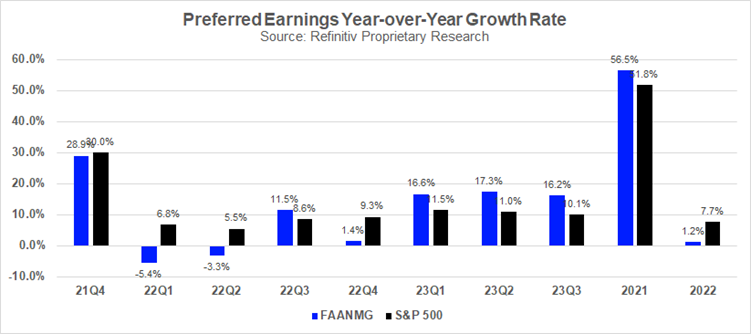
FAAMG’s earnings growth rate is nearly double the S&P 500 average of 20 percent versus about 8 percent.
This reality was only not observed in 2022, due to the poor performances of Amazon and Meta (and also Netflix):
Evaluation by multiples of PER and PCF
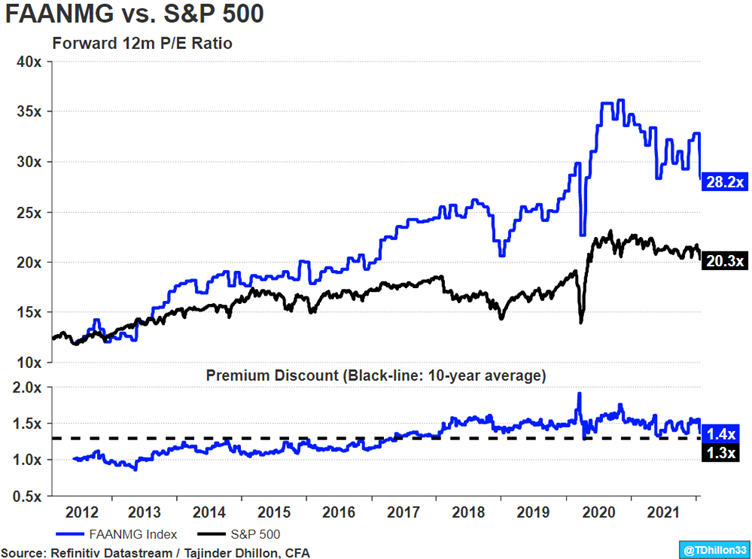
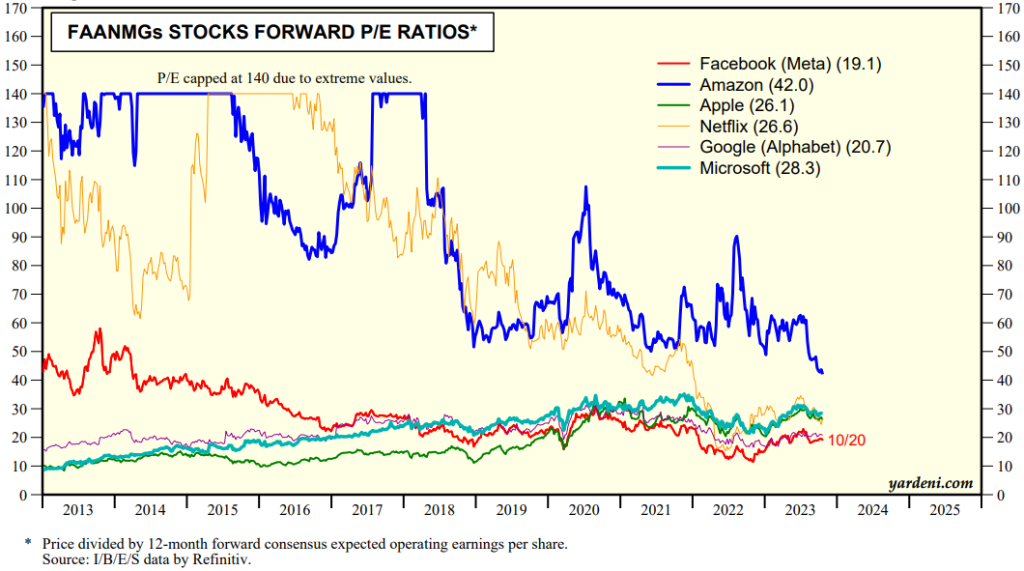
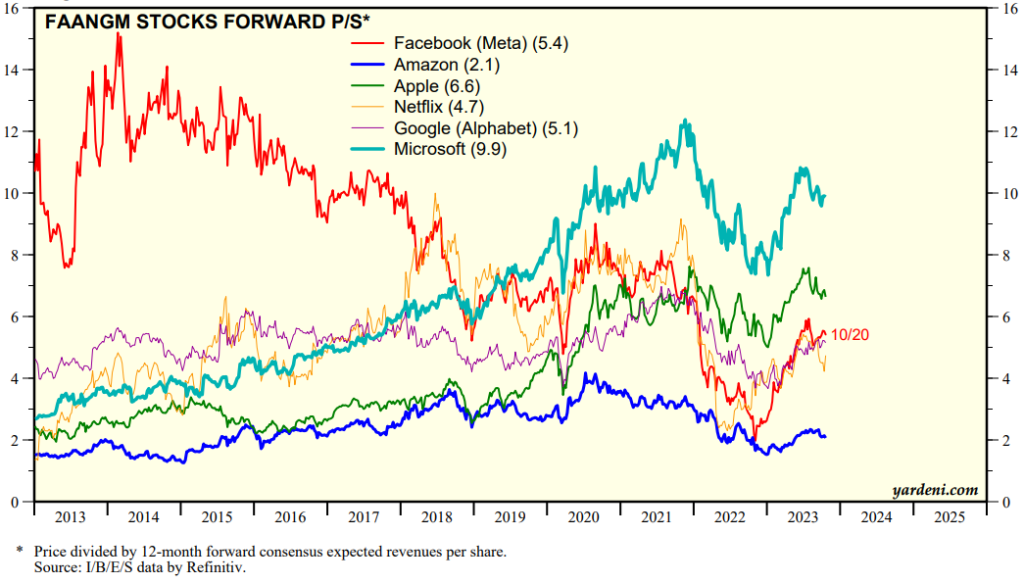
For some years now, FAAMG has been priced at a premium to the market in terms of price-to-earnings (PER) multiples, at around 25x to 30x, compared to the S&P 500’s average of 18x-19x.
This reality is fundamentally due to 4 factors.
First, because of higher revenue and earnings growth rates.
Second, as a result of higher profit margins.
Thirdly, and cumulatively with the previous ones, the fact that they are the leading global companies, with enormous competitive advantages (MOAT) and very solid balance sheets.
Fourth, and finally, because they are companies that strongly generate cash-flows, which benefits them when evaluated by the multiple of price over cash-flows (in fact, this is the primary factor in the case of Amazon).
FAMG detached from the rest of the S&P 500 companies in terms of the PER multiple from 2013 onwards and has maintained the current gap since 2018, corresponding to a premium of 30% to 40%:
The weight of FAAMG in the S&P 500, index, results and revenues
It is for all these reasons that FAAMG has a great weight in the market, whether in terms of capitalization, revenues and results:
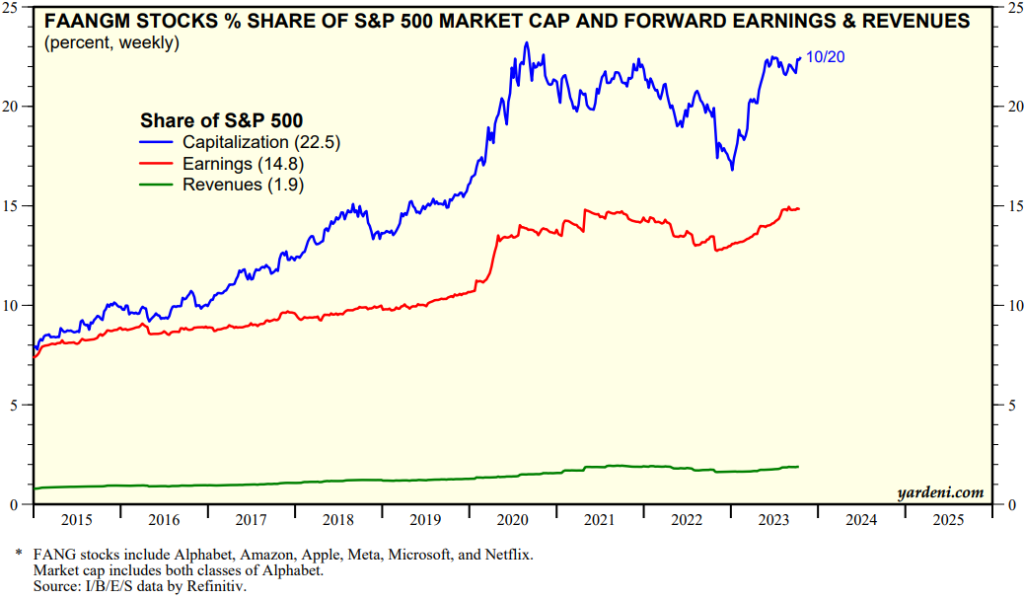
The weight in the index is 25%, almost double the 15% of the results (scale, solidity and growth factors), and 10 times the weight of revenues (above all, margin factor).
In conclusion, the Magnificent 7 or the FAAMG are true mastodons, with markets of billions of consumers and billions of dollars, with practically impregnable economic moats, high profit margins, revenues, results and cash-flows, with strong R&D and acquisitions for constant innovation.
All these factors justify the valuation premium vis-à-vis the market.


