In the initial article of this series we gave an overview of the simple portfolios, describing their characteristics, their advantages and uses, and presented the developments foreseen for the following articles.
In this article we will address the traditional portfolio 60/40, consisting of 60% stocks and 40% bonds.
Jack Bogle, the founder of Vanguard Group, the world’s largest investment fund manager, said all we need is to maintain an investment portfolio of 60% stocks and 40% bonds for life. And he maintained this allocation for years.
What is the traditional 60/40 portfolio?
To whom is the 60/40 portfolio for?
What is the performance of the 60/40 portfolio?
What is the traditional 60/40 portfolio?
The traditional portfolio 60/40 consists of an investment portfolio that combines the exposure of 60% in stocks and 40% in bonds.
It is the most used portfolio, most recommended and also most discussed by financial advisors and other investment management specialists.
Therefore, this portfolio is also known as the traditional portfolio.
To whom is the 60/40 portfolio for?
The 60/40 portfolio is a portfolio considered suitable for all circumstances because it balances very simply the profitability and risks of the main assets, stocks and bonds.
The 60/40 investment portfolio has long been revered as a reliable guide for a moderate venture investor —a 60% allocation to stocks intended to provide capital appreciation, and a 40% allocation to bonds to potentially deliver income and risk mitigation.
Therefore, it is the most recommended portfolio for life for the generality of investors.
This scope of adequacy and market is its main advantage.
What is the performance of the 60/40 portfolio?
Next, we will develop in more detail the returns and risks of this portfolio, comparing it with two alternative portfolios, those of 100% investment in stocks and bonds.
We have used U.S. market information from 1926 to date, namely the performance of the S&P 500 for stocks and 10-year treasury bonds for bonds.
The following chart shows the historical performance of the 60/40 portfolio since 1926, comparing an investment of $100 dollars in 60% of S&P 500 stocks and 40% of U.S. 10-year treasury bonds, with the same investment in 100% of those stocks and 100% of those bonds:
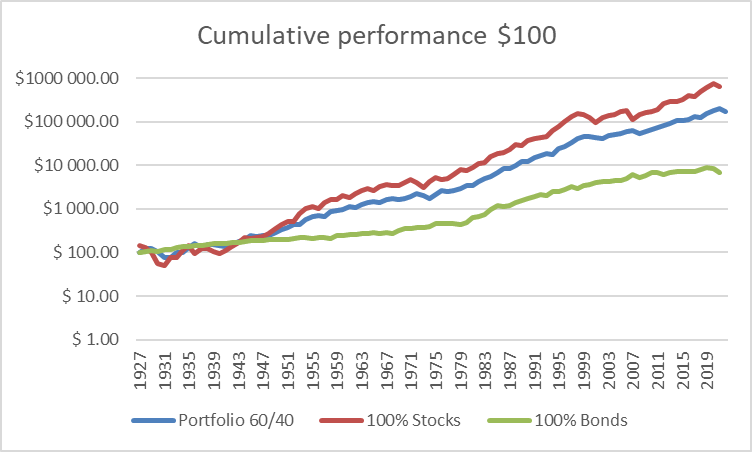
The investment of $100 in 1927 in the 60/40 portfolio would have generated a capital of $168,814 in 2022, compared to $624,670 in 100% in shares and $7,006 in 100% in bonds.
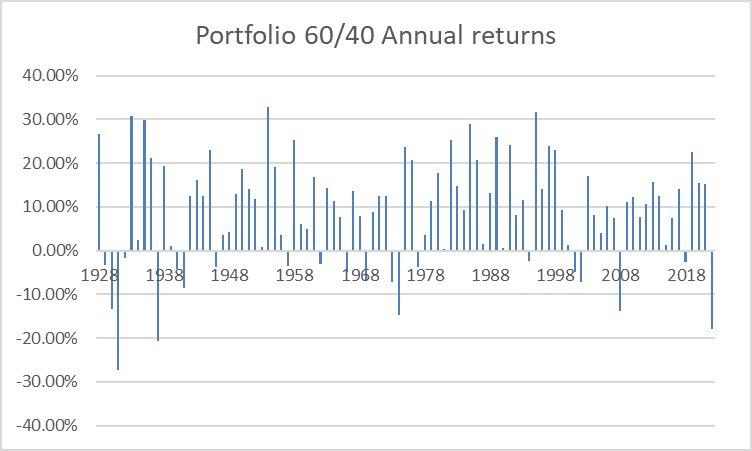
The following graph shows the annual returns of this portfolio:
The following table shows the average annual rate of return of each of these investments, calculated in arithmetic (simple average) and geometric (composite average) terms, for the entire period between 1927 and 2022, as well as that of the last 10 and 30 years:


Since 1927, the 60/40 portfolio has had an annualized return of 8.9%.
In this period, these rates exceeded those of 100% investment in treasury bonds by 3.9% and fell short of stocks by 3.6%.
In its best year, in 1993, it recorded returns of 36.7%, while in its worst year, 1931, it recorded a loss of 26.6%.
The most recent returns show similar results.
Over the past 30 years, between 1973 and 2022, a 60/40 portfolio consisting of an S&P 500 index for stocks and 10-year treasury bonds had an average annual return of 9.8% with a standard deviation of 11.5%.
In the last decade, the 60/40 portfolio had an average annual return of 8.5%.
The following table shows the average annual rates of return for each decade between 1927 and 2022 for the same investments:
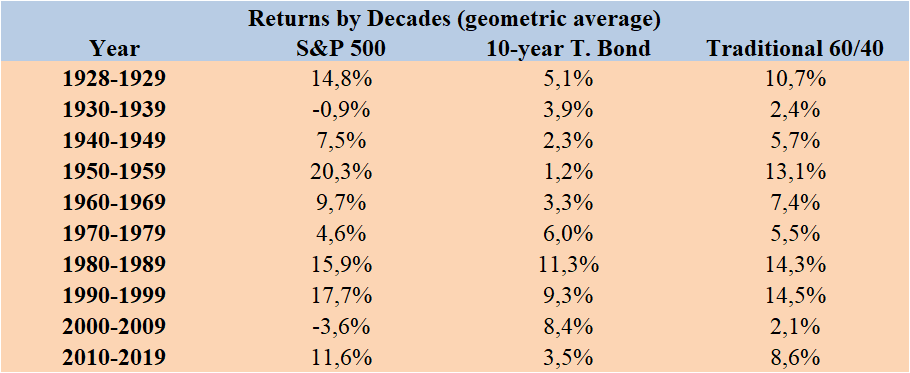
As you would expect, average rates of return have shown some dispersion over the decades.
The best decades were eighties, ninetys and fifty, while the worst were the first of two thousand, those of thirty, forty and seventy.
Moving on to the risks, we start by seeing the percentages of the positive and negative years of investment in the 60/40 portfolio, and in the investments of 100% in stocks and bonds:

Over these 96 years, the portfolio has lost value in 20 years, that is, almost 80% of the years were positive.
The following graph shows the drawdown – the largest possible capital devaluation as a percentage, calculated by comparing the value reached at the last peak with that of the current value of the portfolio at each moment – of the 3 investments under analysis between 1927 and 2022:
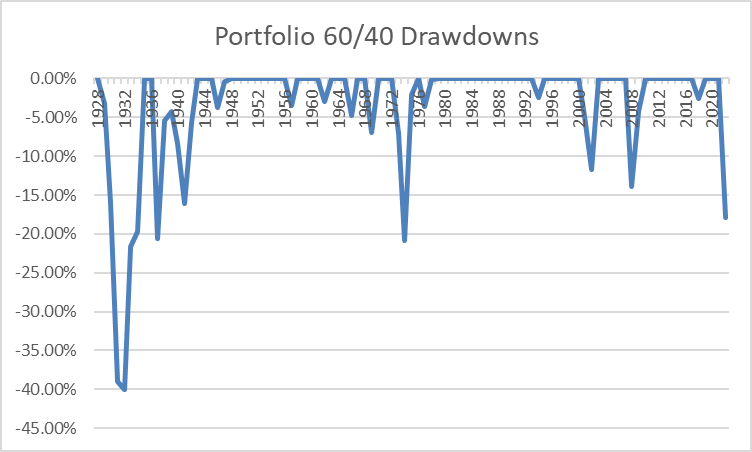
The “dradwdown” of the 60/40 portfolio only exceeded 20% in the periods of the Great Depression and the oil crisis of 70.
The largest recent drawdowns were in the 2008 GFC and the 2000 technology bubble.
Overall, recoveries of losses that occurred were rapid, with the exception of the Great Depression
The following table shows the standard deviations of portfolio 60/40 and 100% investments in stocks and bonds between 1927 and 2022, as well as for the last 10 and 30 years:

What also impresses a lot is the decrease in risk, or volatility, provided by the portfolio. The average annual standard deviation was 12% in the last 95 years, which compare with almost 20% of a 100% portfolio in stocks and 7.7% of a 100% portfolio in bonds.
The following chart shows the rates of return for 10-year investment periods (called “rolling returns” or moving averages) of the 60/40 portfolio and of 100% investments in stocks and bonds:
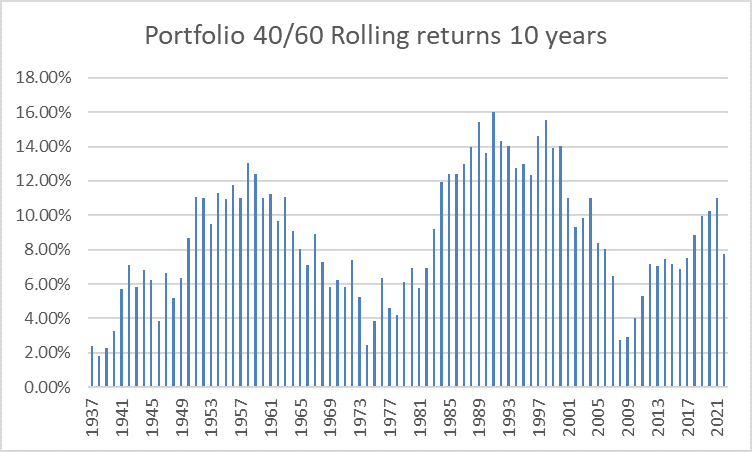
The average annual returns for 10-year periods were very interesting.
There have never been periods with negative yields, with lows exceeding +2% per year at the beginning of seventy-2008-09, and highs of more than 15% per year.
Finally, the following table contains the Sharpe ratio, the quotient between average annual returns and annual standard deviation and which assing the trade-off, or the compromise between returns and risk:

The 60/40 portfolio has a better Ratio of Sharpe than the 100% stocks or 100% bonds in the longest periods.


