• About us
    • Who we are
    • Mission
  • Contacts
  • English
    • Português (Portuguese (Portugal))
    • Español (Spanish)
    • Français (French)
  • Login
Investorpolis
[xyz-ips snippet="Banners-Publicitarios"]
No Result
View All Result
No Result
View All Result
Investorpolis
No Result
View All Result
Home Investing Series Guide

Simple Portfolio Series (DIY) Part 2: The Traditional Portfolio 60/40, what it is, for whom, and its performance

28 de January, 2023
in Investing Series Guide, VIII. Successful Investing
Reading Time: 6 mins read
0 0
0
Simple Portfolio Series (DIY) Part 2: The Traditional Portfolio 60/40, what it is, for whom, and its performance
Share on FacebookShare on Twitter

In the initial article of this series we gave an overview of the simple portfolios, describing their characteristics, their advantages and uses, and presented the developments foreseen for the following articles.

In this article we will address the traditional portfolio 60/40, consisting of 60% stocks and 40% bonds.

Jack Bogle, the founder of Vanguard Group, the world’s largest investment fund manager, said all we need is to maintain an investment portfolio of 60% stocks and 40% bonds for life. And he maintained this allocation for years.

What is the traditional 60/40 portfolio?

To whom is the 60/40 portfolio for?

What is the performance of the 60/40 portfolio?

What is the traditional 60/40 portfolio?

The traditional portfolio 60/40 consists of an investment portfolio that combines the exposure of 60% in stocks and 40% in bonds.

It is the most used portfolio, most recommended and also most discussed by financial advisors and other investment management specialists.

Therefore, this portfolio is also known as the traditional portfolio.

To whom is the 60/40 portfolio for?

The 60/40 portfolio is a portfolio considered suitable for all circumstances because it balances very simply the profitability and risks of the main assets, stocks and bonds.

The 60/40 investment portfolio has long been revered as a reliable guide for a moderate venture investor —a 60% allocation to stocks intended to provide capital appreciation, and a 40% allocation to bonds to potentially deliver income and risk mitigation.

Therefore, it is the most recommended portfolio for life for the generality of investors.

This scope of adequacy and market is its main advantage.

What is the performance of the 60/40 portfolio?

Next, we will develop in more detail the returns and risks of this portfolio, comparing it with two alternative portfolios, those of 100% investment in stocks and bonds.

We have used U.S. market information from 1926 to date, namely the performance of the S&P 500 for stocks and 10-year treasury bonds for bonds.

The following chart shows the historical performance of the 60/40 portfolio since 1926, comparing an investment of $100 dollars in 60% of S&P 500 stocks and 40% of U.S. 10-year treasury bonds, with the same investment in 100% of those stocks and 100% of those bonds:

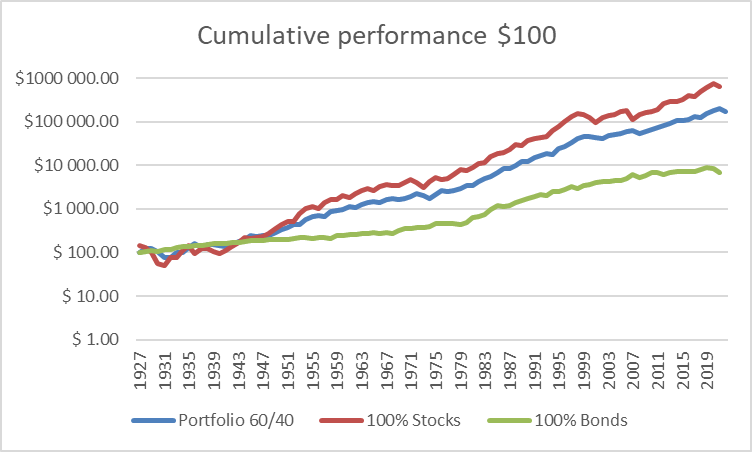
The investment of $100 in 1927 in the 60/40 portfolio would have generated a capital of $168,814 in 2022, compared to $624,670 in 100% in shares and $7,006 in 100% in bonds.

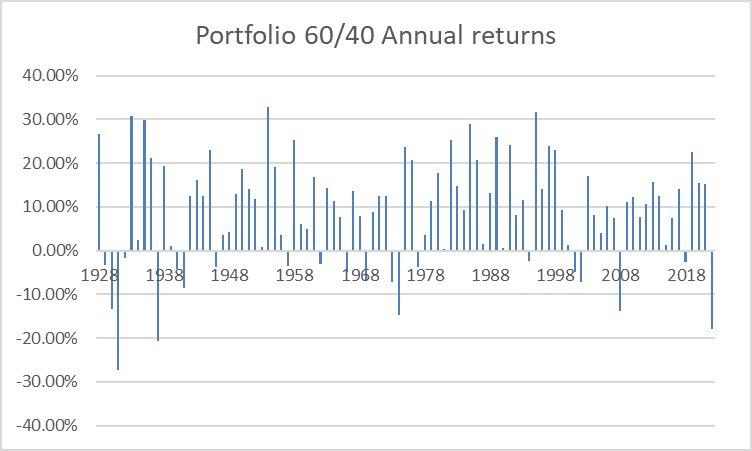
The following graph shows the annual returns of this portfolio:

The following table shows the average annual rate of return of each of these investments, calculated in arithmetic (simple average) and geometric (composite average) terms, for the entire period between 1927 and 2022, as well as that of the last 10 and 30 years:

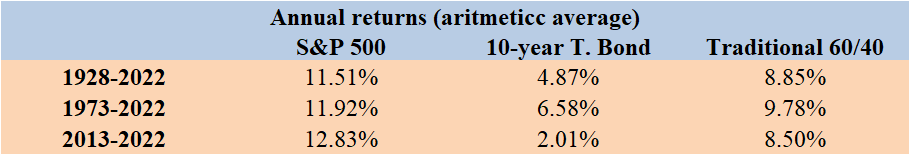
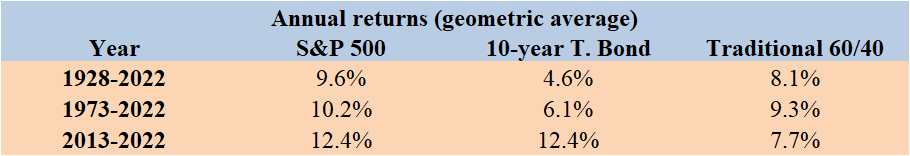
Since 1927, the 60/40 portfolio has had an annualized return of 8.9%.

In this period, these rates exceeded those of 100% investment in treasury bonds by 3.9% and fell short of stocks by 3.6%.

In its best year, in 1993, it recorded returns of 36.7%, while in its worst year, 1931, it recorded a loss of 26.6%.

The most recent returns show similar results.

Over the past 30 years, between 1973 and 2022, a 60/40 portfolio consisting of an S&P 500 index for stocks and 10-year treasury bonds had an average annual return of 9.8% with a standard deviation of 11.5%.

In the last decade, the 60/40 portfolio had an average annual return of 8.5%.

The following table shows the average annual rates of return for each decade between 1927 and 2022 for the same investments:

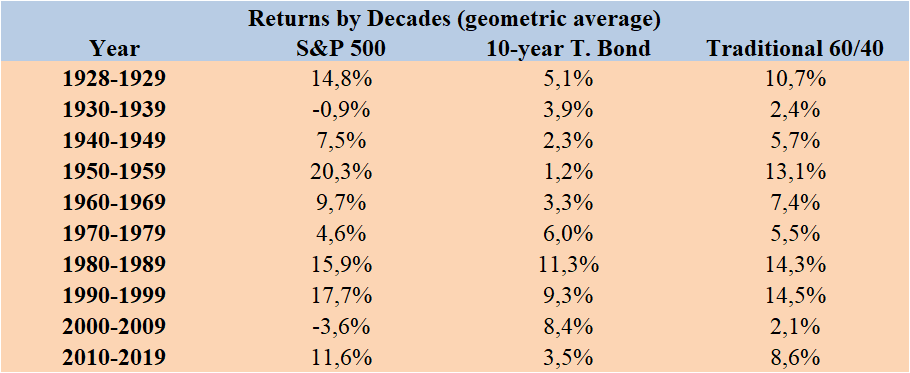
As you would expect, average rates of return have shown some dispersion over the decades.

The best decades were eighties, ninetys and fifty, while the worst were the first of two thousand, those of thirty, forty and seventy.

Moving on to the risks, we start by seeing the percentages of the positive and negative years of investment in the 60/40 portfolio, and in the investments of 100% in stocks and bonds:

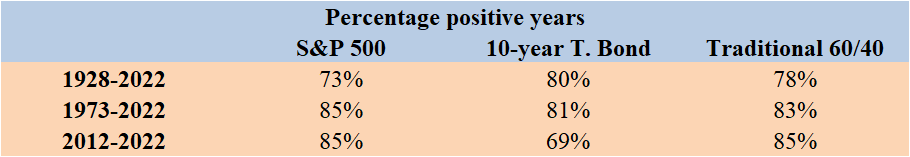
Over these 96 years, the portfolio has lost value in 20 years, that is, almost 80% of the years were positive.

The following graph shows the drawdown – the largest possible capital devaluation as a percentage, calculated by comparing the value reached at the last peak with that of the current value of the portfolio at each moment – of the 3 investments under analysis between 1927 and 2022:

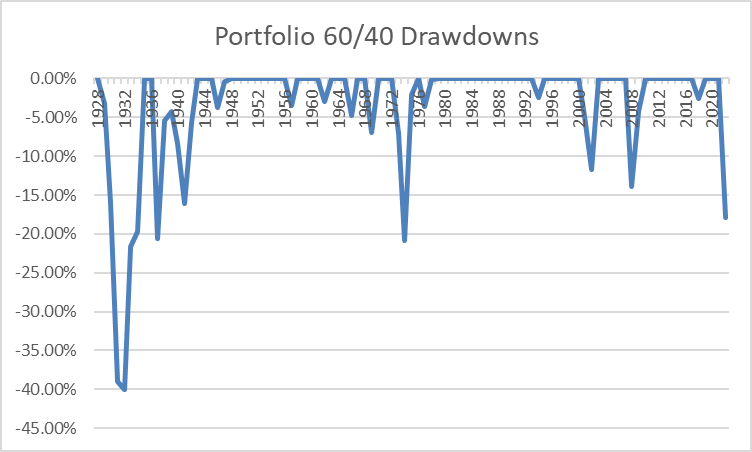
The “dradwdown” of the 60/40 portfolio only exceeded 20% in the periods of the Great Depression and the oil crisis of 70.

The largest recent drawdowns were in the 2008 GFC and the 2000 technology bubble.

Overall, recoveries of losses that occurred were rapid, with the exception of the Great Depression

The following table shows the standard deviations of portfolio 60/40 and 100% investments in stocks and bonds between 1927 and 2022, as well as for the last 10 and 30 years:

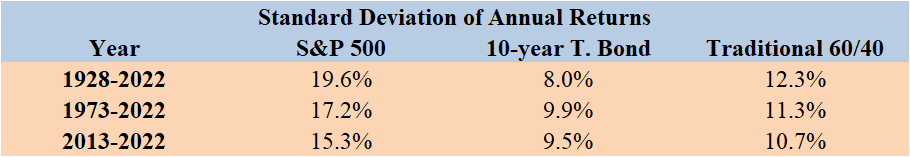
What also impresses a lot is the decrease in risk, or volatility, provided by the portfolio. The average annual standard deviation was 12% in the last 95 years, which compare with almost 20% of a 100% portfolio in stocks and 7.7% of a 100% portfolio in bonds.

The following chart shows the rates of return for 10-year investment periods (called “rolling returns” or moving averages) of the 60/40 portfolio and of 100% investments in stocks and bonds:

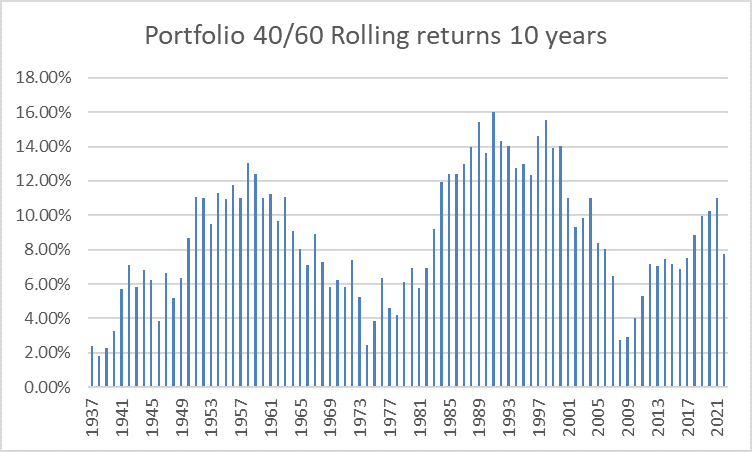
The average annual returns for 10-year periods were very interesting.

There have never been periods with negative yields, with lows exceeding +2% per year at the beginning of seventy-2008-09, and highs of more than 15% per year.

Finally, the following table contains the Sharpe ratio, the quotient between average annual returns and annual standard deviation and which assing the trade-off, or the compromise between returns and risk:

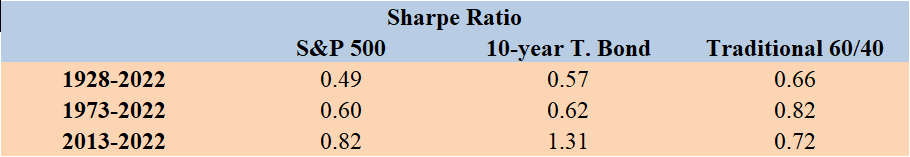
The 60/40 portfolio has a better Ratio of Sharpe than the 100% stocks or 100% bonds in the longest periods.

Previous Post

Simple or Lazy Portfolio Series (DIY): Part 1 – Overview

Next Post

Outlook 2023: Part 1 – 2022 was a bad year for investments, but we can’t lose the medium and long-term perspective

Feria

Feria

Related Posts

Asset allocation by economic cycles, and the importance of age in asset allocation
Investing Series Guide

Asset allocation by economic cycles, and the importance of age in asset allocation

11 de August, 2024
The 4 Financial Asset Allocation Strategies Used by Individual Investors
Investing Series Guide

The 4 Financial Asset Allocation Strategies Used by Individual Investors

11 de August, 2024
Investing in Secular Stocks Series: Part 4.3 – Relationship between ROIC and the PER and PEG market multiples
Investing Series Guide

Investing in Secular Stocks Series: Part 4.3 – Relationship between ROIC and the PER and PEG market multiples

4 de July, 2024
Investing in Secular Stocks Series: Part 4.2 – The Importance of ROIC in Fundamental Valuation
Investing Series Guide

Investing in Secular Stocks Series: Part 4.2 – The Importance of ROIC in Fundamental Valuation

4 de July, 2024
Investing in index funds or products: The S&P 500 Equal-Weight, as an alternative to the S&P 500
Investing Series Guide

Investing in index funds or products: The S&P 500 Equal-Weight, as an alternative to the S&P 500

20 de June, 2024
Individual investors have a too short time horizon, and this short-sightedness comes at a high cost
Investing Series Guide

Individual investors have a too short time horizon, and this short-sightedness comes at a high cost

14 de June, 2024
Next Post
Outlook 2023: Part 1 – 2022 was a bad year for investments, but we can’t lose the medium and long-term perspective

Outlook 2023: Part 1 - 2022 was a bad year for investments, but we can't lose the medium and long-term perspective

Leave a Reply

Your email address will not be published. Required fields are marked *

Trending

Effects of Trump’s Trade Tariffs on Financial Investments Series: P1 – Framework

Effects of Trump’s Trade Tariffs on Financial Investments Series: P1 – Framework

8 de May, 2025
Series Investments in the Artificial Intelligence Cycle: Part 2 – The main branches of AI

Series Investments in the Artificial Intelligence Cycle: Part 2 – The main branches of AI

29 de April, 2025
2Q25 Financial Markets Outlook: Zombieconomics, or the monumental cost of Trump’s astronomical reciprocal tariffs

2Q25 Financial Markets Outlook: Zombieconomics, or the monumental cost of Trump’s astronomical reciprocal tariffs

4 de April, 2025
Thematic Investments Series: Part 3. What are the main megatrends?

Thematic Investments Series: Part 3. What are the main megatrends?

28 de March, 2025
Investorpolis

We developed this blog because we believe that only a small learning effort is needed to make a big change in the decisions and results of our investments and financial assets.

Main categories

  • Investing Series Guide
  • Wealth and Investing
  • Retirement & Savings
  • Tools
  • More

Newsletter

Sign to our mailing list to receive updates direct to your inbox!

*We don’t spam

  • Privacy Policy
  • Cookie Policy
  • Contacts

© 2021 - Investorpolis / Powered by Delta Soluções

  • pt-pt Português
  • fr Français
  • es Español
  • en English
  • Home
  • Investing Series Guide
    • I. Goal Based Investing
    • II. Compounding & Inflation
    • III. Assets Risks & Returns
    • IV. Efficient Diversification
    • IX. Sustainable Investing and ESG
    • V. The Investor
    • VI. Assets and Investments
    • VII. Index Funds
    • VIII. Successful Investing
    • X. Kits and Tips
    • XI. Other Topics
  • Retirement & Savings
    • Retirement
    • Savings
  • Wealth and Investing
    • Investing
    • Wealth
  • Tools
    • Calculators
    • Publications
    • Sites and apps
  • More
    • Best of
    • Reviews
    • Snapshots
    • Others
  • About us
    • Who we are
    • Mission
  • Login
  • Cart

© 2021 - Investorpolis / Powered by Delta Soluções

Welcome Back!

Login to your account below

Forgotten Password?

Retrieve your password

Please enter your username or email address to reset your password.

Log In
We use cookies on our website to give you the most relevant experience by remembering your preferences and repeat visits. By clicking “Accept All”, you consent to the use of ALL the cookies. However, you may visit "Cookie Settings" to provide a controlled consent.
Cookie configurationCookie PolicyAcceptReject
Manage consent

Privacy Overview

This website uses cookies to improve your experience while you navigate through the website. Out of these, the cookies that are categorized as necessary are stored on your browser as they are essential for the working of basic functionalities of the website. We also use third-party cookies that help us analyze and understand how you use this website. These cookies will be stored in your browser only with your consent. You also have the option to opt-out of these cookies. But opting out of some of these cookies may affect your browsing experience.
Advertisement
Advertisement cookies are used to provide visitors with relevant ads and marketing campaigns. These cookies track visitors across websites and collect information to provide customized ads.
Analytics
Analytical cookies are used to understand how visitors interact with the website. These cookies help provide information on metrics the number of visitors, bounce rate, traffic source, etc.
Functional
Functional cookies help to perform certain functionalities like sharing the content of the website on social media platforms, collect feedbacks, and other third-party features.
Necessary
Necessary cookies are absolutely essential for the website to function properly. These cookies ensure basic functionalities and security features of the website, anonymously.
Others
Other uncategorized cookies are those that are being analyzed and have not been classified into a category as yet.
Performance
Performance cookies are used to understand and analyze the key performance indexes of the website which helps in delivering a better user experience for the visitors.
SAVE & ACCEPT

Add New Playlist

Are you sure want to unlock this post?
Unlock left : 0
Are you sure want to cancel subscription?