• About us
    • Who we are
    • Mission
  • Contacts
  • English
    • Português (Portuguese (Portugal))
    • Español (Spanish)
    • Français (French)
  • Login
Investorpolis
[xyz-ips snippet="Banners-Publicitarios"]
No Result
View All Result
No Result
View All Result
Investorpolis
No Result
View All Result
Home Wealth and Investing Investing

Investing in Large, Medium or Small Caps: Part 4 – The Valuation of Equity Capitalization Classes

27 de November, 2023
in Investing, Wealth and Investing
Reading Time: 5 mins read
0 0
0
Investing in Large, Medium or Small Caps: Part 4 – The Valuation of Equity Capitalization Classes
Share on FacebookShare on Twitter

The valuation of the capitalization classes of stocks

The factors that most influence stocks performance cycles by capitalization are economic growth, interest rates, and overall market risks

This is the fourth article on investing in subclasses of capitalization of company shares.

In the first one, we saw that, contrary to what many people think, small and mid-cap stocks have provided the highest returns in the very long term.

In the second article, we analyzed the differentiated characteristics of each subclass or capitalization segments and the advantages and disadvantages of investing in each strategy or market segment.

In the third article, we analyzed the differentiated behavior of the equity market capitalization segments throughout the various economic cycles.

In this article, we will discuss the fluctuation bands and the determining factors of the valuation of equity capitalization segments.

In the Tools folder we have developed in detail some of the main indices of the world stock markets with the largest market capitalizations, namely the MSCI ACWI for the world market, the Dow Jones IA 30, S&P 500 and the Nasdaq in the US, and in Europe, the Eurostoxx 50 and the FTSE 100).

We also include the Russell 2000 index of U.S. small and mid-caps.

The valuation of the capitalization classes of stocks

To get an idea of the valuation of the subclasses of the shares in terms of capitalization, we will use the evolution of the multiples of the PER ratio of each subclass over time.

The following chart shows the evolution of the Schiller PER of US large-cap (S&P 100) and small-cap (S&P 600) stocks between 1983 and 2018:

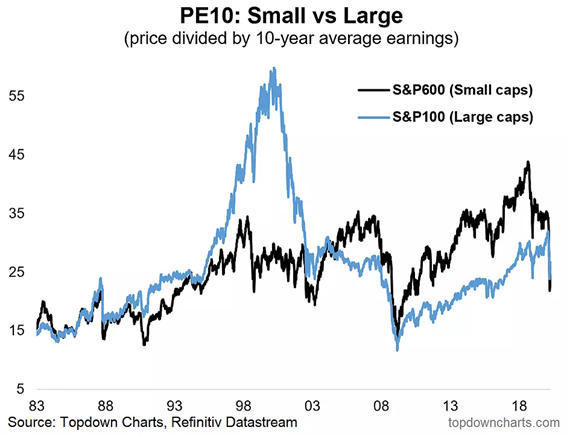
Between 1983 and 1992, the PER of the two capitalization segments had the same values, between 15x and 25x, but from 1993 onwards the ratio of small caps skyrocketed and reached 55x in the technology bubble (versus 35x in large caps).

Between 2001 and 2007 the two ratios stabilized at around 25x to 30x, having fallen to almost 10x at the lows of the subprime crisis.

Since 2009, the leadership has shifted, with large caps (between 25x and 35x) having higher PERs than small caps until the pandemic in 2020 (15x to 25x).

The Schiller PER (CAPE), or adjusted to the economic cycle based on the normalization of results using the average of the last 10 years, is more useful because by doing this smoothing it makes the analysis more robust due to the greater volatility of the results of small caps.

However, it has the disadvantage of being a less available indicator, and therefore less used than the traditional PER.

The following chart compares the evolution of the traditional forward PER for small, medium, large, and even mega-cap S&P indices since 2007 (the 8 largest companies):

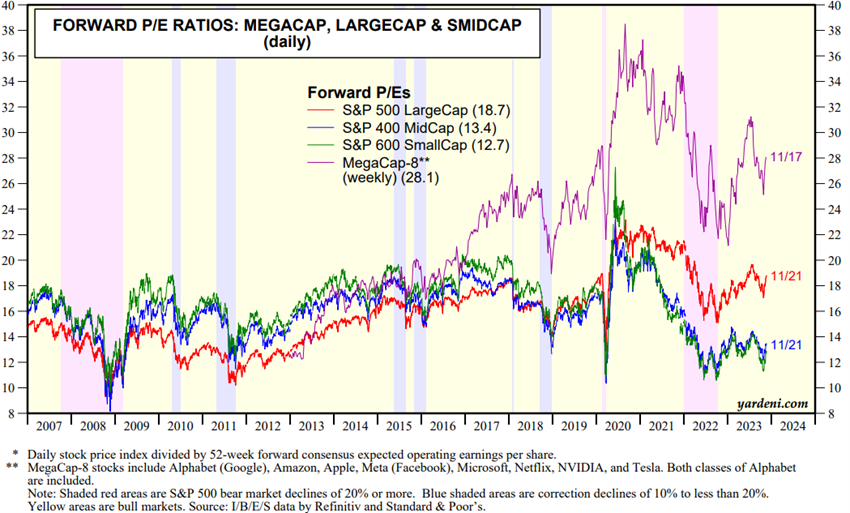
In the initial period, small and mid-caps quoted the PER higher by about +2x to +3x than large caps (16x versus 14x on average), but from 2015 onwards the situation was reversed, mainly due to the effect of the very high PER of mega-caps.

Today, large caps (S&P 500) have a PER of 18.6x, while the PER of small caps (S&P 600 SmallCap) is 12.7x and that of mid-caps (S&P 400 MidCap) is 13.4x, while that of 8 MegaCaps is 27.6x).

We can draw the same conclusion about the PER behaviors of the different capitalizations by using the Morningstar indices instead of the S&P:

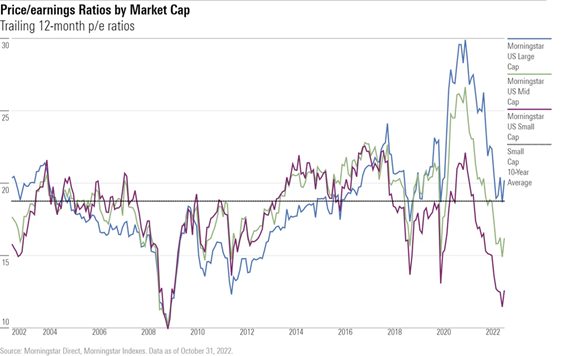
What these two graphs above also show is that there is currently a large PER discrepancy unfavorable to small and mid-caps.

This discrepancy becomes even clearer when we use a longer story, albeit with different action universes.

Leuthold tracks about 3000 U.S. stocks and aggregates them into the “small caps” and “large caps” subclasses.

The evolution of the ratio of PER multiples of small-cap and large-cap stocks in the US since 1979 has been as follows:

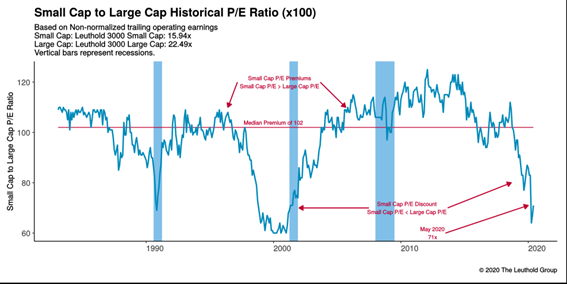
During this period, the median PER premium was 102 in favour of small caps.

In May 2020, the average PER for small caps was 16x and that of large caps was 22.5x, a discount of around 71% for small caps that already came from 2018 and was greatly aggravated by the pandemic.

The performance gap between small caps and large caps has been widening to historic lows, a trend seen in times of economic stress and investor caution, possibly signaling that the economy could worsen.

At this stage, large-caps are delivering much better earnings growth than small-caps.

The factors that most influence stocks performance cycles by capitalization are economic growth, interest rates, and overall market risks

When small- and mid-cap stocks start underperforming large stocks of this magnitude, it usually also means that investors are worried.

In this situation, investors focus on large companies that are easy to trade with and discard smaller companies generally considered riskier, especially if they believe there could be a recession.

This is due to the fact that US small caps are more exposed to the domestic market and are therefore more sensitive to changes in economic growth.

Investors also prefer large-caps in times of economic uncertainty because small-caps have more debt.

Small caps have worse debt-to-equity and net debt-to-EBITDA ratios, and are more sensitive to interest rates.

Previous Post

Investing in Small, Medium or Large Caps: Part 3 – The market cycles of stocks capitalization segments

Next Post

Financial Markets Outlook 2024 from the world’s largest investment banks: Disparity in forecasts for U.S. economic growth results in projections for the S&P 500 between 4,500 and 5,000 points, with interest rates on 10-year U.S. bonds below 4%

Feria

Feria

Related Posts

Effects of Trump’s Trade Tariffs on Financial Investments Series: P1 – Framework
Investing

Effects of Trump’s Trade Tariffs on Financial Investments Series: P1 – Framework

8 de May, 2025
Series Investments in the Artificial Intelligence Cycle: Part 2 – The main branches of AI
Investing

Series Investments in the Artificial Intelligence Cycle: Part 2 – The main branches of AI

29 de April, 2025
2Q25 Financial Markets Outlook: Zombieconomics, or the monumental cost of Trump’s astronomical reciprocal tariffs
Investing

2Q25 Financial Markets Outlook: Zombieconomics, or the monumental cost of Trump’s astronomical reciprocal tariffs

4 de April, 2025
Thematic Investments Series: Part 3. What are the main megatrends?
Investing

Thematic Investments Series: Part 3. What are the main megatrends?

28 de March, 2025
Thematic Investments Series: Part 2.2. Disruptive technology or innovation – The domains of disruptive technology or innovation
Investing

Thematic Investments Series: Part 2.2. Disruptive technology or innovation – The domains of disruptive technology or innovation

17 de March, 2025
Investments in the Artificial Intelligence Cycle Series: Part 1 – Definition and History of Development
Investing

Investments in the Artificial Intelligence Cycle Series: Part 1 – Definition and History of Development

20 de February, 2025
Next Post
Financial Markets Outlook 2024 from the world’s largest investment banks: Disparity in forecasts for U.S. economic growth results in projections for the S&P 500 between 4,500 and 5,000 points, with interest rates on 10-year U.S. bonds below 4%

Financial Markets Outlook 2024 from the world's largest investment banks: Disparity in forecasts for U.S. economic growth results in projections for the S&P 500 between 4,500 and 5,000 points, with interest rates on 10-year U.S. bonds below 4%

Leave a Reply

Your email address will not be published. Required fields are marked *

Trending

Effects of Trump’s Trade Tariffs on Financial Investments Series: P1 – Framework

Effects of Trump’s Trade Tariffs on Financial Investments Series: P1 – Framework

8 de May, 2025
Series Investments in the Artificial Intelligence Cycle: Part 2 – The main branches of AI

Series Investments in the Artificial Intelligence Cycle: Part 2 – The main branches of AI

29 de April, 2025
2Q25 Financial Markets Outlook: Zombieconomics, or the monumental cost of Trump’s astronomical reciprocal tariffs

2Q25 Financial Markets Outlook: Zombieconomics, or the monumental cost of Trump’s astronomical reciprocal tariffs

4 de April, 2025
Thematic Investments Series: Part 3. What are the main megatrends?

Thematic Investments Series: Part 3. What are the main megatrends?

28 de March, 2025
Investorpolis

We developed this blog because we believe that only a small learning effort is needed to make a big change in the decisions and results of our investments and financial assets.

Main categories

  • Investing Series Guide
  • Wealth and Investing
  • Retirement & Savings
  • Tools
  • More

Newsletter

Sign to our mailing list to receive updates direct to your inbox!

*We don’t spam

  • Privacy Policy
  • Cookie Policy
  • Contacts

© 2021 - Investorpolis / Powered by Delta Soluções

  • pt-pt Português
  • fr Français
  • es Español
  • en English
  • Home
  • Investing Series Guide
    • I. Goal Based Investing
    • II. Compounding & Inflation
    • III. Assets Risks & Returns
    • IV. Efficient Diversification
    • IX. Sustainable Investing and ESG
    • V. The Investor
    • VI. Assets and Investments
    • VII. Index Funds
    • VIII. Successful Investing
    • X. Kits and Tips
    • XI. Other Topics
  • Retirement & Savings
    • Retirement
    • Savings
  • Wealth and Investing
    • Investing
    • Wealth
  • Tools
    • Calculators
    • Publications
    • Sites and apps
  • More
    • Best of
    • Reviews
    • Snapshots
    • Others
  • About us
    • Who we are
    • Mission
  • Login
  • Cart

© 2021 - Investorpolis / Powered by Delta Soluções

Welcome Back!

Login to your account below

Forgotten Password?

Retrieve your password

Please enter your username or email address to reset your password.

Log In
We use cookies on our website to give you the most relevant experience by remembering your preferences and repeat visits. By clicking “Accept All”, you consent to the use of ALL the cookies. However, you may visit "Cookie Settings" to provide a controlled consent.
Cookie configurationCookie PolicyAcceptReject
Manage consent

Privacy Overview

This website uses cookies to improve your experience while you navigate through the website. Out of these, the cookies that are categorized as necessary are stored on your browser as they are essential for the working of basic functionalities of the website. We also use third-party cookies that help us analyze and understand how you use this website. These cookies will be stored in your browser only with your consent. You also have the option to opt-out of these cookies. But opting out of some of these cookies may affect your browsing experience.
Advertisement
Advertisement cookies are used to provide visitors with relevant ads and marketing campaigns. These cookies track visitors across websites and collect information to provide customized ads.
Analytics
Analytical cookies are used to understand how visitors interact with the website. These cookies help provide information on metrics the number of visitors, bounce rate, traffic source, etc.
Functional
Functional cookies help to perform certain functionalities like sharing the content of the website on social media platforms, collect feedbacks, and other third-party features.
Necessary
Necessary cookies are absolutely essential for the website to function properly. These cookies ensure basic functionalities and security features of the website, anonymously.
Others
Other uncategorized cookies are those that are being analyzed and have not been classified into a category as yet.
Performance
Performance cookies are used to understand and analyze the key performance indexes of the website which helps in delivering a better user experience for the visitors.
SAVE & ACCEPT

Add New Playlist

Are you sure want to unlock this post?
Unlock left : 0
Are you sure want to cancel subscription?