400 million Chinese people are behind the growth of the world’s middle class in recent years, save like no one and still invest mainly in real estate and banking products
China’s global importance and economic weight
Chinese households’ wealth, middle class, and savings rate
Chinese households’ assets allocation
China’s size and influence worldwide, as well as its rapid economic development over the last 30 to 40 years, from Deng Xiaoping’s opening movement to the present day, comparable only to the 200 years that followed the Industrial Revolution in Europe and the USA, make it essential to know something in the perspective of managing our wealth and financial investments.
It is important to do so from two different angles: from an internal or inside-out point of view, in order to know the situation and behaviour of governments, companies and especially households in relation to financial markets, and from an external point of view or from the outside, to know how the international community perceives the Chinese capital market.
In this article we will look at the internal perspective.
China’s global importance and economic weight
China is by now the second largest economy in the world just after the US, but it is the world’s largest economy in terms of purchasing power parity, surpassing the US.
In 2018, its GDP reached $13.4 trillion and the US $20.5 trillion. That same year, in terms of purchasing power parity, Chinese GDP was $25.3 trillion and the U.S. $20.5 trillion.
It should be recalled that in 1980 China was only the 7th largest economy with a GDP of $305.3 billion, and that of the US was $2.9 trillion.
In 1978, China began a process of market reforms, moving from being a closed economy and centrally planned to becoming a global industrial and export economic centre, with growth of 10% per year. Today China is already much more than the world factory, by the growth of the weight of the services sector.
The following chart highlights the extraordinary Chinese economic developments in recent decades, which is best highlighted when we compare it with the USA and India:
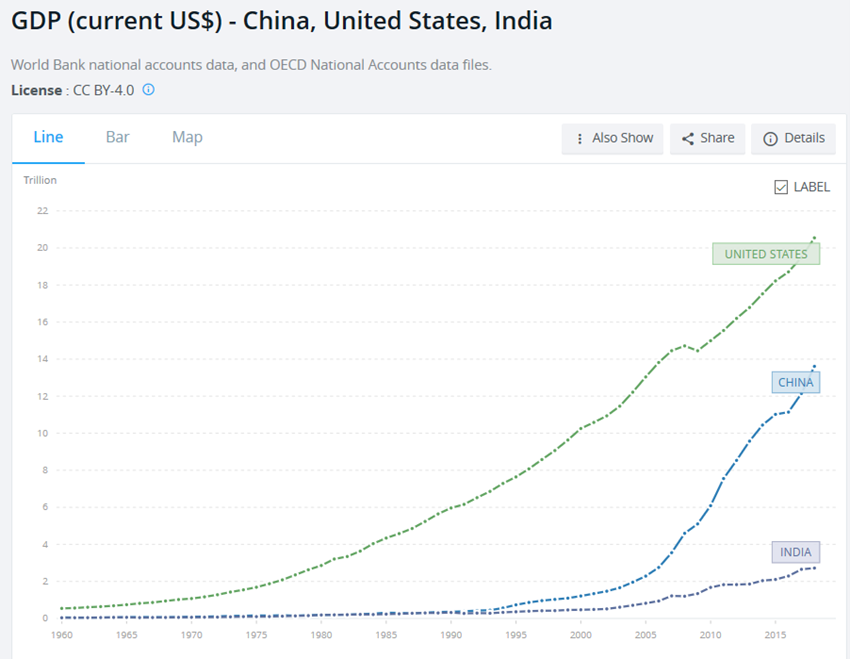
China has experienced GDP growth in the last 30 to 40 years only comparable to the 200 years of the economies of the industrial revolution, moving in stride from the US, the largest economic power since 1871.
Its output growth rates are remarkable:
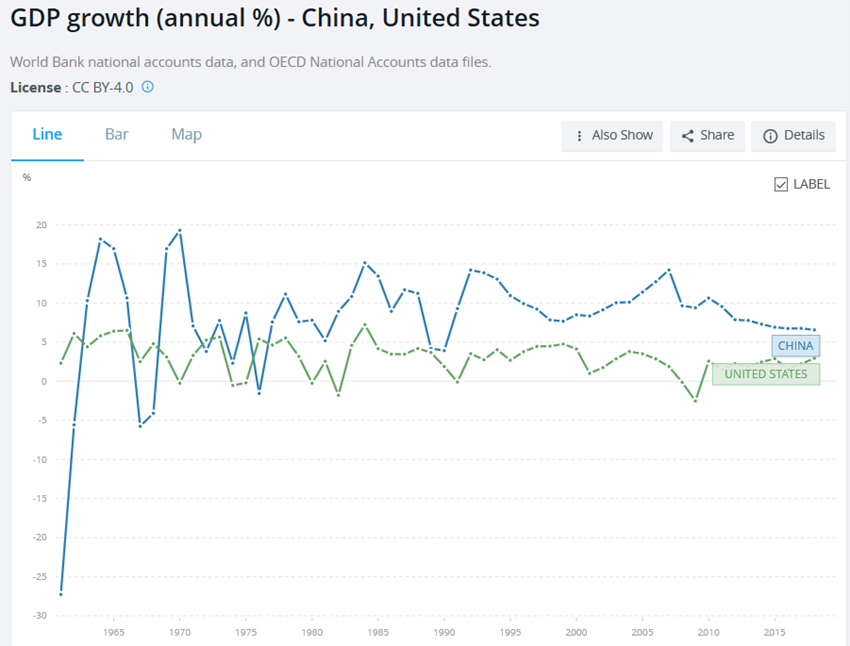
Since 1978, China growth has surpassed the US every year, with average levels of 10% per year.
China’s importance also turns out to be the world’s most populous economy:
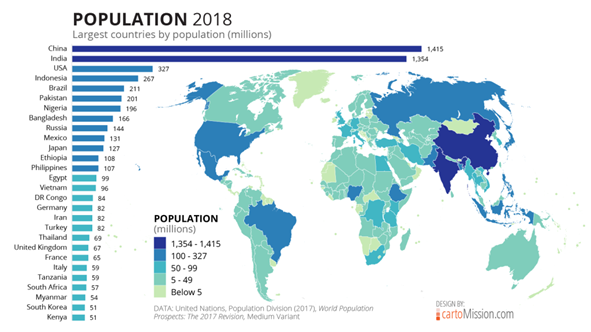
China has 1.4 billion inhabitants, almost 5 times more than the US.
The growth of the GDP has been much higher than that of the population so the GDP per capita the situation has also evolved positively:
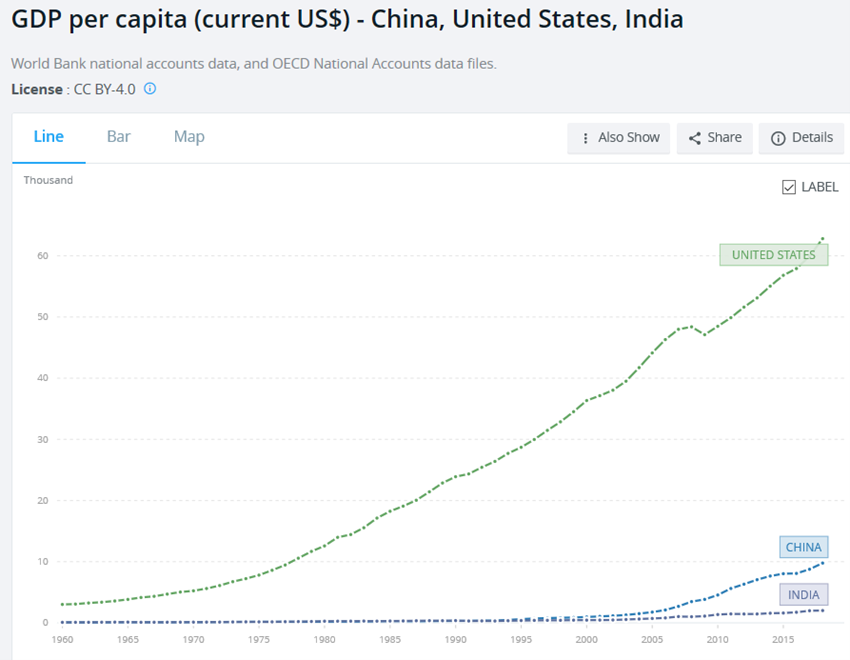
China has had a very remarkable pace of GDP per capita growth, currently approaching $8,000.
The following two charts praise the average wealth growth in China with other fast-growing countries and large regions during the 2000-2017 period in terms of current and constant exchange rates:
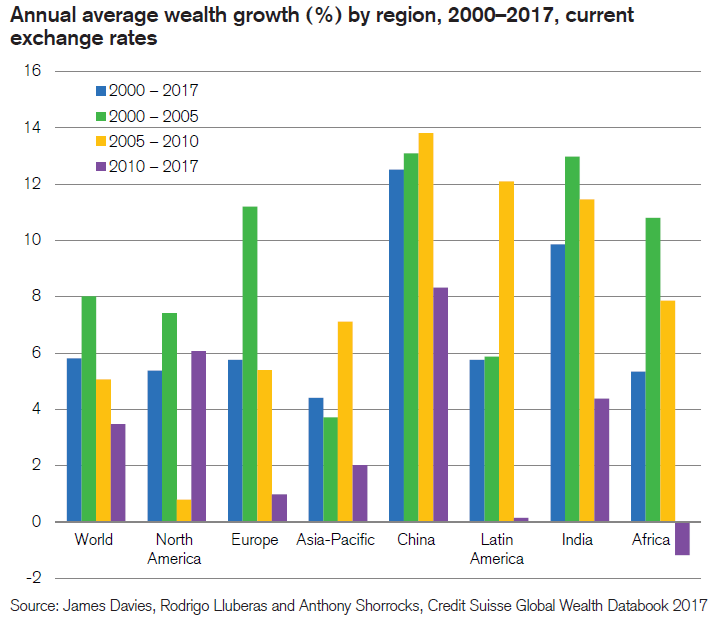
The wealth average growth rate in China at current rates in these 17 years was more than 8% per year, well above the 6% per year in North America, India’s 4% per year of 1% per year in Europe and just over 3.5% per year in the world.
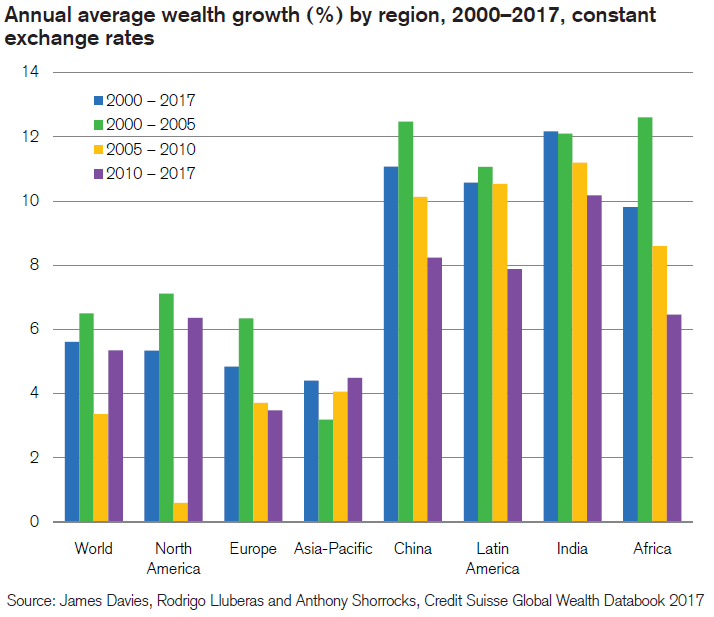
At constant rates, the wealth average growth rate in China in the period was 8% per year, surpassed by 10% per year in India and with Latin America almost on par, remaining 6% per year in North America, rising Europe to 3.8% per year and the World to almost 5.5% per year.
Chinese households’ wealth, middle class, and savings rate
In the following chart we see the distribution of wealth by households in China, India, and the USA:
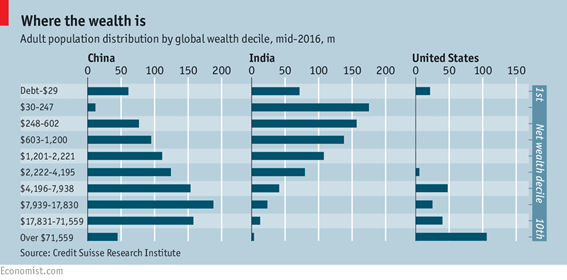
China has 400 million people with an average wealth above $8,000, and more than $200 million with wealth above $18,000.
The growth of the world’s middle class in recent years is mainly due to China:
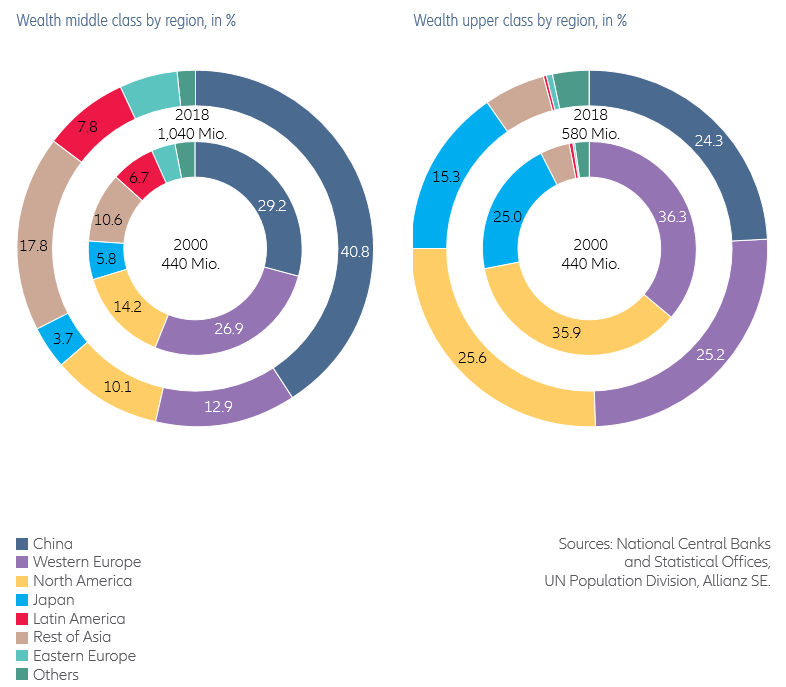
The world middle class (understood as households with net financial assets between 30% and 180% of their world average value of €25,360, i.e. €7,600, and €45,600) went from €440 million in 2000 to €1,040 million in 2018; 40% of this middle class lives in China, corresponding to more than 400 million people.
The upper middle class includes households with net financial assets above the upper limit, i.e. €45,600. Almost 25% of the 580 million families live in China, equivalent to 150 million.
Chinese households have extremely high savings rates:
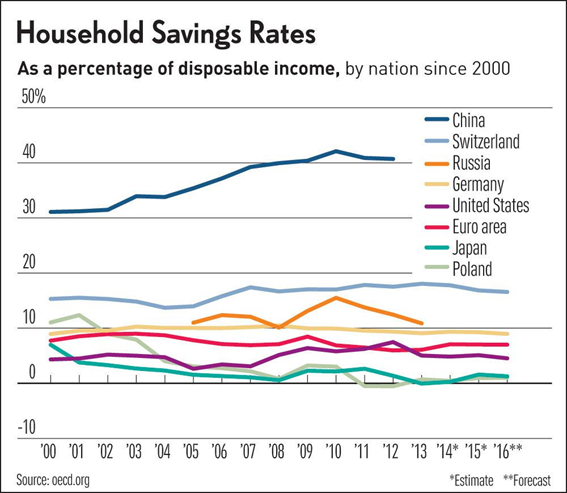
Household savings rates in China are around 40%, twice the value of the most saving developed country, Switzerland, and much higher than the 2% to 10% of the other more advanced countries.
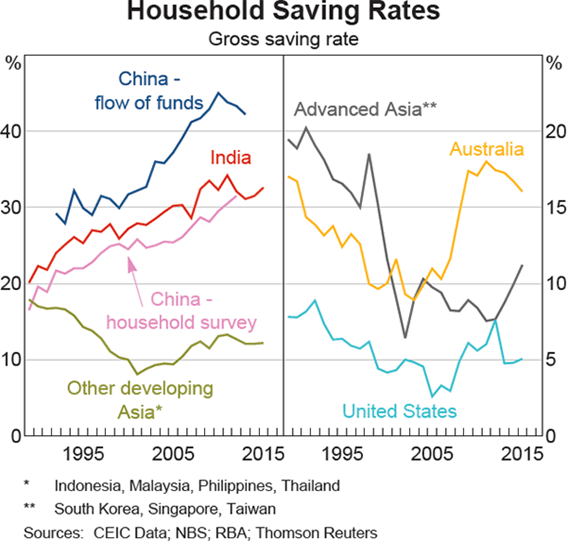
Chinese families save more than other Asian countries with the exception of Singapore, above the more advanced ones such as South Korea, and Taiwan, as well as developing ones such as Indonesia, Malaysia, the Philippines, and Thailand.
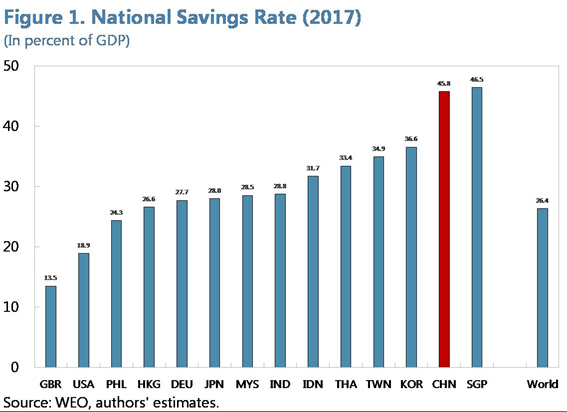
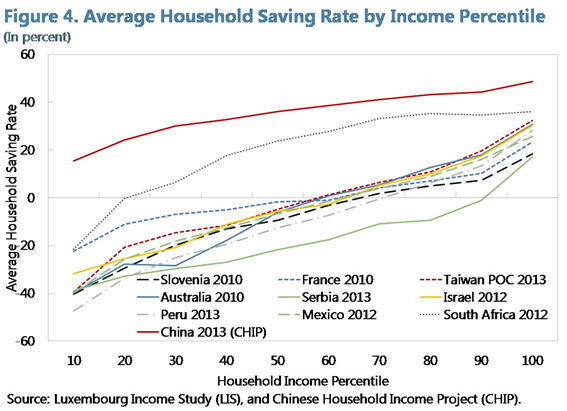
Many studies have been done to find explanations for these high household savings rates, with the following conclusions:
- Demographic factors combined with the life cycle: a one child policy decreases consumption needs and increases savings to live old age, and the gender imbalance leads families to save to compete for the best marriage dowry.
- Preventive reasons: the uncertainty of employment and income arising from the change to a market economy, the doubts about pensions brought about by the reform of the pension system and the reduction of social protection, and the increase in education and health expenditure;
- The huge desire to own a home and the strong increase of house prices from the opening of the housing market to private initiative.
Chinese households’ assets allocation
These savings are channelled mainly towards the purchase of housing or real estate assets, to the detriment of financial markets:
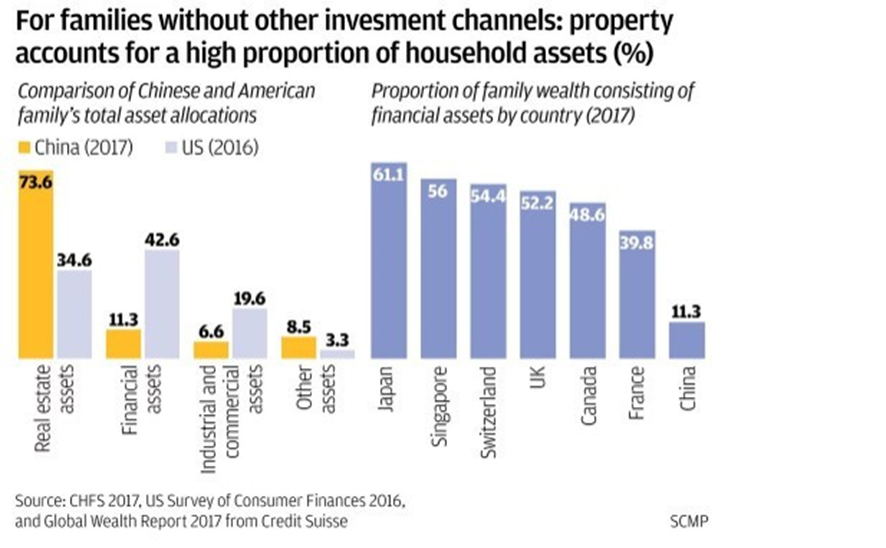
Chinese households have almost 74% of their wealth in real estate assets and only 11% in financial assets, compared with 34% in real estate and 42% in financial assets of US households.
It follows that China is one of the countries with the highest rate of housing ownership:
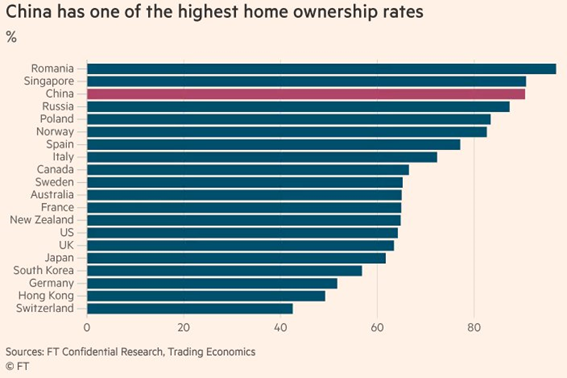
Almost 90% of Chinese households own their housing.
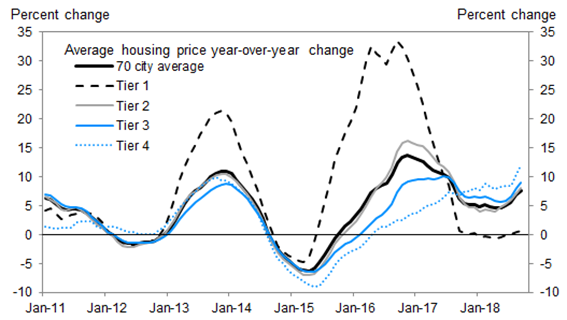
In recent years, house prices in China have risen at rates of more than 10% a year in major cities.
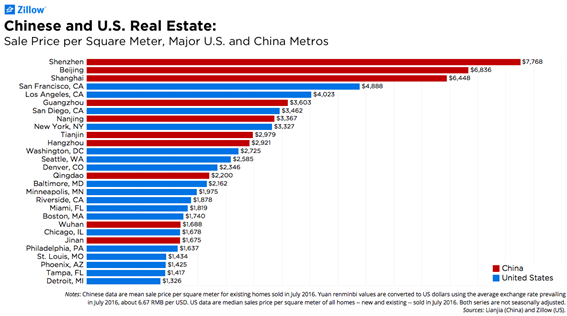
The price per square meter of housing in major Chinese cities exceeds those of the largest North American cities.
China is still far from the per capita financial asset levels of other countries in the region:
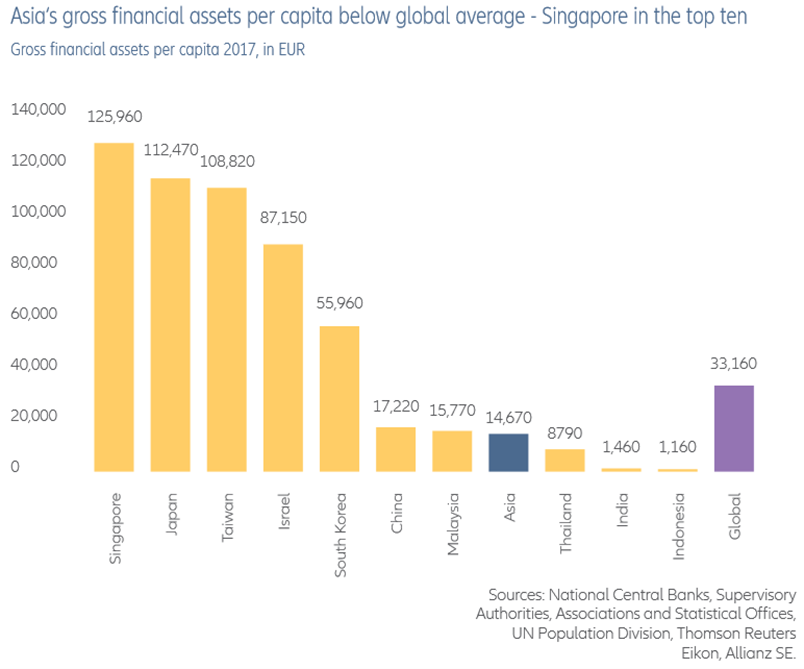
Gross financial assets per capita in China are $17,220, higher than the Asian average of $14,670, but much lower than Singapore’s $125,960, Taiwan’s $87,100, or South Korea’s $55,960.
In terms of the composition of these financial assets, the situation is not so different from that of the other countries in the region:
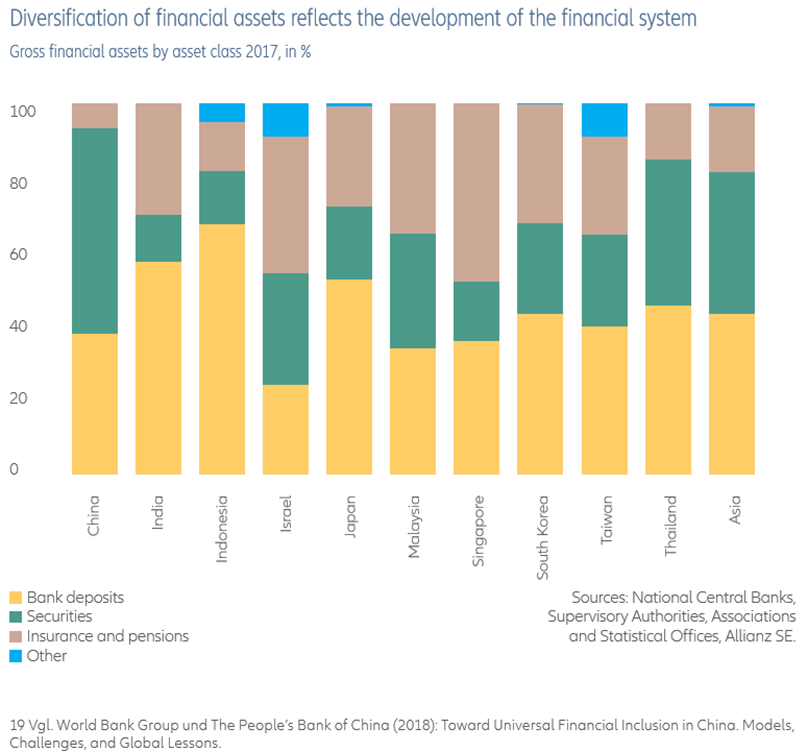
The higher percentage of securities is misleading because, in fact, they are banking investment products, in some cases with guarantees given by banks, so what is predominant are deposits.
In the last 17 years the evolution of the Chinese stock market has been quite positive:
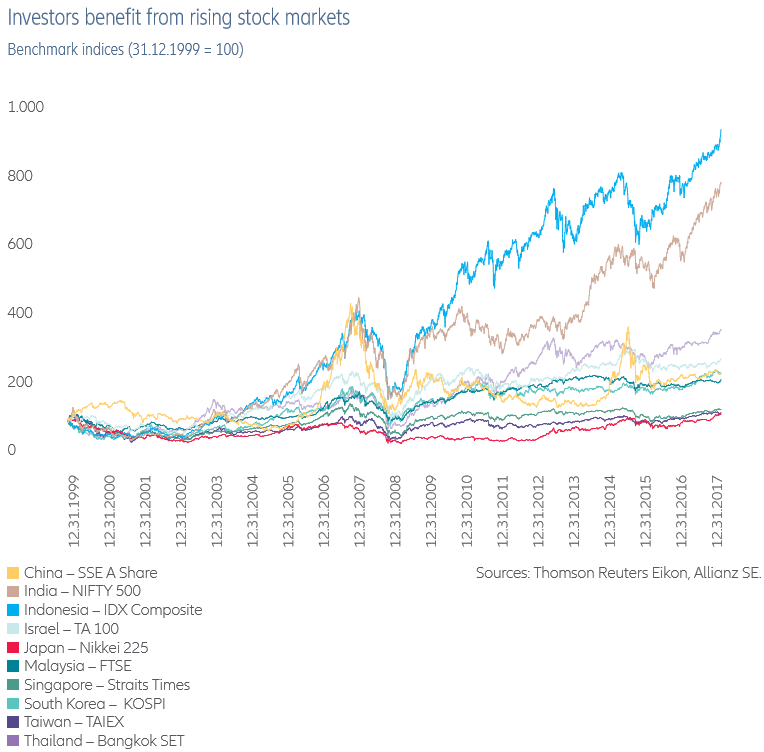
The Chinese stock market has valued itself about 200% since 2000, but with a lot of volatility, typical of emerging markets, and not forgetting that it is a country with incipient financial markets and still with a lot of controls of capital movements.
During this period, the markets that performed the most were the Indonesian and Indian, with values of almost 1,000% and 800% respectively.


