


This overperformance of the US equity market is not only against a few countries or world regions, but for all, reaching proportions never seen in historical terms compared to Europe, for example.
Is this higher US market performance to last or, on the contrary, can a reversal to the mean be expected?
The stock markets of developed countries tend to have synchronized developments, with alternating periods of regional performance leadership. However, since 2009 the US stock market has skyrocketed leaving behind all other equity markets, with divergences and lags matchless for more than 70 years.
Over the past 100 years, the equity markets of the various developed countries have had different average annual returns, but with little deviations, except in the periods and for the countries most impacted by the two great world wars.
The following graph shows that the average annualized returns, in real terms, of the equity markets of the various developed countries between 1900 and 2019, were around 5% to 6%, except for the countries hardest hit by the two great world wars:
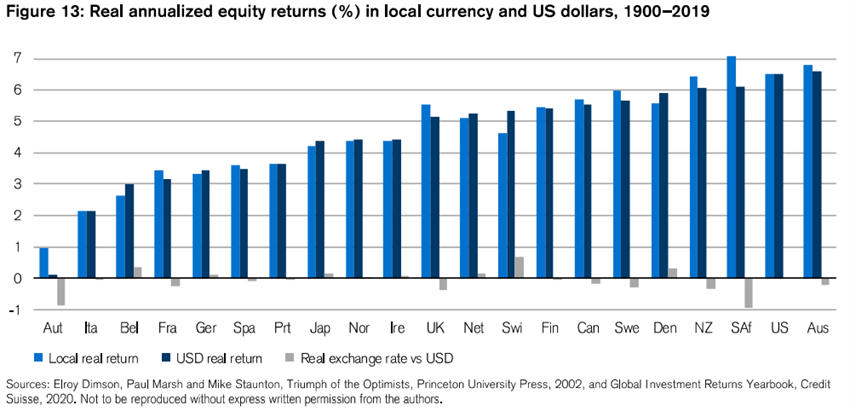
The USA, Australia, Canada, the Netherlands, the United Kingdom, Ireland, and the Nordic countries have had different but similar annualised average returns of between 5% and 6% in these almost 120 years. Only the countries most impacted by the great world wars such as Italy, France, Germany, and Japan have significantly underperformed, with annualised returns of 2% to 4% per year.
Markets evolve in cycles, alternating periods of higher performance between the US markets and the Rest of the World.
The following chart shows the returns of the US and rest of the world equity markets from 1982 to 2019, revealing an alternation of the performance of these markets in several subperiods:
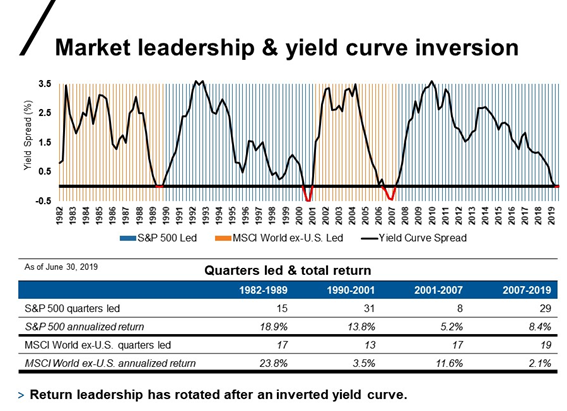
Four subperiods are highlighted: from 1982 to 1989, from 1990 to 2001, from 2001 to 2007 and from 2007 to 2019.
In the 1980s, the most profitable subperiod of the equity markets, the performance of world markets excluding the US or the Rest of the World, was higher than the US market, with average annualized returns of 23.8% versus 18.9%, respectively, and recording 17 vs. 15 in terms of the best quarterly performances.
It followed the 1990s, when US stock markets were better than the Rest of the World. The average annualised returns were clearly more favourable in the US, at 13.8% versus 3.5%, and the record for better quarters was 31 against 13.
In the following subperiod, between 2001 and 2007, the Rest of the World surpassed again the US, with average annualized returns of 11.6% versus 5.2%, and 17 vs. 8 more profitable quarters.
In the most recent subperiod, considered one of the longest positive cycles in the US stock market, the US returned to the lead with average annualized returns of 8.4% versus 2.1% and a record of 29 against 19 best quarters.
This alternation of performances seems to prove the idea of a reversal to the mean of the evolution of the performance of the stock markets.
Is that the way it is? Only the future will tell us. However, what we will see in this post is to try to understand the reasons for this relative performance.
The following graph presents another way to look at the reality of comparing profitability, now between the US and Europe, looking at the perspective of 10-year moving average annual returns:
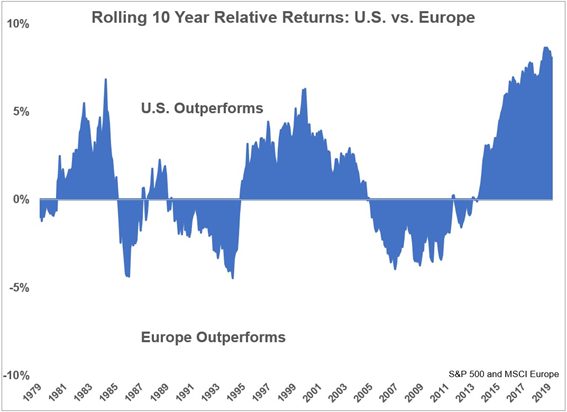
It is important to have in mind that this type of annual – rolling and 10-year average returns – has a greater memory, a history of an average of the last 10 years, than the previous ones, which consider only current annual returns.
In terms of 10-year average annual rolling returns, the US performed better than Europe in the 10 years prior to 1980 to 1985, turning this record into place between 1985 and 1989, becoming almost neutral over the next two years to continue with European leadership until 1995.
Between 1995 and 2005, the US was superior until the arrival of the Great Financial Crisis, in which Europe returned to lead until 2013. As of 2014, the US has not only led the way, but has done so in a significant form, with very high returns differences of more than 10% per year.
In this comparison we see once again the alternation of performances, which can indicate the presence of cycles.
Since the Great Financial Crises, the performance of the US stock market has been much higher than that of other developed countries.
The following chart compares the developments in the US and Rest of the World equity markets from 1997 to 2017:
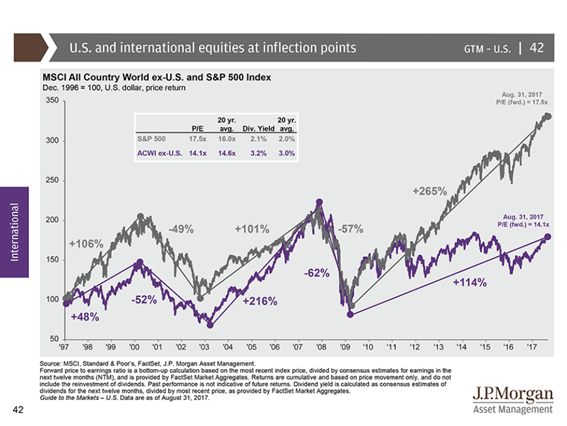
We see that despite the different performances, there was a great deal of synchrony in the evolution of the US and Rest of the World stock markets until 2009.
A positive cycle until 2000, followed by a negative until 2003, returning to rises until 2007, and then falls until 2009.
However, after 2009 there is a huge divergence. The US equity market is up, and up by more than 265% by 2017 (and this upward movement continues to this day), while the Rest of the World has only risen 114%, especially in the initial phase of the cycle until 2012 and having ups and downs since then.
Nothing better than the following chart to highlight the big difference in performance between the US and the rest of the world after the Great Financial Crisis:
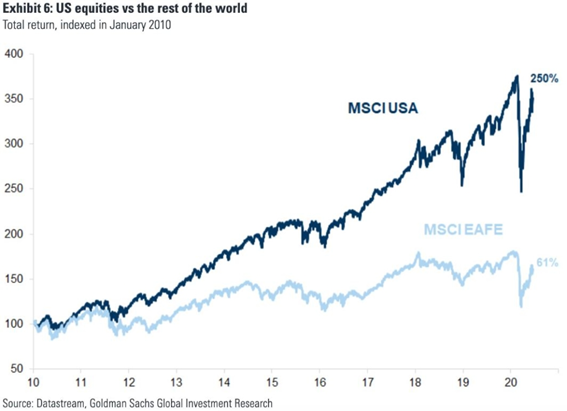
While the U.S. has risen 250% since 2010 to date, the Rest of the World has stood by a more modest 61%.
This overperformance of the US equity market is not only against a few countries or world regions, but for all, reaching proportions never seen in historical terms compared to Europe, for example.
We have seen that the US has performed undeniably better than the Rest of the World in this last positive cycle, quite long with a duration of more than 10 years, calling into question the alternation or reversal to the mean of the financial markets.
The Rest of the World is a very diverse set of regions and countries, with very different economic and market dynamics. So, it is worth seeing what the main components are.
The following graph shows the evolution of equity markets of the main regions between 2010 and 2019:
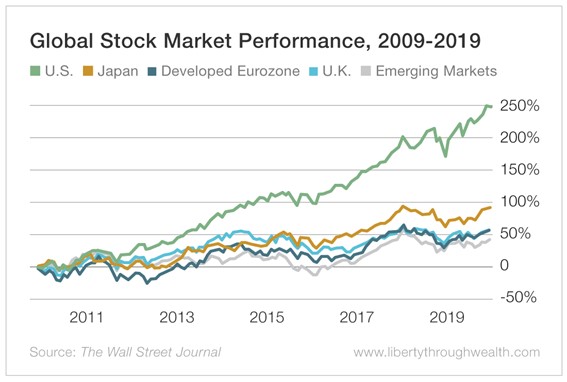
The US recorded a 250% climb, leaving Japan at 100% wide away, which is even higher than the 50% rise of Eurozone, UK and Emerging Markets.
We can observe these differences with higher level of detail in the following chart:
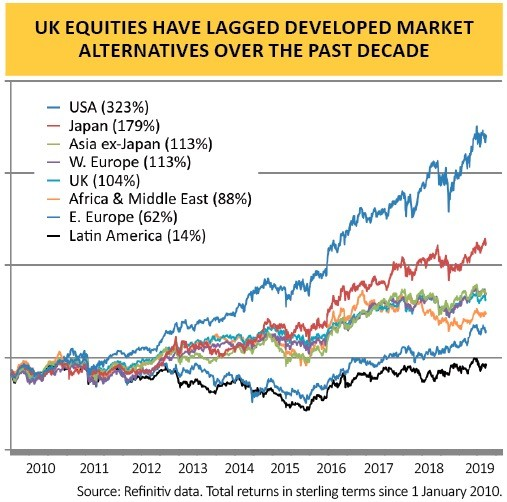
Between 2010 and 2019, the US with a 323% appreciation, far outnumbered Japan with 179%, Asia ex-Japan and Western Europe with the same 113%, the UK with 104%, Africa with 88%, Eastern Europe with 62% and Latin America with only 14%.
In other words, this difference is cross-cutting across all regions and countries.
What is also surprising is the difference with Western Europe, because deep down we are talking about two economic zones with the same systems and models of civilization and economics, liberalism and capitalism.
The recent US recent performance against Europe has reached extreme levels in historical terms:
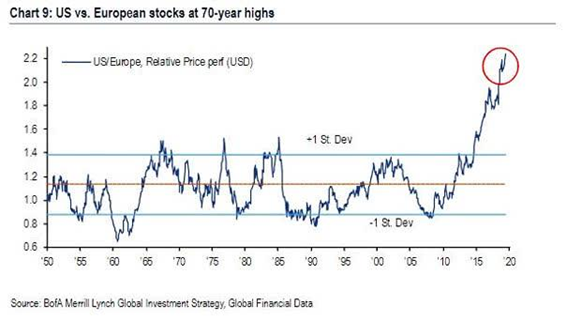
Never has the difference in the performance of the equity markets between the US and Europe been so marked in the last 70 years, from 1950 to date. In this period this difference remained in a band that included a variation of a positive or negative standard deviation until 2015, when it shot to levels that today exceed the 2 standard deviations.
There are two unanswered questions, which we will address in Part II.
What is behind this overperformance?
Is this recent US equity market overperformance against the rest of the world – Europe and Asia in particular – about to last or, on the contrary, can a reversal to the mean be expected?
https://www.credit-suisse.com/about-us/en/reports-research/studies-publications.html
https://www.amazon.com/Stocks-Long-Run-Definitive-Investment/dp/0071800514


