


The factors that determine the cycles of value investing and growth investing, and are we witnessing the end of the era of value investing or the beginning of a new cycle?
The last 10 years have clearly been more favourable to investing in growth stocks. To the point that our recent memory bias makes us think it has always been like this.
However, in a previous post we saw that historical facts prove otherwise, that is, that value investing performed much better than growth.
Now the question is what the future holds for us. Recently, in the US, we have seen a very long cycle, very positive and very favourable to growth stocks, which has been accentuated in the year of the pandemic. Will this cycle be resumed, or will we, on the contrary, have a reversal to value investing, and therefore also to the mean?
Reminder: Historical performance and valuation cycles of value and growth stocks
The influence of GDP growth, interest rates and commodity prices
The valuation multiples of value and growth stocks and what are our conclusions
Reminder: Historical performance and valuation cycles of value and growth stocks
The following chart shows the evolution of differences of annual returns between value and growth stocks for the S&P 500 between 1928 and 2019:
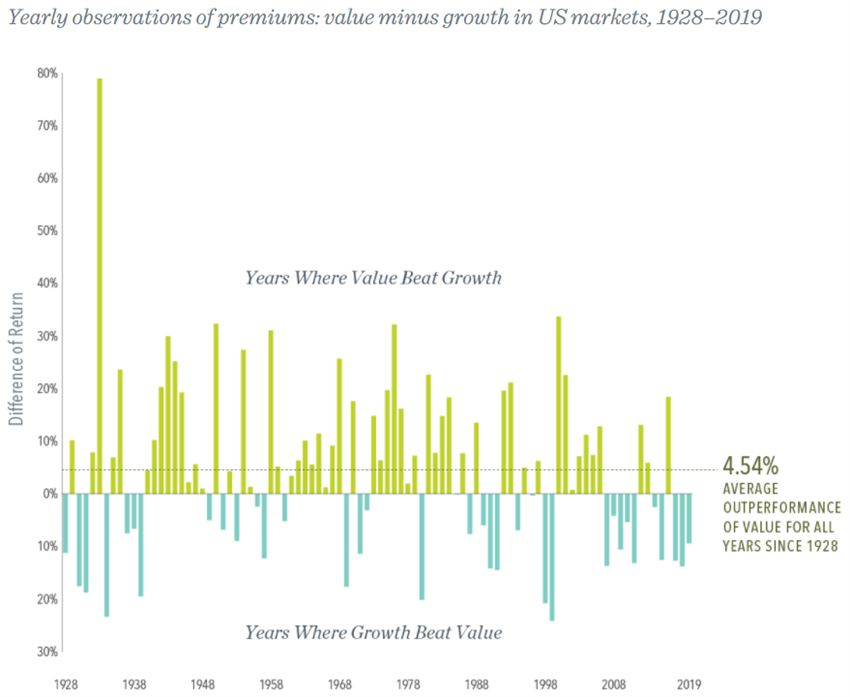
It is quite clear that value stocks have clearly outperformed growth stocks, not only with greater frequency of annual outperformance, but also with the occurrence of more significant annual returns (greater than 20%).
The following graph shows the evolution of differences in annual returns for 5-year periods between value and growth stocks for a more recent period between 1985 and 2020:
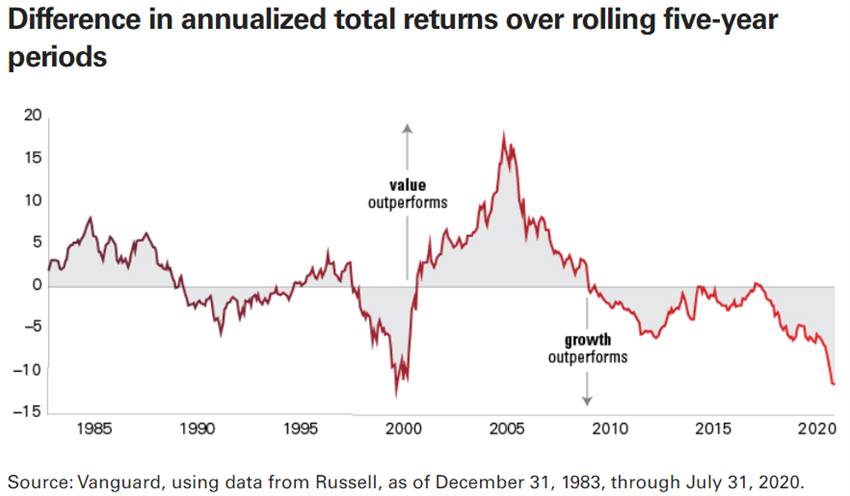
In this shorter and more recent period, the domination of value stocks was no longer as evident. There were times when value stocks were better, especially between 1985 and 1990 and between 2000 and 2009, but there were others that were clearly more favourable to growth stocks, such as the periods 1997 to 2000, and between 2010 and 2020, and fundamentally since 2016.
The following chart covering the same period as the previous one, but using the MSCI World index and the differences in 10-year annual average returns, illustrates the situation even better:
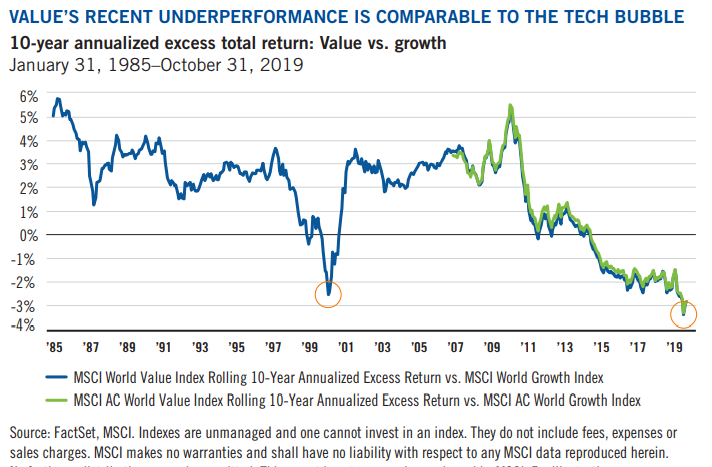
This 35-year period was clearly more favourable to value stocks, while growth has performed abnormally higher recently and consistently over a reasonably long period of 10 years.
The following graph shows the evolution of the difference in annual average returns over 10-year periods for the S&P 500 index by company capitalization segments:
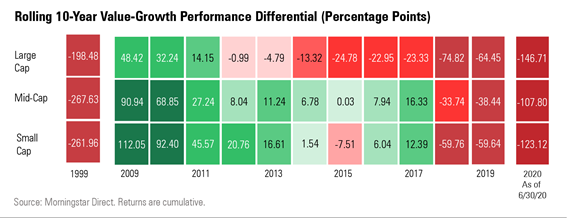
The 1990s were clearly favourable to growth stocks, as well as the period from 2017 to date, whatever the capitalization segment, for large, medium, and small companies. The period between 2009 and 2017 was more favourable for medium and small value stocks, while for large companies this was only in the three-year period from 2009 to 2011.
Is it possible to identify value and growth cycles or patterns or sets of factors that favour one strategy over another?
GDP Growth
There is a widespread idea that growth stocks perform better in periods where economic growth is lower.
The rational is the theory of scarcity that underlies many economic aspects. If a good is scarce its price tends to rise. Therefore, when economic growth is weak, investors may be presumed to pay a premium on investment in growth stocks in relative terms.
The following chart proves this idea by showing the evolution of the best-known S&P 500 value versus growth index between 1924 and 2020 (called the HML Index of French Fama), marking in the lower horizontal axis the various periods or cycles of economic growth:
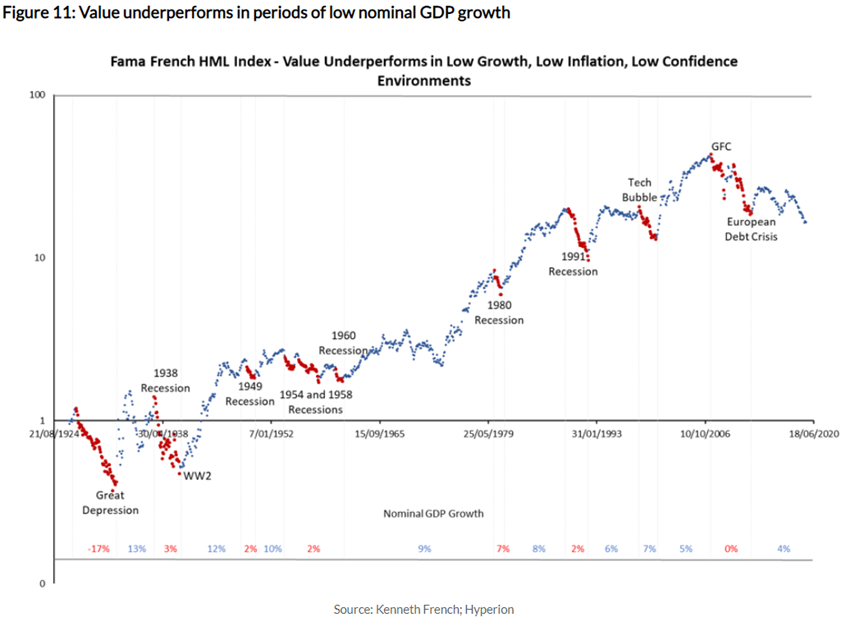
The HML (High Minus Low) index was studied by Fama French and is considered one of the three important factors to explain stocks performance and prices. High refers to companies with a high book value/market value ratio. Low, refers to companies with a low book value/market value ratio. This factor is also referred to as the “value factor” or the “value versus growth factor” because companies with a high book-market ratio are typically regarded as value stocks.
The conclusion is that value stocks underperform growth when economic growth is low (as well as inflation and confidence), confirming that widespread idea.
In the period analysed, the growth stocks had 6 cycles of better performance compared to those of value. The Great Depression between 1924 and 1932, when average annual economic growth was -17%, World War II with average annual growth of -3%, periods throughout the 1950s when growth was 2%, as well as the recession of the early 1980s and 1990s, the 2000 bubble and the Great Financial Crisis of 2007-2008 , where the constant has always been lower economic growth than the other periods.
Interest Rates
Interest rates are another important factor that influences the performance of value stocks relative to growth stocks.
The following graph shows the relative evolution of value stocks compared to MSCI World index growth in the period 1977-2020:
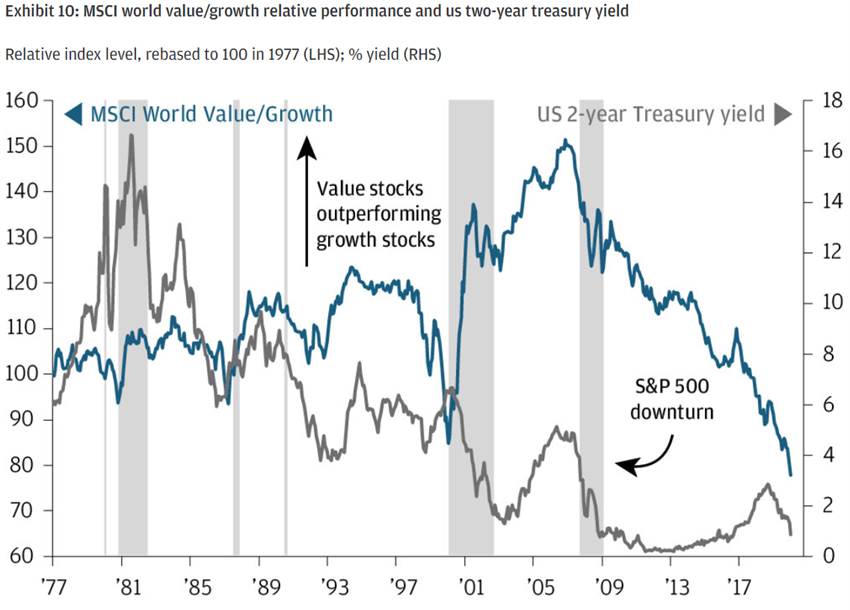
We see that, in general, the lower the treasury bonds yields, the better the relative performance of growth stocks.
The economic and financial explanation is simple. As we know, the value of a stock is calculated by discounting the values of its future cash-flows. By its own definition, the cash-flows of growth stocks are much higher than value stocks in the more distant years and vice versa (we say we buy cash flows growth). We also know that the interest rate on treasury bonds is one of the basic components of the discount rate of these cash flows, seeking to reproduce (or discount) the time value of money. Thus, the higher the interest rate, the higher the discount factor, which increases exponentially with the passage of time through the compounding effect. Thus, the higher the interest rate, the higher the discount in the longer term, and the lower the value attributed to the stocks, and vice versa, being greater impact on growth than value.
Commodities prices
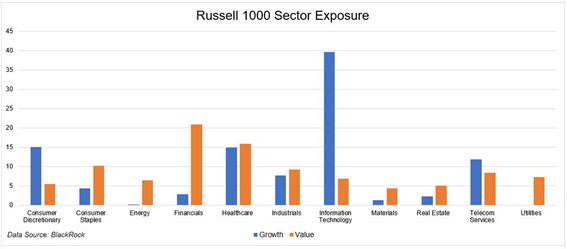
Typically, value stocks are associated with companies in the financial, utilities, energy and raw materials sectors, among others, while growth stocks are linked to telecommunications, technology and other sectors, as can be seen in the following chart for the composition of the Russell index of the 1,000 largest U.S. companies.
To this extent, there is a direct and positive relationship between the price of commodities and value stocks, so the performance cycle of value stocks is determined by the price of the commodities, as can be seen in the following chart showing the relative performance of the MSCI World index of value against growth between 1977 and 2020:
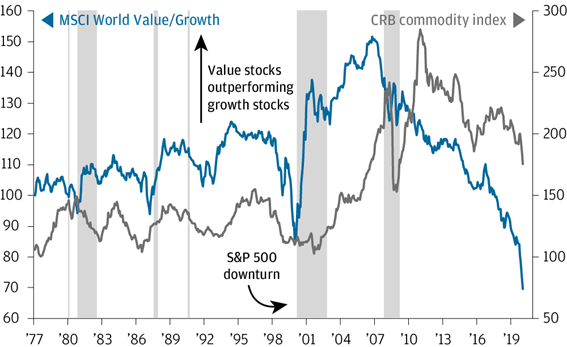
When the commodity price index increases there is an outperformance of value stocks against growth stocks and vice versa, and that this relation is very strong.
The valuation multiples of value and growth stocks and what are our conclusions
To predict the future performance of the two investment strategies, value and growth investing, it is not enough to try to predict the evolution of 3 factors, GDP growth, the interest rates behaviour and commodity prices movements. It is equally important to see the evolution of valuation multiples as value and growth stocks.
We will see that the multiple price valuation on earnings per share has never been as high for growth stocks against value as now.
The following chart shows the evolution of price multiples on results per share or PER of the MSCI World index between 1975 and 2020:
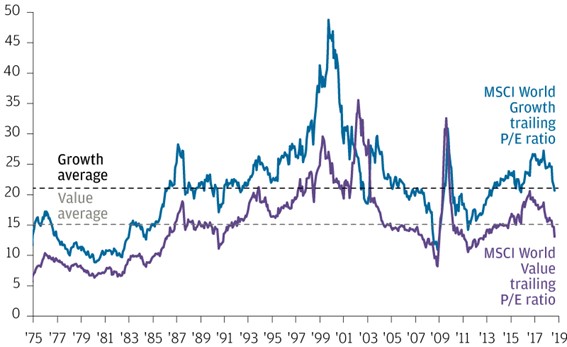
It is obvious that the PER of growth stocks is higher than those of value. The difference between PER is quite stable except for some periods that are worth investigating further.
For this purpose, it is more useful to see the following chart that precisely shows the evolution of the difference between the price the earnings per share multiple or PER of the growth stocks over those of the MSCI World index value between 1975 and 2020:
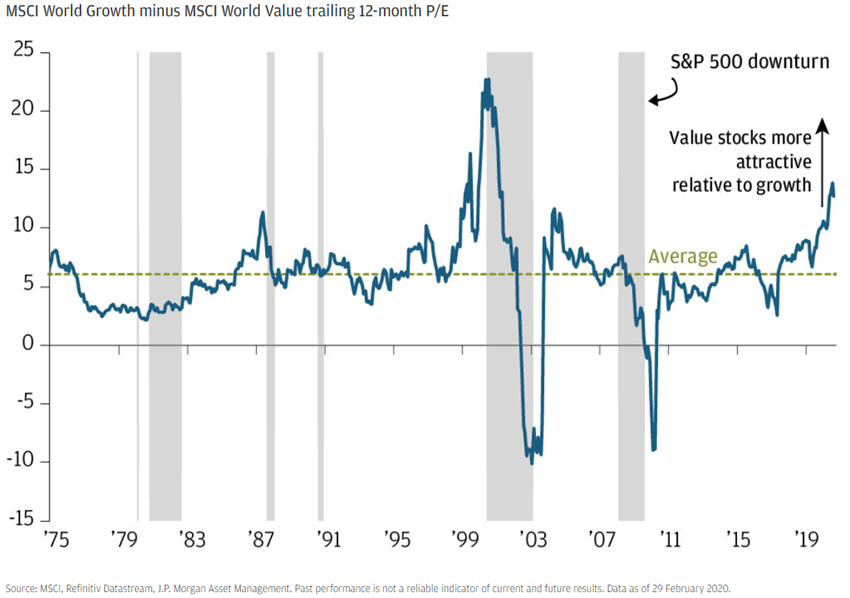
In this period, the average difference in PER was 6x, naturally favourable to growth stocks. Looking at the period, two very important things are easily perceived: 1) There are times when this difference moves away, in some cases even to extreme values; (2) However, this difference always reverts to close to the average difference within a reasonably short period.
Looking at the evolution in greater detail, this difference was reasonably stable between 1975 and 1996, starting a sharp rise to the peak of the technological bubble in which it exceeded 20x, when prices and multiples of unbelievable earnings were paid for stocks in this sector. As this bubble burst, growth stocks fell sharply, with a sharp decline in the value of the difference that reached -10x in 2003 to stabilize along with the historical average in the following years. Then came the Great Financial Crisis that hit the financial sector more intensely, one of the main sectors of value, with the difference of PER being -10X. Since then and to date the per gap has been gradually rising to 15x, making the growth sector more expensive.
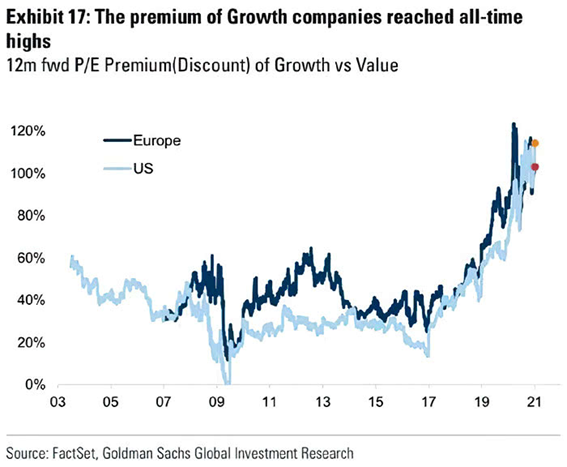
In the following charts, we see the PER multiples of growth and value stocks for two different indices, the S&P 500, the main US index, and one of the major European indices, MSCI Europe:
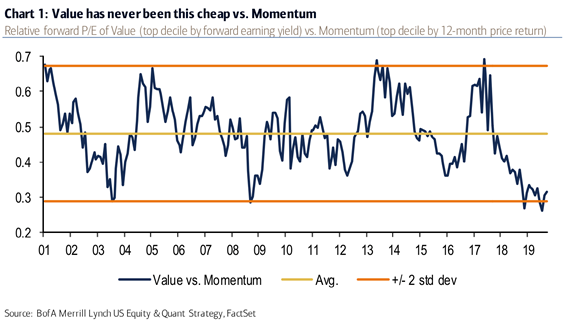
The average of this relative index of value and growth in the US was almost 0.5 between 2001 and 2020, having oscillated between a band of values of 0.3 and 0.7 corresponding to two standard deviations. Value investment was up between 2005 and 2008 and 2012 and 2014 while growth grew higher in 2003, 2009 and today (2019/20).
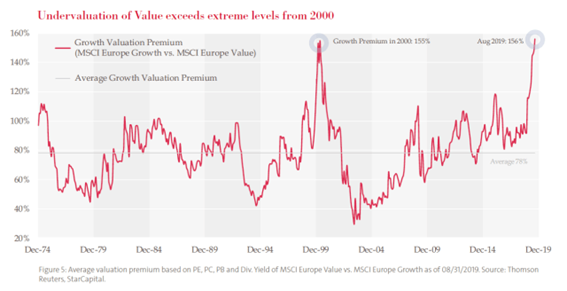
The MCSI Europe index shows that growth stocks are at an average premium of 79% compared to those in value between 1974 and 2019. During this period, there were higher premiums for growth stocks compared to value stocks in the 2000 technology bubble (155%) and in 2019 (156%).
In conclusion, in all these indices of the main global stock markets, the PER of growth stocks relative to those of value are at maximum values, having risen mainly in the last 3 to 4 years.
Does this mean that in a short- and medium-term perspective they are expensive, in the sense that this situation will revert to the mean on this horizon or not?
Surely only the future will tell us.
However, our view is that we will have the natural reversal to the mean over a medium-term horizon, but in a positive market cycle for both stock classes. In other words, we believe that we will have a more favourable cycle for value stocks in the coming years, although not at the expense of growth. In other things, we expect a recovery in value stocks, which have been hit hard in recent years, and that the per difference that is located at 15x is close to the 6x average, especially by stronger growth per share of value companies.
It should be remembered that in recent years we have experienced low levels of economic growth, low inflation, low interest rates and low prices for energy and other commodities. All these factors have harmed value stocks and benefited those of growth.
This situation has been accentuated by the pandemic. All these factors worsened, with negative growth, even lower interest rates and reduced energy prices, to which were added the losses of the financial and energy sectors, on the one hand, and the gains of the telecommunications and technological sectors, on the other. The explosion of sustainable investment in 2020 has also deepened these differences.
In the second half of 2020, with the recovery of economic growth, rising inflation and interest rates, and the rise in commodities prices, there was a natural movement of inflection or rotation of investments from growth to value.
We think that this trajectory of appreciation favourable to value stocks, which has only recently begun, will continue in the medium term, reversing the difference of the valuation multiples of the current 15x to the historical average of 6x, in a gradual movement.
Growth companies are expected to continue to achieve good earnings per share, with the growth of digitization, remote work, etc. and that most value companies will quickly and significantly recover earnings per share to pre-pandemic levels as economies strongly recover.
https://www.amazon.com/Intelligent-Investor-Definitive-Investing-Essentials/dp/0060555661


