• About us
    • Who we are
    • Mission
  • Contacts
  • English
    • Português (Portuguese (Portugal))
    • Español (Spanish)
    • Français (French)
  • Login
Investorpolis
[xyz-ips snippet="Banners-Publicitarios"]
No Result
View All Result
No Result
View All Result
Investorpolis
No Result
View All Result
Home Investing Series Guide III. Assets Risks & Returns

Stocks for the medium term and bonds for shorter periods

17 de December, 2019
in III. Assets Risks & Returns, Investing Series Guide
Reading Time: 5 mins read
0 0
0
Share on FacebookShare on Twitter

We can reduce risk over time: stocks for the medium and long term and bonds for shorter periods

The stocks and bonds yearly rates of return between 1873 and 2018

We can reduce risk over time: stocks are for the medium and long term and bonds are for shorter periods

The following graph shows the US stocks (S&P 500 index) and bonds (Ibbotson and Bloomberg Barclays Aggregate index) nominal, or in monetary returns, behaviour for rolling investment periods of 1, 5, 10 and 20 years and for a combined 50/50 portfolio of stocks and bonds, from 1950 to 2018:

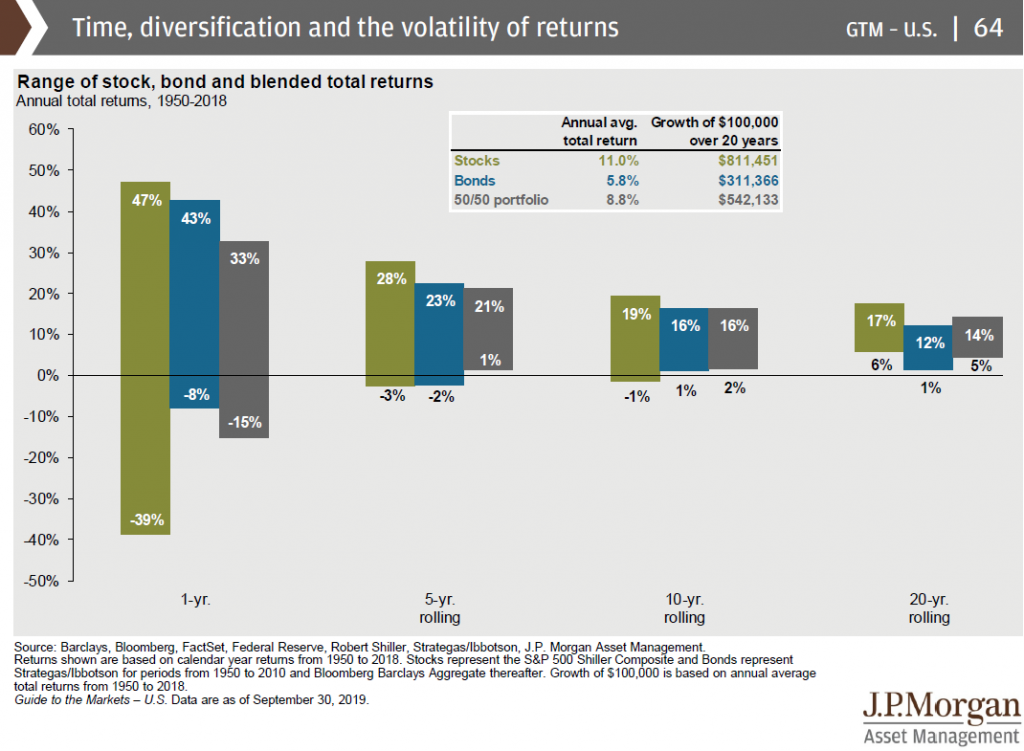
We can highlight the following conclusions:

  1. The range between maximum and minimum rates of return for 1-year investments is much higher in stocks than in bonds;
  2. The maximum loss risk, measured by the largest negative rates of return is much higher in stocks than in bonds for 1-year investment terms, respectively of -39% and -8%;
  3. For investments of 5 years or more, on average, the maximum loss risk is only -3% per year in stocks versus -2% per year in bonds;
  4. For investments for 10-year periods, on average, the maximum loss risk is virtually zero in both assets, and for 20-years investment periods, on average, the lowest returns in stocks were 6% and in bonds 1%.    

The following chart shows the maximum and minimum fluctuation ranges for rates of return of 3 assets –  large companies stocks, 10-year treasury bonds and 3.month treasury bills – for investment periods of 1, 2, 5, 10, 20 years and 30, but now in terms of real rates, i.e. adjusted by inflation, for the US market between 1802 and 2012:

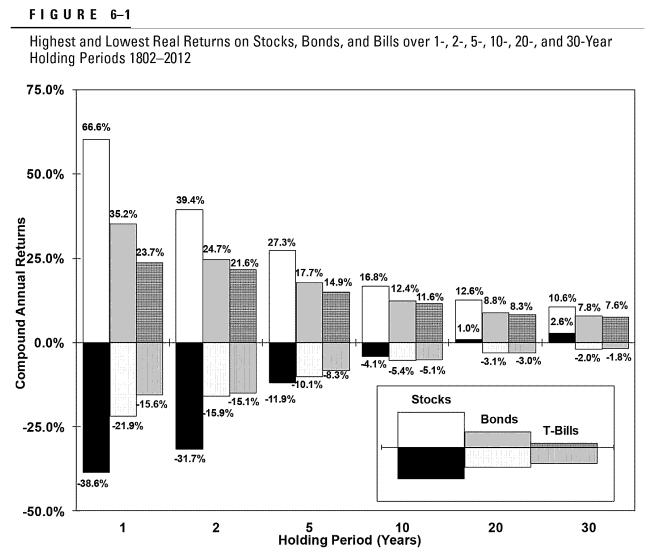
Source: Stocks for the Long Run, Jeremy Siegel

The conclusions are as follows:

  1. For the 2-year horizon, the maximum loss of investment in stocks is much higher than that of treasury bonds and tickets;
  2. For the 5-year horizon and longer periods, stock investment is clearly better than in treasury bonds and bills because their maximum loss is not much different, the maximum gain is much higher, as well as the average annual rates of return of each, as we have seen before;
  3. For horizons of 10 or more years, investment in stocks is unbeatable because the most favourable fluctuation ranges reinforce the highest average annual rates of return.

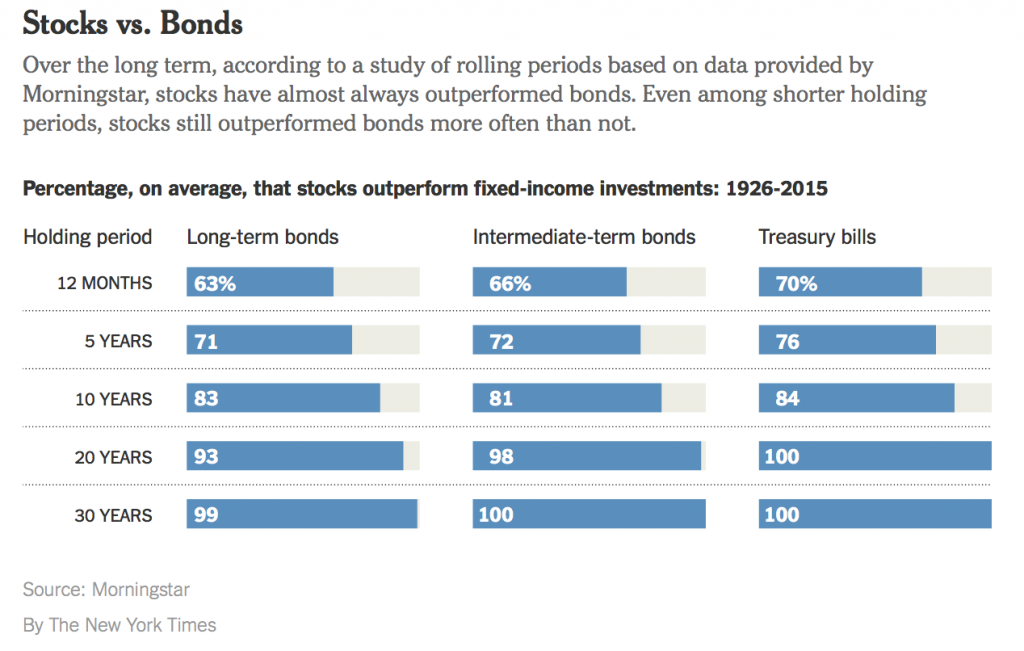
It is also important to know the frequency of occurrence of the assets rates of return.

In the period between 1926 and 2015, in the US, stocks had higher rates of return than bonds in 63% of the years, 71% in the 5-year periods, 83% in the 10-year periods, 93% in the 20-years and 99% in the 30-years.  

Between 1926 and 2017, the (rolling) rates of return for investment periods of US stocks were as follows: 

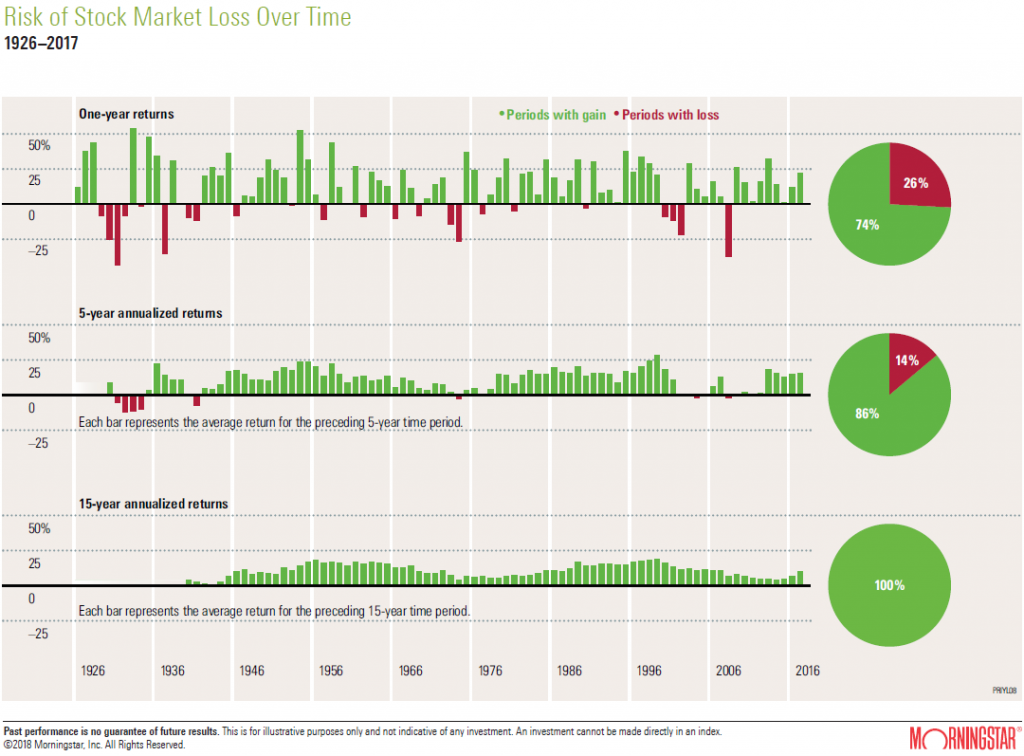
Over these more than 90 years, negative returns have been recorded in 26% of years, only 14% in any 5-years investment periods and 0% in any 15-years investment periods.

In short: stocks are the best investment for the medium and long term, bonds for shorter term, and for time horizons up to 2 years, savings, whether in deposits or other money accounts, are better.

The stocks and bonds yearly rates of return between 1873 and 2018

Another way to think about stocks investments gains and losses is to look at the rates of return of one of the main stock market indexes, the S&P 500, made up of the 500 largest U.S. companies listed on the stock exchange, has provided over the years.

The following bar charts (called frequency histograms in statistics),  made by Thomson Datastream, Global Financial Data and Schroders Economic Group, record annual rates of return for 10-year US treasury bonds, from 1900 to 2017, and for the S&P 500, between 1873 and 2017, by intervals of 5% and 10%, respectively.

We start by showing them individually for a better annual perspective and then together for easier comparison between these 2 asset classes.

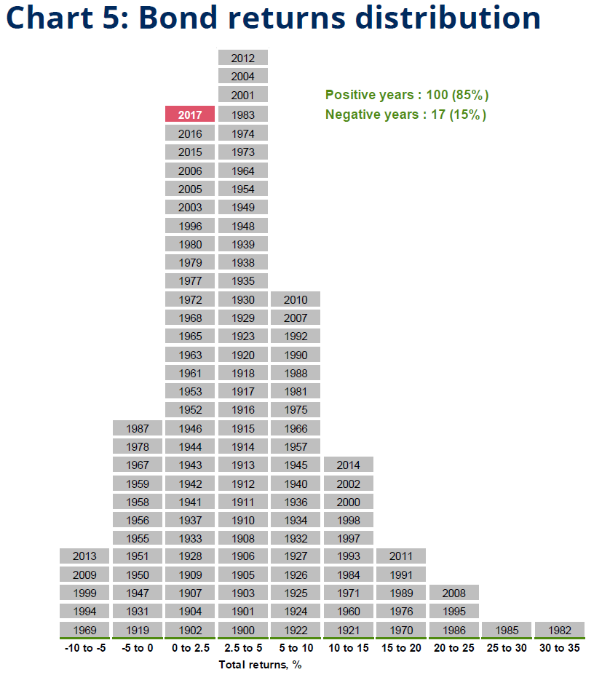
The bonds showed annual rates of return between -10% and up to 35%. They had positive rates of return in 85% of the years and negative rates in the remaining 15%. If we look more closely, we see that the years of the highest rates were recorded in the period from 1983 to 2014, which coincided with the fall in interest rates from levels above 15% per year to 0% (also called the great bond bull market).

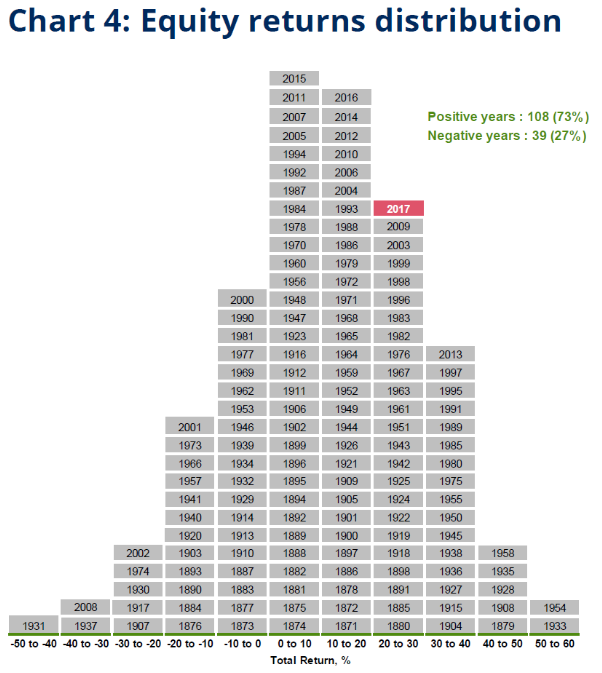
The US stocks (from the S&P 500 index) provided positive rates of return ranging from -50% to +60%. They had positive rates in 73% of the years and negative rates in the remaining 27%. Negative rates of return in excess of -10% were 20 out of a total of 147 years.

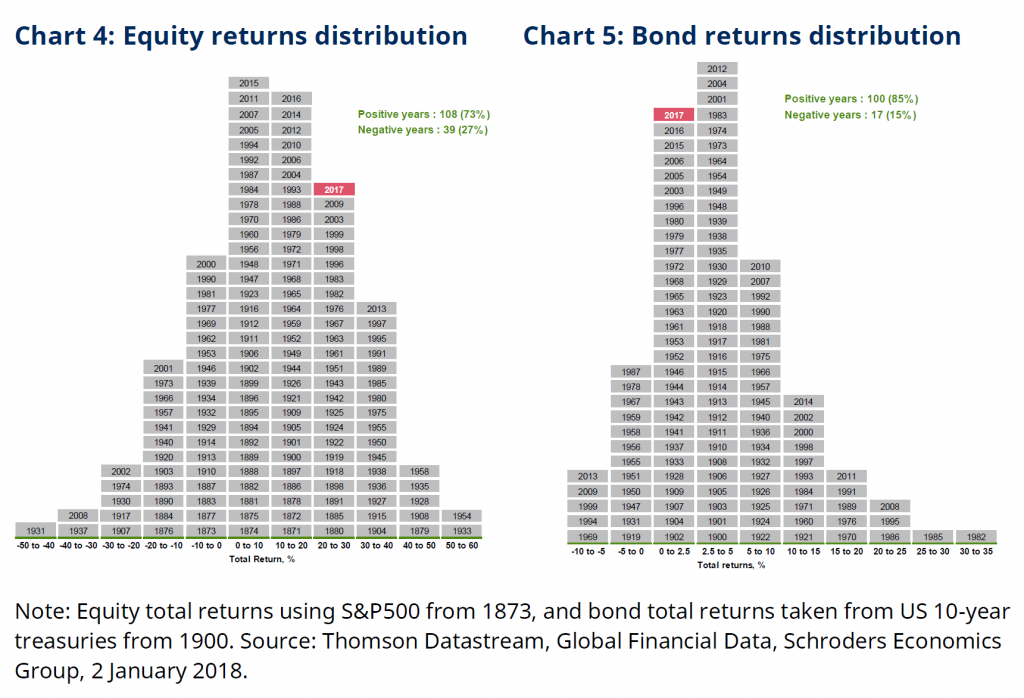
By positioning the two charts side by side we have an easier comparison.

We see that the stocks rates of return are tilted more to the right and with tails to the left (worst returns), and those of bonds are more at the middle and with tails to the right (best returns).

If we look a little more closely at the charts above, we can conclude that, in general, the years of greatest devaluations of the stock market were good years for bonds (e.g. 2002 and 2008), which reinforces the importance of a portfolio combining these two asset classes.  

It is based on these observations that we say it is worth investing in financial assets, and in stocks, for investment horizons longer than 2 years.

The following chart shows the annual rates of return of the S&P 500 each year for an even longer period, from 1872 to 2018. We have much more positive years than negative ones (negative rates of return occurred in about 25% of years).

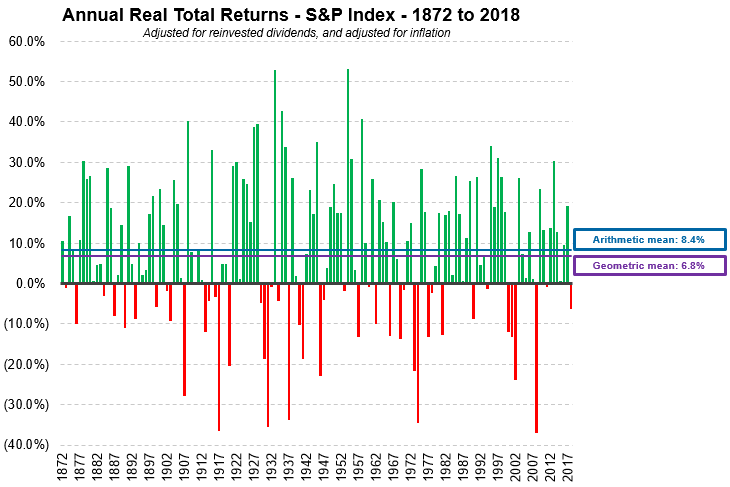
Source: U.S. Stock Market Returns – 1870s to Present, The Measure of a Plan.com

Previous Post

Benefits of planning and investing by objectives

Next Post

Asset allocation determines 90% of the investment’s performance

Investadmin

Investadmin

Related Posts

Asset allocation by economic cycles, and the importance of age in asset allocation
Investing Series Guide

Asset allocation by economic cycles, and the importance of age in asset allocation

11 de August, 2024
The 4 Financial Asset Allocation Strategies Used by Individual Investors
Investing Series Guide

The 4 Financial Asset Allocation Strategies Used by Individual Investors

11 de August, 2024
Investing in Secular Stocks Series: Part 4.3 – Relationship between ROIC and the PER and PEG market multiples
Investing Series Guide

Investing in Secular Stocks Series: Part 4.3 – Relationship between ROIC and the PER and PEG market multiples

4 de July, 2024
Investing in Secular Stocks Series: Part 4.2 – The Importance of ROIC in Fundamental Valuation
Investing Series Guide

Investing in Secular Stocks Series: Part 4.2 – The Importance of ROIC in Fundamental Valuation

4 de July, 2024
Investing in index funds or products: The S&P 500 Equal-Weight, as an alternative to the S&P 500
Investing Series Guide

Investing in index funds or products: The S&P 500 Equal-Weight, as an alternative to the S&P 500

20 de June, 2024
Individual investors have a too short time horizon, and this short-sightedness comes at a high cost
Investing Series Guide

Individual investors have a too short time horizon, and this short-sightedness comes at a high cost

14 de June, 2024
Next Post

Asset allocation determines 90% of the investment’s performance

Leave a Reply

Your email address will not be published. Required fields are marked *

Trending

Effects of Trump’s Trade Tariffs on Financial Investments Series: P1 – Framework

Effects of Trump’s Trade Tariffs on Financial Investments Series: P1 – Framework

8 de May, 2025
Series Investments in the Artificial Intelligence Cycle: Part 2 – The main branches of AI

Series Investments in the Artificial Intelligence Cycle: Part 2 – The main branches of AI

29 de April, 2025
2Q25 Financial Markets Outlook: Zombieconomics, or the monumental cost of Trump’s astronomical reciprocal tariffs

2Q25 Financial Markets Outlook: Zombieconomics, or the monumental cost of Trump’s astronomical reciprocal tariffs

4 de April, 2025
Thematic Investments Series: Part 3. What are the main megatrends?

Thematic Investments Series: Part 3. What are the main megatrends?

28 de March, 2025
Investorpolis

We developed this blog because we believe that only a small learning effort is needed to make a big change in the decisions and results of our investments and financial assets.

Main categories

  • Investing Series Guide
  • Wealth and Investing
  • Retirement & Savings
  • Tools
  • More

Newsletter

Sign to our mailing list to receive updates direct to your inbox!

*We don’t spam

  • Privacy Policy
  • Cookie Policy
  • Contacts

© 2021 - Investorpolis / Powered by Delta Soluções

  • pt-pt Português
  • fr Français
  • es Español
  • en English
  • Home
  • Investing Series Guide
    • I. Goal Based Investing
    • II. Compounding & Inflation
    • III. Assets Risks & Returns
    • IV. Efficient Diversification
    • IX. Sustainable Investing and ESG
    • V. The Investor
    • VI. Assets and Investments
    • VII. Index Funds
    • VIII. Successful Investing
    • X. Kits and Tips
    • XI. Other Topics
  • Retirement & Savings
    • Retirement
    • Savings
  • Wealth and Investing
    • Investing
    • Wealth
  • Tools
    • Calculators
    • Publications
    • Sites and apps
  • More
    • Best of
    • Reviews
    • Snapshots
    • Others
  • About us
    • Who we are
    • Mission
  • Login
  • Cart

© 2021 - Investorpolis / Powered by Delta Soluções

Welcome Back!

Login to your account below

Forgotten Password?

Retrieve your password

Please enter your username or email address to reset your password.

Log In
We use cookies on our website to give you the most relevant experience by remembering your preferences and repeat visits. By clicking “Accept All”, you consent to the use of ALL the cookies. However, you may visit "Cookie Settings" to provide a controlled consent.
Cookie configurationCookie PolicyAcceptReject
Manage consent

Privacy Overview

This website uses cookies to improve your experience while you navigate through the website. Out of these, the cookies that are categorized as necessary are stored on your browser as they are essential for the working of basic functionalities of the website. We also use third-party cookies that help us analyze and understand how you use this website. These cookies will be stored in your browser only with your consent. You also have the option to opt-out of these cookies. But opting out of some of these cookies may affect your browsing experience.
Advertisement
Advertisement cookies are used to provide visitors with relevant ads and marketing campaigns. These cookies track visitors across websites and collect information to provide customized ads.
Analytics
Analytical cookies are used to understand how visitors interact with the website. These cookies help provide information on metrics the number of visitors, bounce rate, traffic source, etc.
Functional
Functional cookies help to perform certain functionalities like sharing the content of the website on social media platforms, collect feedbacks, and other third-party features.
Necessary
Necessary cookies are absolutely essential for the website to function properly. These cookies ensure basic functionalities and security features of the website, anonymously.
Others
Other uncategorized cookies are those that are being analyzed and have not been classified into a category as yet.
Performance
Performance cookies are used to understand and analyze the key performance indexes of the website which helps in delivering a better user experience for the visitors.
SAVE & ACCEPT

Add New Playlist

Are you sure want to unlock this post?
Unlock left : 0
Are you sure want to cancel subscription?