We can reduce risk over time: stocks for the medium and long term and bonds for shorter periods
The stocks and bonds yearly rates of return between 1873 and 2018
We can reduce risk over time: stocks are for the medium and long term and bonds are for shorter periods
The following graph shows the US stocks (S&P 500 index) and bonds (Ibbotson and Bloomberg Barclays Aggregate index) nominal, or in monetary returns, behaviour for rolling investment periods of 1, 5, 10 and 20 years and for a combined 50/50 portfolio of stocks and bonds, from 1950 to 2018:
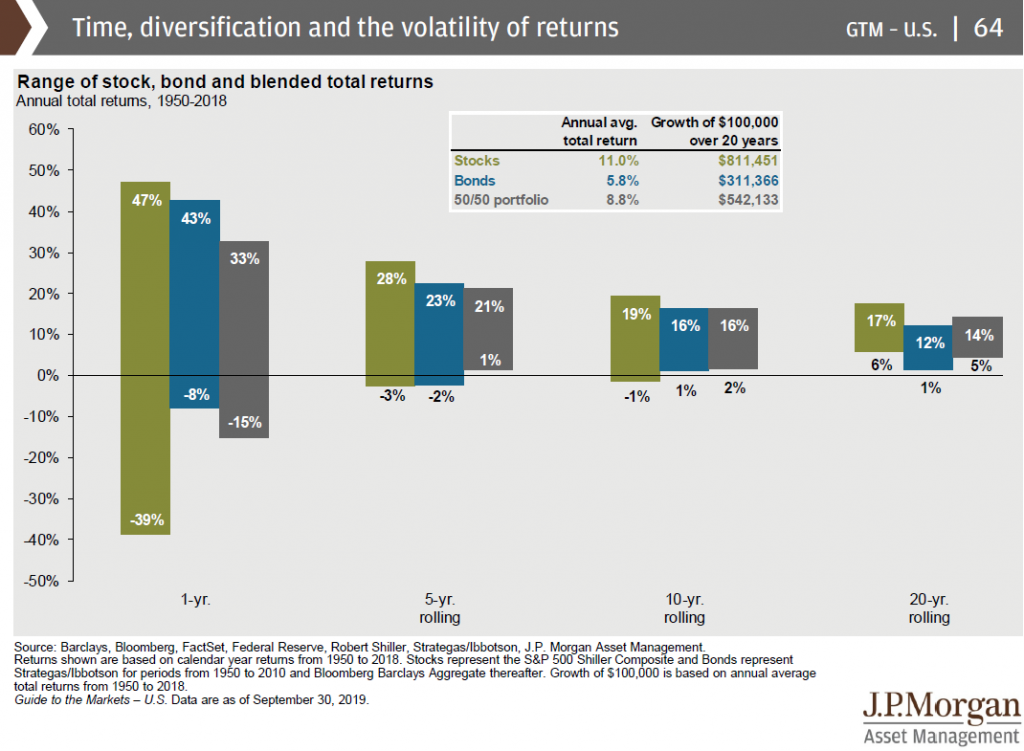
We can highlight the following conclusions:
- The range between maximum and minimum rates of return for 1-year investments is much higher in stocks than in bonds;
- The maximum loss risk, measured by the largest negative rates of return is much higher in stocks than in bonds for 1-year investment terms, respectively of -39% and -8%;
- For investments of 5 years or more, on average, the maximum loss risk is only -3% per year in stocks versus -2% per year in bonds;
- For investments for 10-year periods, on average, the maximum loss risk is virtually zero in both assets, and for 20-years investment periods, on average, the lowest returns in stocks were 6% and in bonds 1%.
The following chart shows the maximum and minimum fluctuation ranges for rates of return of 3 assets – large companies stocks, 10-year treasury bonds and 3.month treasury bills – for investment periods of 1, 2, 5, 10, 20 years and 30, but now in terms of real rates, i.e. adjusted by inflation, for the US market between 1802 and 2012:
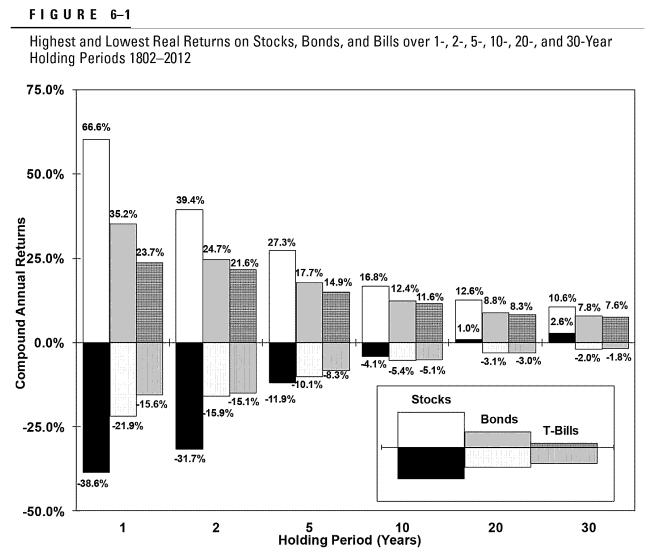
Source: Stocks for the Long Run, Jeremy Siegel
The conclusions are as follows:
- For the 2-year horizon, the maximum loss of investment in stocks is much higher than that of treasury bonds and tickets;
- For the 5-year horizon and longer periods, stock investment is clearly better than in treasury bonds and bills because their maximum loss is not much different, the maximum gain is much higher, as well as the average annual rates of return of each, as we have seen before;
- For horizons of 10 or more years, investment in stocks is unbeatable because the most favourable fluctuation ranges reinforce the highest average annual rates of return.
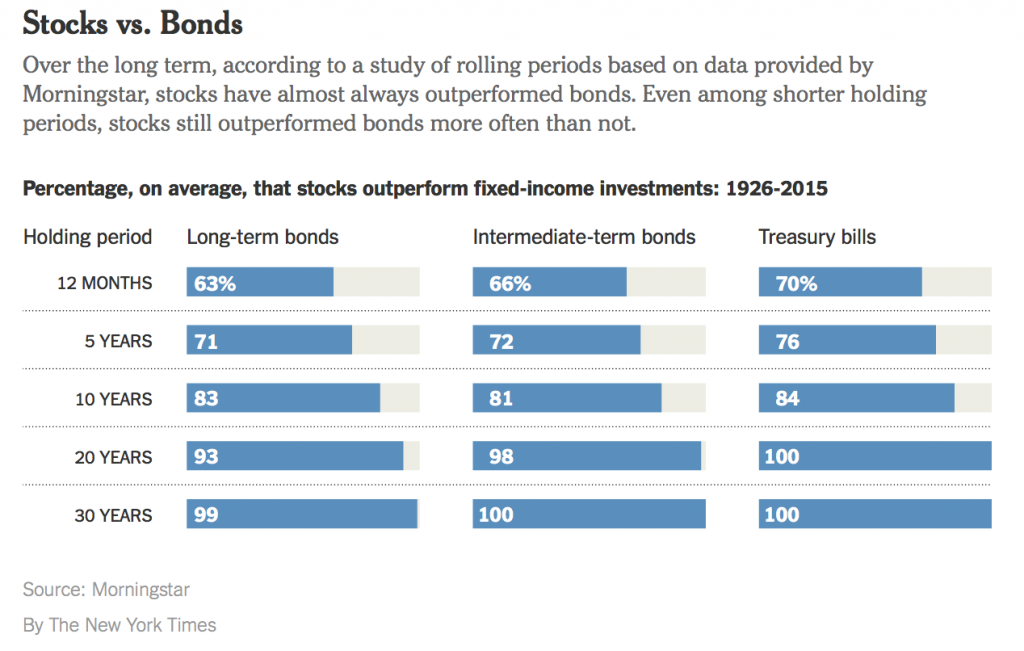
It is also important to know the frequency of occurrence of the assets rates of return.
In the period between 1926 and 2015, in the US, stocks had higher rates of return than bonds in 63% of the years, 71% in the 5-year periods, 83% in the 10-year periods, 93% in the 20-years and 99% in the 30-years.
Between 1926 and 2017, the (rolling) rates of return for investment periods of US stocks were as follows:
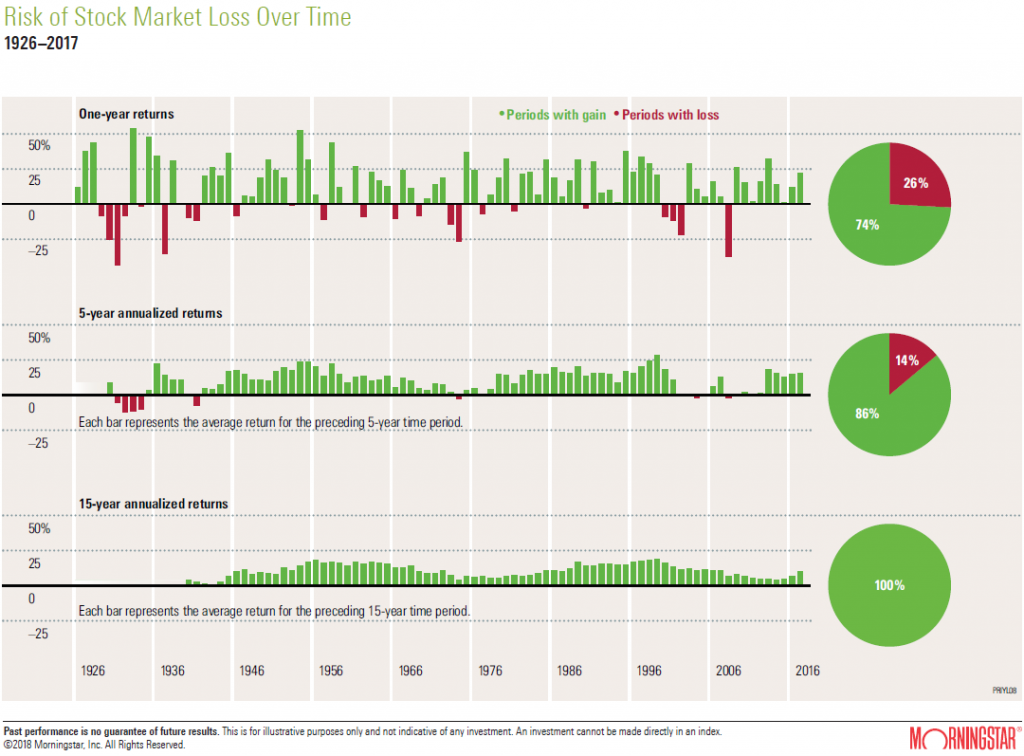
Over these more than 90 years, negative returns have been recorded in 26% of years, only 14% in any 5-years investment periods and 0% in any 15-years investment periods.
In short: stocks are the best investment for the medium and long term, bonds for shorter term, and for time horizons up to 2 years, savings, whether in deposits or other money accounts, are better.
The stocks and bonds yearly rates of return between 1873 and 2018
Another way to think about stocks investments gains and losses is to look at the rates of return of one of the main stock market indexes, the S&P 500, made up of the 500 largest U.S. companies listed on the stock exchange, has provided over the years.
The following bar charts (called frequency histograms in statistics), made by Thomson Datastream, Global Financial Data and Schroders Economic Group, record annual rates of return for 10-year US treasury bonds, from 1900 to 2017, and for the S&P 500, between 1873 and 2017, by intervals of 5% and 10%, respectively.
We start by showing them individually for a better annual perspective and then together for easier comparison between these 2 asset classes.
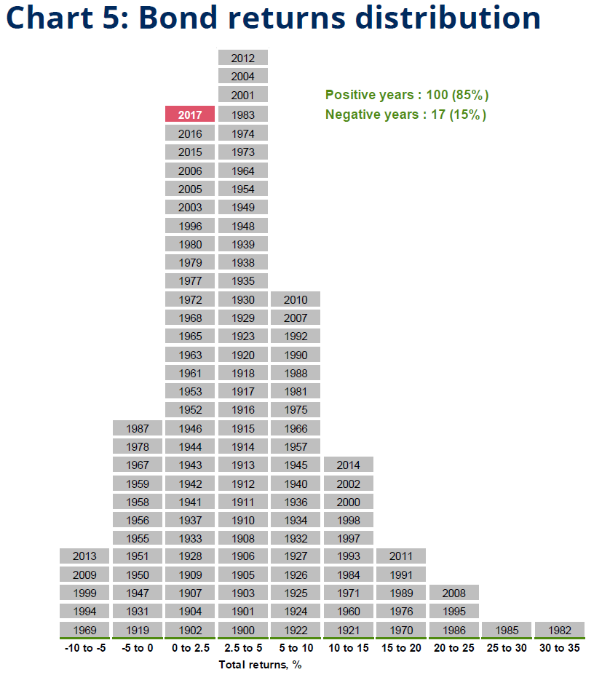
The bonds showed annual rates of return between -10% and up to 35%. They had positive rates of return in 85% of the years and negative rates in the remaining 15%. If we look more closely, we see that the years of the highest rates were recorded in the period from 1983 to 2014, which coincided with the fall in interest rates from levels above 15% per year to 0% (also called the great bond bull market).
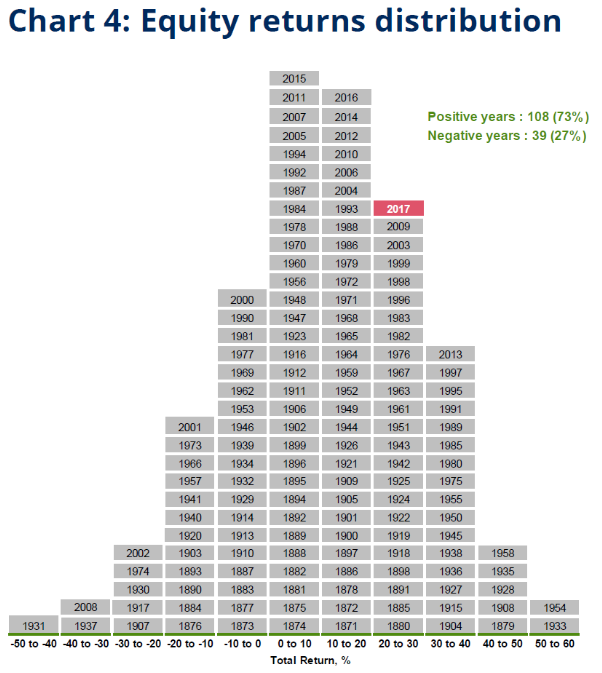
The US stocks (from the S&P 500 index) provided positive rates of return ranging from -50% to +60%. They had positive rates in 73% of the years and negative rates in the remaining 27%. Negative rates of return in excess of -10% were 20 out of a total of 147 years.
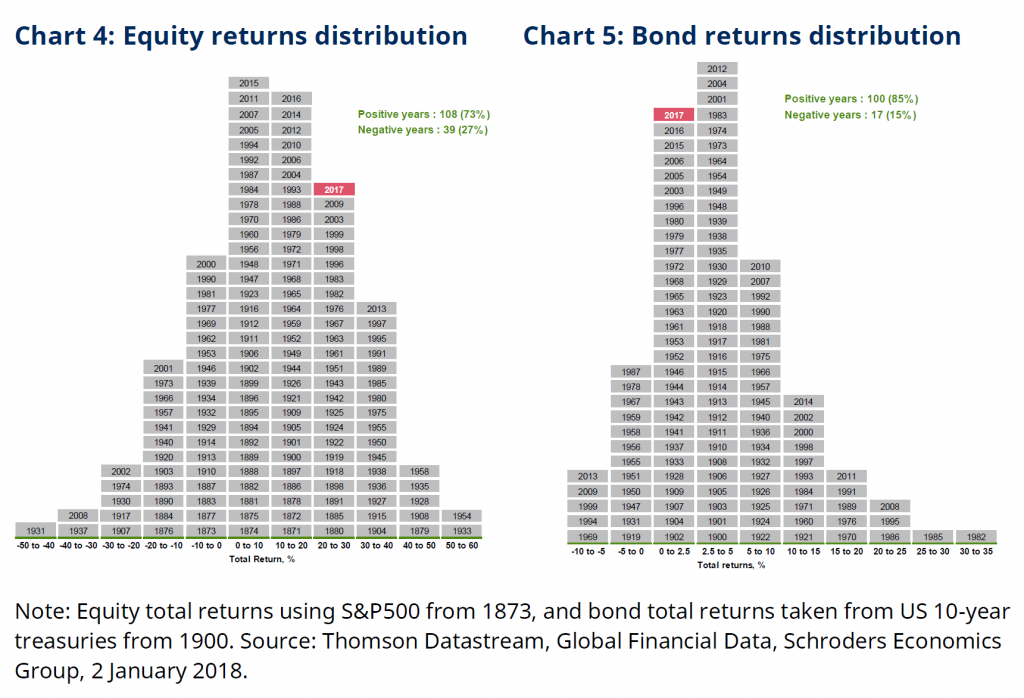
By positioning the two charts side by side we have an easier comparison.
We see that the stocks rates of return are tilted more to the right and with tails to the left (worst returns), and those of bonds are more at the middle and with tails to the right (best returns).
If we look a little more closely at the charts above, we can conclude that, in general, the years of greatest devaluations of the stock market were good years for bonds (e.g. 2002 and 2008), which reinforces the importance of a portfolio combining these two asset classes.
It is based on these observations that we say it is worth investing in financial assets, and in stocks, for investment horizons longer than 2 years.
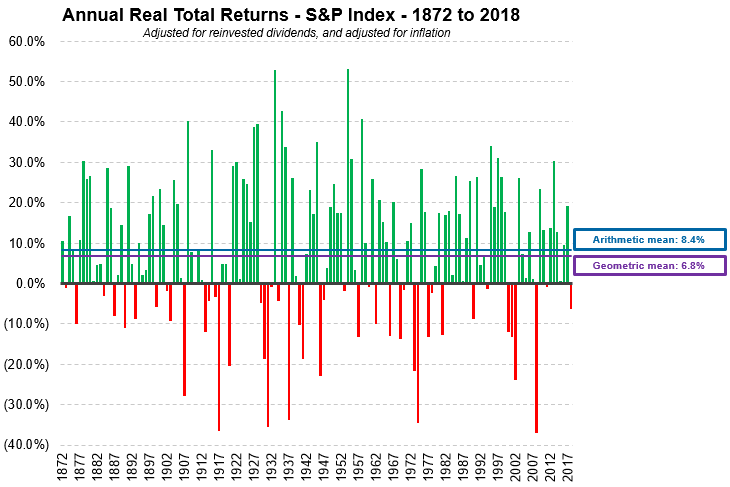
The following chart shows the annual rates of return of the S&P 500 each year for an even longer period, from 1872 to 2018. We have much more positive years than negative ones (negative rates of return occurred in about 25% of years).
Source: U.S. Stock Market Returns – 1870s to Present, The Measure of a Plan.com


