Rebalancing is the strategy that realigns the allocation of assets over time
The advantages of rebalancing in terms of realignment of the investor profile, risk allocation and investment portfolio management itself
Rebalancing decreases risk overexposure, but does not increase profitability
What are the ways to rebalance? The main rebalancing strategies are a function of time, deviation from the objective, or both
As rebalancing is always advantageous for the execution and management of investment risk, it is even more critical in the management of retirement funds and diversification
It is proven that the allocation of assets, i.e. the chosen combination between equities and bonds, determines more than 90% of the performance, and this should result from the objective, profile and financial situation of the investor
One of the most important activities of the personal financial plan is to determine the allocation of assets between the main classes – equities and bonds – and their subclasses, more suitable for the individual case.
This is due to the fact that, as we have seen, asset allocation determines the expected performance of investments by more than 90%.
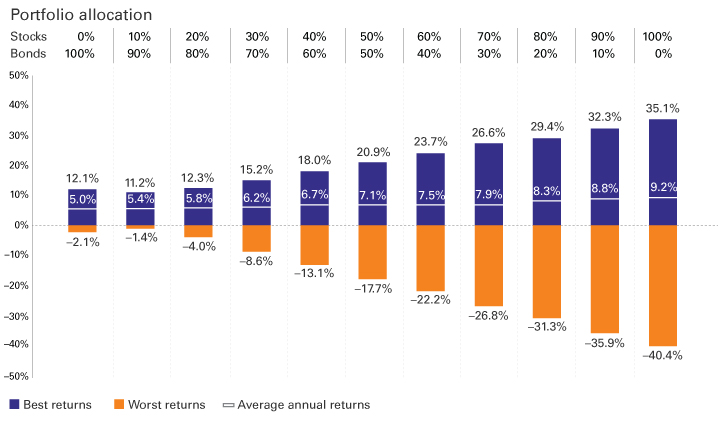
The most average (or expected) profitability corresponds to more risk, evidenced by the variation in the profitability range.
This allocation is a function of the financial objective in question (in particular, its time and criticality), and the investor’s profile and financial situation.
As far as the objective, the most important is the time frame and the criticality. The longer the time frame, the longer we have to recover from any market fluctuations.
And the more critical or priority the goal, the less our margin of error will be, or the less we can fail, and the more conservative or less aggressive we will be.
The next chart shows the average annual return for 10-year investment periods of the S&P 500 index between 1936 and 2020:
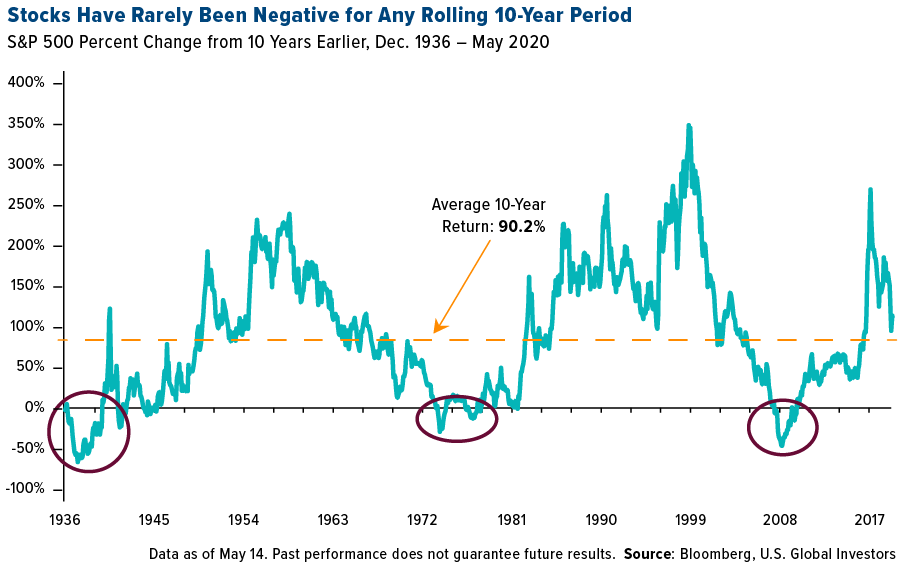
It shows that 10-year profitability has rarely been negative. This only happened in three moments: between 1936 and 1939 when the Great Depression period of 1929-33; between 1973 and 1978 as a result of the oil shocks of 1973 and 1978; and between 2007 and 2009 the result of the combination of the technology bubble of 2000 and the Great Financial Crisis of 2007-2008.
The following chart shows the maximum and minimum return of the S&P 500, 10-year U.S. Treasury bonds, and a blend investment portfolio in that index’s stocks and those bonds for investment periods of 1, 5, 10 and 20 years between 1950 and 2020:
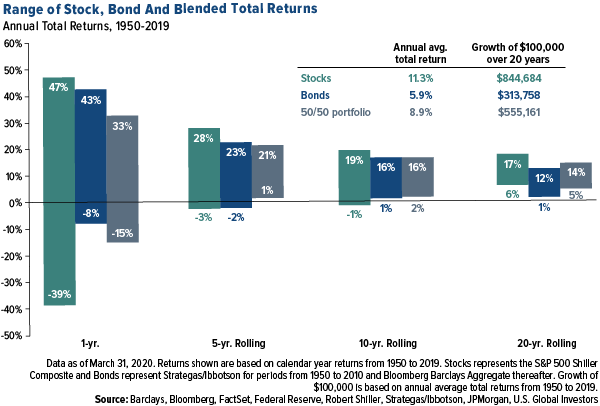
It is concluded that in the medium term, for investment horizons of 5 years or more, the investment in stocks, in the case of the S&P 500, is clearly better than that of bonds and even the blend portfolio of 50/50, because the average profitability is much higher (almost double compared to bonds), the minimum returns (differences of -4% to +5%) is similar and the maximum is much higher (+3% to +7%).
On the other hand, the investor profile is also essential because we have to live well with the allocation, knowing that there are more conservative people and others more aggressive than us.
Finally, the better our situation and financial capacity or the more money we have the more risk we can take.
The evolution of the performance of the stocks and bonds with the passage of time results in the removal of the allocation of assets from the one initially established, subjecting the investment to unintended risks
It happens that with normal market developments the percentages of asset allocation are alternated according to their differentiated behaviour.
The following chart shows how the initial asset allocation of 60% of stocks and 40% of bonds would have evolved between January 2003 and December 2018, without any rebalancing, taking as reference the S&P 500 index for stocks and the Bloomberg Barclays US Aggregate index for bonds:
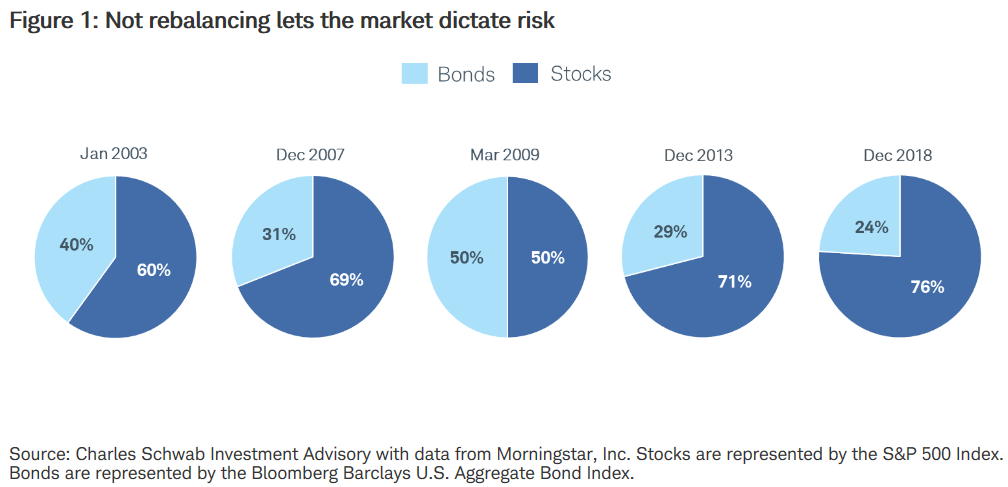
The initial allocation would have passed to 69% in shares and 31% in bonds on the eve of the major financial crisis, then to 50% in shares and bonds in the last month of that crisis in March 2009, changing to 71% in shares and 29% in bonds in December 2013, and evolved to 76% of shares and 24% of bonds at the end of the period.
Usually, as the history of financial markets tells us, the stocks of large companies have average annual returns of almost 10%, which is twice the 5% of the treasury bonds to 10 years, thus expecting a higher performance and consequently an allocation of those.
This is the most common situation, but also the opposite may happen in certain periods.
Rebalancing is the strategy that realigns the allocation of assets over time
Rebalancing is precisely the process of realigning the weights of asset subclasses in investment or equity portfolios.
Rebalancing involves buying or selling assets in a portfolio periodically to maintain an original or desired level of asset allocation or risk.
Let’s go back to the previous example and admit that the initial allocation of target assets was 60% of shares and 40% of bonds.
If stocks and bonds had performed during the period, the portfolio’s stock weightcould have increased to almost 70%.
To correct and avoid this situation, the investor may then decide to sell some shares and buy bonds to reposition the portfolio in the initial target allocation of 60/40.
The advantages of rebalancing in terms of realignment of the investor profile, risk allocation and investment portfolio management itself
First, portfolio rebalancing maintains the desired level of risk, decreasing investment volatility and safeguarding that the investor is overexposed to undesirable risks.
Secondly, the rebalancing ensures that portfolio exposures remain within the area of guidance and investor expertise.
Often, these rebalancing measures are taken to ensure that the amount of risk involved is at the level desired by the investor.
Given that stock performance can vary more drastically than bonds, the percentage of assets associated with stocks will change with market conditions.
Together with the performance variable, investors can adjust the overall risk within their portfolios to meet changing financial needs.
Third, rebalancing makes it easier for you to invest in managing your emotions and staying on course for market disruptions, rather than adopting volatile behaviours of trying to predict or manage markets that normally have a high cost.
The realignment helps to maintain the discipline of the allocation because by ensuring the investor the initial allocation in time, any changes made have a greater burden on the investor, forcing him to question why change the initial plan that was made very carefully.
The following graph seeks to illustrate the benefits of rebalancing in emotion management by taking as an example a portfolio of 60% stocks and 40% bonds and the evolutions of their markets between 2005 and 2014, covering the very volatile period of the Great Financial Crisis of 2007-08:
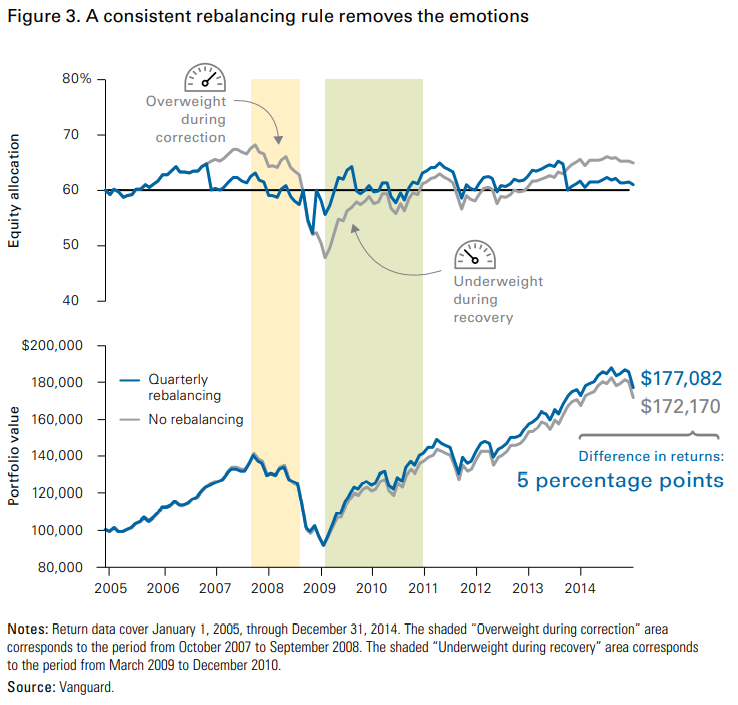
The blue line shows the evolution of rebalanced portfolios, quarterly in the example used, while the gray line describes the unrebalanced ones.
In the top chart we have the evolution of the allocation.
Without rebalancing, due to the better performance of the stocks between 2005 and 2007, the portfolio would have reached an allocation of 70% and 30% in mid-2007, just before the crisis.
The subsequent worst performance of the shares would have caused a change in allocation to levels close to 50/50 in 2009.
The lower chart shows the performance of the portfolio. We see that over the entire 10-year period the performances are similar, with the difference in profitability accumulated at the end of the year of only 5%.
These periods of big falls or crises are when investors often let their emotions get the better of them, sometimes leading them to abandon their plans at or near their lowest value and then to be too slow to re-enter and lose their recovery when it inevitably comes.
Identifying an appropriate combination or allocation of investments based on the investor’s financial objective and risk profile —and then maintaining that consistent allocation over time—helps us maintain the path we want and prepare to maintain the course of the portfolio through market fluctuations and fluctuations.
Thus, we add discipline and remove emotion from the decision-making process as we work to achieve our financial goals.
Fourth, rebalancing usually leads to reduced risk or volatility.
This graph shows the effect of rebalancing, in the annual case, on risk reduction, analyzing the case of a standard investment portfolio, well diversified of domestic and international stocks and bonds, between 1970 and 2018:
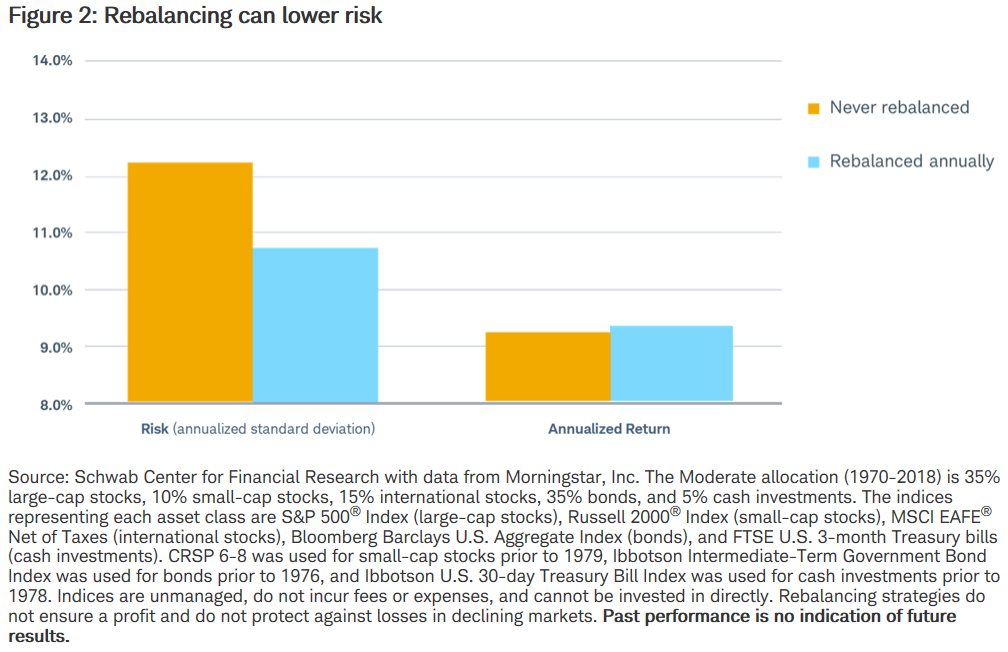
We see that the risk, measured by the annualized standard deviation of the portfolio, decreased significantly, from 12.2% to 10.8%.
In this case, annualized returns have even improved slightly.
Fifthly and lastly, rebalancing allows you to buy cheaper and sell more expensive than an unrebalanced strategy, also called “buy-and-hold”, taking advantage of the gains of higher performing investments and reinvesting them in assets that have not yet had such remarkable growth.
In this context it is more efficient than the average weight strategy or “dollar weighted cost averaging”.
A side consequence of the advantages of normal risk reduction and cheap buying and expensive selling is to allow the same profitability with less volatility and less risk, i.e. less anxiety.
The following chart shows the investment performance of $100,000 in a 100% unrebalanced stock portfolio and a 50% stock and 50% annually rebalancing bond between 2000 and 2014:
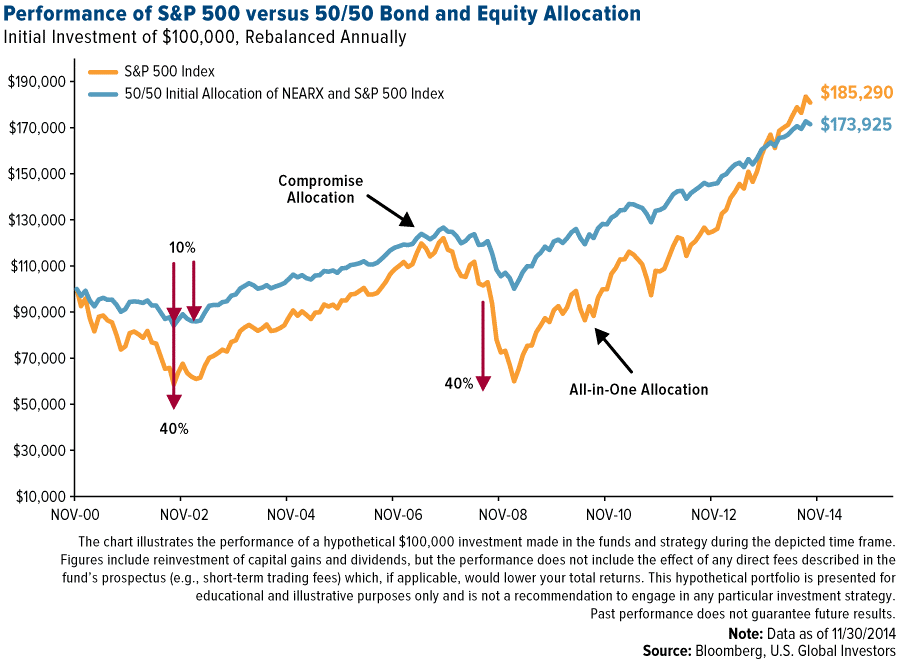
At the end of the 14-year period the accumulated capital result would be pretty much the same, from $185,290 to 100% shares versus $173,925 for a 50/50 mixed portfolio.
However, as one can see the way to get there was quite different, the former having had much more volatility or risk.
Rebalancing decreases risk overexposure, but does not increase profitability
Having seen what the rebalancing does, it’s also worth seeing what it doesn’t.
Rebalancing does not increase investment profitability.
In fact, in most cases, it even decreases profitability by combating normal deviations for greater allocation to shares.
The following table commismatches the results of two identical diversified portfolios of 50% stocks and 50% bonds, one with annual rebalancing and the other without rebalancing, between 1926 and 2015:
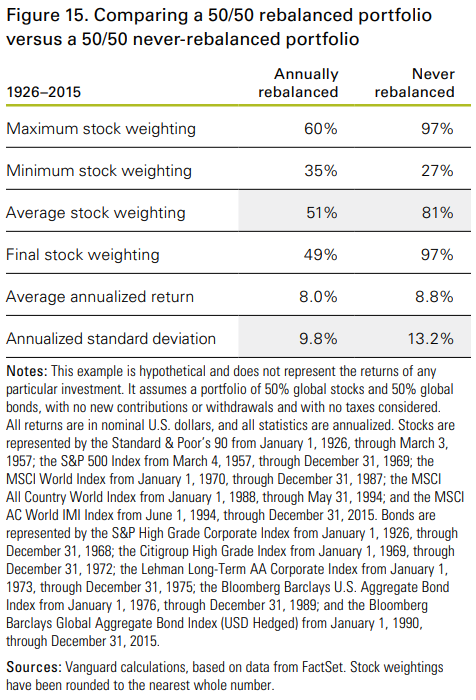
As expected, risk or volatility decreased, measured by the annualized standard deviation, being 9.8% in the rebalanced portfolio versus 13.2% in the unrebalanced portfolio.
However, without strangeness, annualized returns were also lower in the rebalanced portfolio, 8% versus 8.8%.
Other very important features are variations in allocation weights over time.
In the portfolio without rebalancing the weight of the shares reached the levels of 97% and 27%, while in the annual rebalanced, the maximum values obtained were 60% and 35%.
The average weight of the stocks was 51% in the rebalanced portfolio and 81% in the non-rebalanced portfolio, with the weights at the end of the term of 49% versus 97%.
In terms of profitability, there are times when it improves and others when it gets worse, as we will see in the following two examples.
In this chart we have the differences in annualized yields for investment periods of 25 years between 1826 and ending in 2014, portfolios of 50% in shares and 50% in bonds, with and without rebalancing:
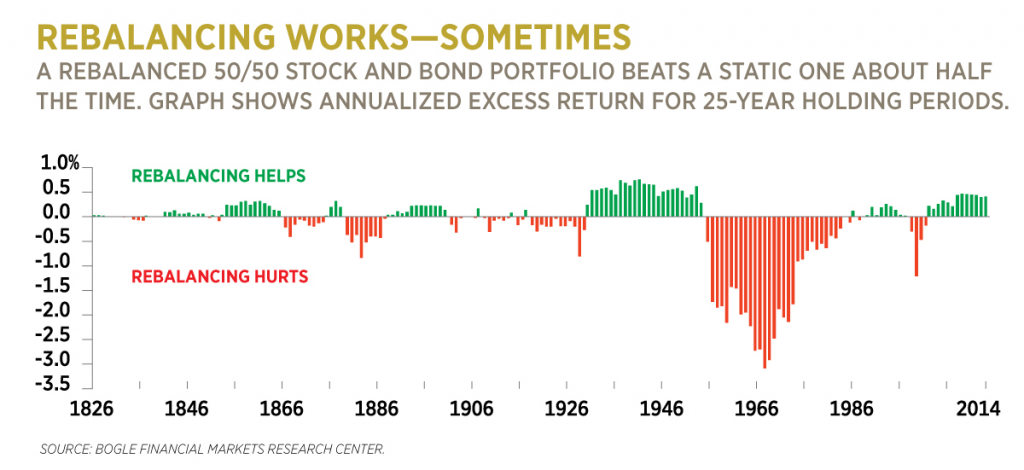
The rebalancing resulted in better annualized yields, but very slight and less than 1%, especially in the 19th century and ending between the years 1930 and 1960.
However, it cost between 2% and 3% in terms of annualized returns in the investment periods ending between 1955 and 1985.
In terms of returns, rebalancing has a low cost or even a profit in periods of major crises, such as those of the Great Depression, the technology bubble and the Great Financial Crisis, and has a high cost in periods when volatility is less pronounced.
We can see this reality differently.
The following graph shows the same conclusions, but instead of considering the years as the end moments of the investment period (in this case 30 years), it situates them as at the beginning:
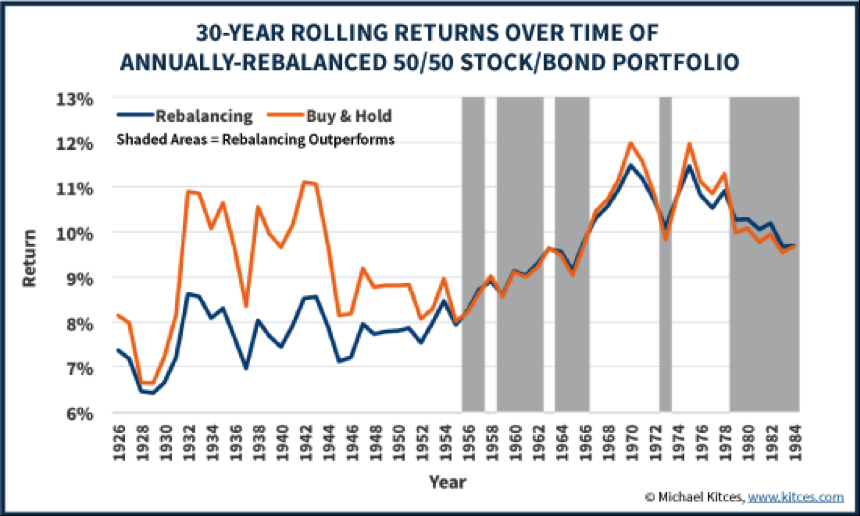
That is, the values of the eighties of about 10% respect 30 years of investment forward, and not backwardas in the previous example.
What are the ways to rebalance? The main rebalancing strategies are a function of time, deviation from the objective, or both
There are various ways of rebalancing, some simpler, others more complex.
Among the simplest and most commonly used we have:
Periodic rebalancing — rebalancing on a set date, such as monthly, quarterly, or annually.
Rebalancing by deviations (intervals or corridors) — rebalancing when a target asset allocation deviates by a predetermined percentage, such as 1%, 5% or 10%.
Mixed, periodic, and by deviations — rebalancing in a defined timeframe, but only if a target asset allocation deviates by a predetermined value, such as 1%, 5%, or 10%.
All have their advantages and drawbacks.
The rebalancing that we prefer because it is the simplest and sufficiently effective is the periodic and annual.
In addition to these simple forms or strategies for periodic and deviation rebalancing, there is also a more complex dynamics that is based on the protection or insurance of the risk of the portfolio.
Given its complexity is only used by some professionals, whether investment managers or financial advisors.
As rebalancing is always advantageous for the execution and management of investment risk, it is even more critical in the management of retirement funds and diversification
Rebalancing reform plans or funds
One of the most common areas that investors seek to rebalance are the appropriations in their retirement accounts.
Asset performance has an impact on overall value, and many investors prefer to invest more aggressively at younger and more conservative ages as they approach retirement age.
Often, the portfolio is more conservative when the investor prepares to withdraw funds to provide retirement income.
Rebalancing to Improve Diversification
Depending on market performance, investors may find a large number of current assets held in an area.
For example, if the value of X stocks increases 25% while Y stocks only gained 5%, a large amount of the value of the portfolio is linked to X stocks.
The rebalancing allows the investor to redirect some of the funds currently held in X stocks to another investment, be it more Y stocks or by buying entirely new stocks.
By having the funds distributed over multiple stocks, a fall in one share will be partially offset by the activities of the others, which provides a level of stability of the portfolio.


