What are large, mid and small caps?
In the very long run, small caps provide higher returns than large caps
Following the decision on asset allocation, between stocks and bonds, the question arises of choosing the subclass of these assets in which to invest.
In fact, an important question facing many investors is the choice of the type of stocks or bonds in which to invest.
For equities, the first decision is the choice of the geography of the investment (world, USA, Europe, Japan, emerging markets, etc.), followed by the nature or type of companies.
This decision is also called the choice of investment styles and includes the choice between value or growth equity strategies, and small and mid-cap versus large-cap strategies, among others.
This is the topic that we will address in this article, analyzing the historical performance of these two subclasses of shares.
To complement this article, in the Tools folder, we have developed in detail some of the main indices of the world stock markets of the stocks with the largest market capitalizations, namely the MSCI ACWI for the world market, the Dow Jones IA 30, the S&P 500 and the Nasdaq in the US, and in Europe, the Eurostoxx 50 and the FTSE 100).
We also include the Russell 2000 index of U.S. small and mid-caps.
What are large, mid and small caps?
Market capitalization, or market capitalization, is a measure of the size of a company.
It is the total value of a company’s outstanding shares
The delineation between each capitalization group can vary, but is generally as follows:
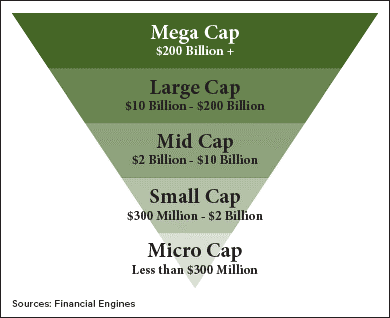
Mega cap: market cap of $200 billion or more
Large cap: market cap between $10 billion and $200 billion
Mid cap: market cap between $2 billion and $10 billion
Small cap: market cap between $250 million and $2 billion
“Micro cap”: market cap of less than $250 million
Large-cap stocks account for more than 90% of the U.S. stock market, and are often seen as the top investments in investors’ portfolios.
These stocks tend to be less volatile during unstable markets, as investors prefer quality and stability and become more risk-averse in these periods.
In the very long run, small caps provide higher returns than large caps
The following chart shows the valuations of major asset classes since 1926 in the U.S.:
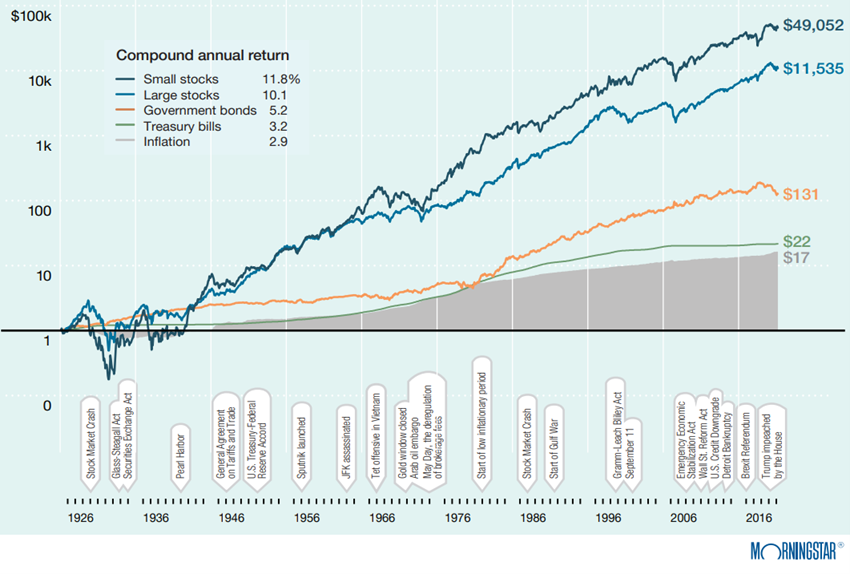
The highest average annual return rates were for small-cap stocks at 11.8%, which outperformed large-cap stocks at 10.1%.
It should be noted that these rates are well above the 5.2% of 10-year treasury bonds and the 3.2% of 6-month treasury bills.
In other words, the investment of $1 in 1926 appreciated by $49,052 in 2020, compared to the $11,535 reached by small caps, i.e., more than times more.
This has not only occurred in the USA.
The following chart shows the valuations of stocks of various capitalizations in the US and UK since 1926 and 1955 respectively:
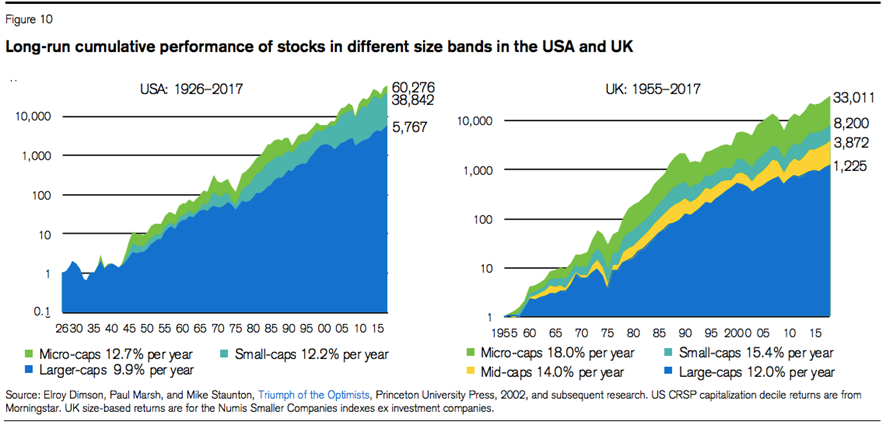
Larger-cap stocks in the U.S. and U.K. had very long-term average annual rates of return lower than smaller-cap stocks.
In the U.S., small-cap stocks provided RTPs of 12.2% per annum versus 9.9% per annum for large-caps, while in the UK, small-cap stocks had RTPs of 15.4% per annum versus 12% per annum for large-caps respectively.
In the U.S., micro-cap stocks had an average return of 12.7% per year, and in the U.K., this class of shares appreciated by 18% per year.
Since the Russell 2000 index began tracking the performance of small-cap stocks in 1979, the stock index has outperformed the S&P 500 large-cap stock index:
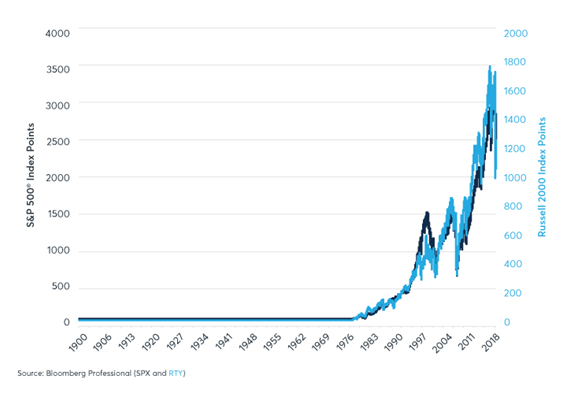
Over the past 30 years, the reality of S&P capitalization indices has been similar to very long-term developments:
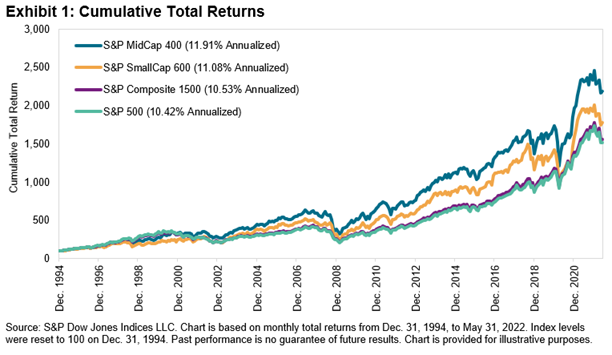
Since 1995, small caps have performed better than large caps, but in this period the best performer has been mid-caps.
The average annual rates of return were 12% in medium capitalizations, 11% in small capitalizations and 10.5% in large capitals.
In Europe as a whole, there is no such long-term information.
However, over the past 20 years, small caps have been much higher than large-caps:
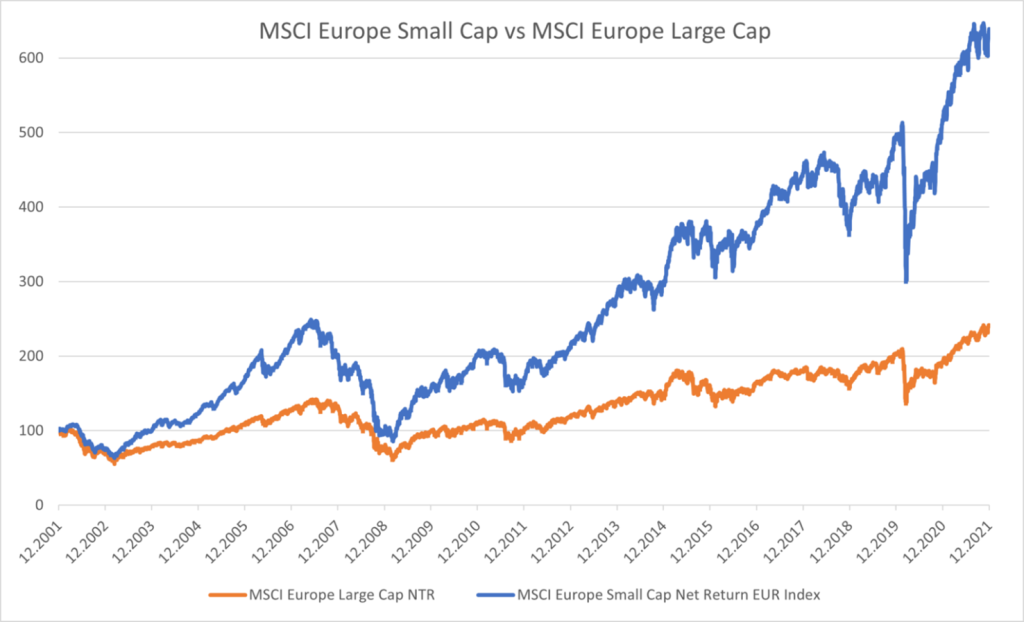
Small-caps appreciated by 494% compared to 141% for large caps in cumulative terms in this period.
This is an abyssal difference, almost 4 times more, far surpassing the North American reality.
This difference in the performance of small-caps versus large-caps between Europe and the US is largely due to the composition of the various segments.
In the U.S., large caps are dominated by technology companies, while in Europe, they are companies in the financial, energy, and telecommunications sectors.
The performance of small- and mid-cap stocks compared to large-cap stocks is also closely associated with the phases of the economic cycle, as we will see in the next article.


