


It is worth looking at the major indexes of small American stocks because they provide a different economic exposure to the world’s largest equity market and have shown a better historical performance than large companies in the very long run.
On the other hand, there are many ways to invest in these stocks, namely many mutual funds or ETFs on these indices, as well as many other active management funds that use these indices as a benchmark.
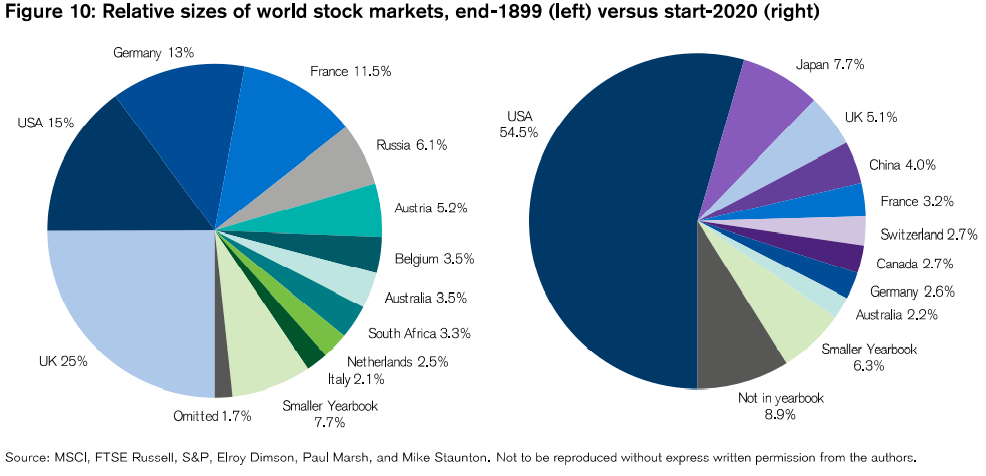
In fact, the US is the world’s largest equity market, with a weight of more than 54%:
In the last 94 years, between 1926 and 2019, small and medium-sized U.S. companies had an average annual return of 11.9%, up from 10.2% of the return of large companies:
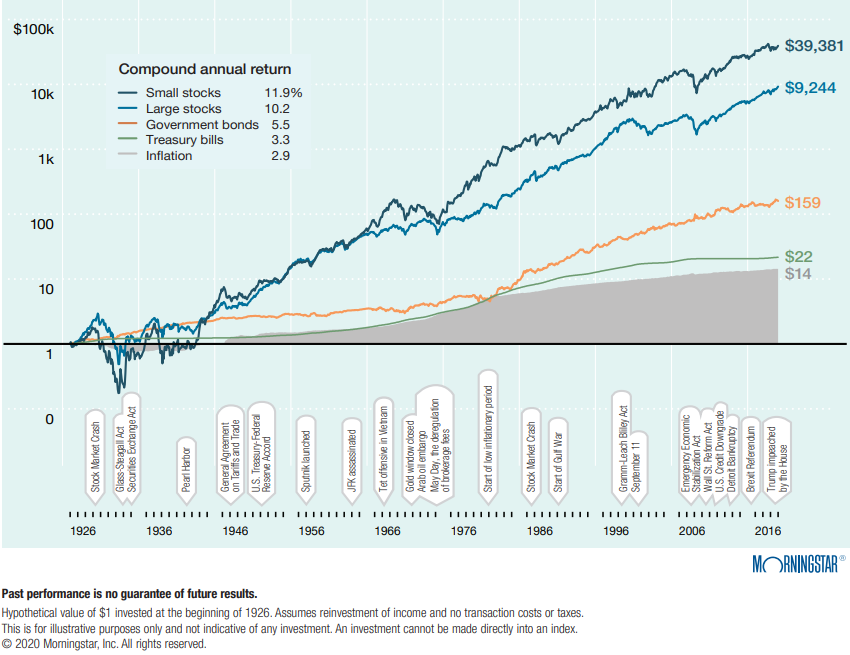
This difference in terms of average annual rates of return even seems small, but in terms of capital appreciation it is huge. A dollar invested in 1926 in small and medium-sized companies would result in $39,381 in 2019, which compared to the $9,244 earned from large companies. That is four times as many!
On this occasion it is also always good to remember that investing in stocks results in capital gains much higher than those obtained in bonds or treasury bills.
The Russell 2000 is the main US global stock market index of small and medium-sized capitalizations
The Russell 2000 and 3000 indices
Other indexes of small and medium capitalizations such as the S&P 600
Comparison of the Russell 2000 and 3000 with the S&P 600
Long historical performance and the last years of the Russell 2000 index
Comparison of Russell with S&P 500
The Russell 2000 is the main US global stock market index of small and medium-sized capitalizations
The Russell 2000 is the world’s leading index and benchmark for the overall performance of US small and medium-cap stocks.
Investment fund investors favour the Russell 2000 index because it reflects the investment opportunity presented throughout the market rather than the narrower opportunities offered by other indices, which may contain biases or greater specific stock risks and which may distort the performance of a fund manager.
Many investment funds, listed or not on the stock exchange, are linked or based on the Russell 2000.
The Russell 2000 and 3000 indices
The Russell 2000 index® measures the performance of the small capitalization segment of the US stock market.
The Russell 2000® Index is a subset of the Russell 3000® index, which consists of 3,000 of the largest U.S. stocks, and represents approximately 10% of the total market capitalization of that index. It includes approximately 2,000 of the shares of companies with lower market capitalization.
Both Russell 2000 and the Russell 300 are indexes weighted by the market value of the stocks that make them up.
Its sectoral composition in September 2019 was as follows:
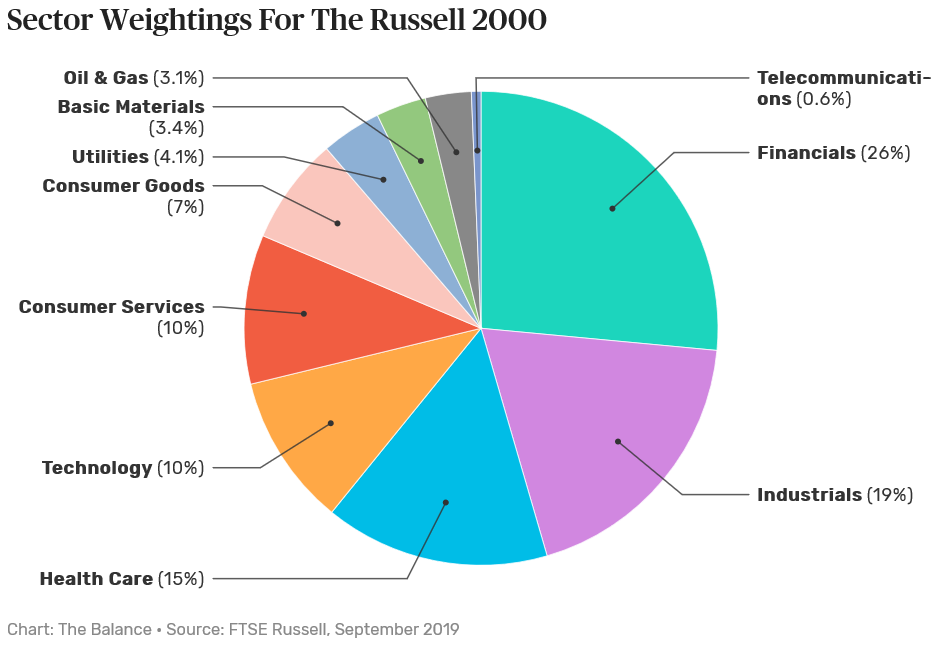
The largest sector is financials with 26%, followed by industry with 19%, health care with 15%, technology and consumer services with 10% each, consumer goods with 7%, and utilities, energy, and raw materials with 3% to 4% each.
The main features of the index are as follows:
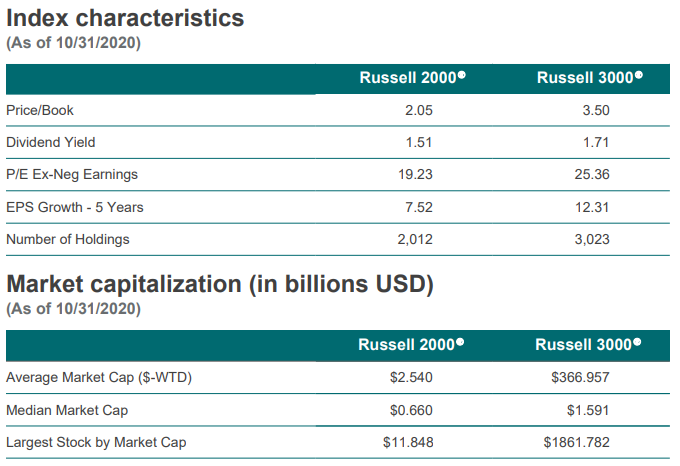
The average market capitalization of the Russell 2000 is $2.5 billion and the median of $660 million, compared to $366 billion and $1.6 billion, respectively, for the Russell 3000.
In the following links we have a brief characteristic of these indexes:
https://research.ftserussell.com/Analytics/FactSheets/temp/75b91550-fbb3-4f83-9374-4b120e9f4fbf.pdf
https://research.ftserussell.com/Analytics/FactSheets/temp/26f43802-94e7-4a83-ac73-b3c2f7e0cd5f.pdf
Other indexes of small and medium capitalizations such as the S&P 600
The S&P SmallCap 600 Index (S&P 600) is a stock index established by Standard & Poor’s. It roughly covers the range of small stock capitalizations of US stocks, and is a capitalization-weighted index.
To be included in the index, a stock must have a total market capitalization ranging from $600 million to $2.4 billion at the time of addition to the index.
As of January 31, 2020, the median capitalization of the companies in the index was $1.1 billion and the index covered about 3% of the total US stock exchange. These small stocks cover a narrower range of market capitalization than the companies covered by the Russell 2000 Smallcap index, which ranges between $169 million and $4 billion.
The combination of the S&P 400 MidCap index combined with the SmallCap 600 make up the S&P 1000, and the S&P 1000 plus the S&P 500 make up the S&P 1500.
In the following link we have a brief characteristic of this index:
Comparison of the Russell 2000 and 3000 with the S&P 600
As one of the oldest indexes of small listed companies, the Russell 2000 is the most popular and has become the benchmark for many active managers of small capitalizations.
However, the performance of this index has been surpassed by many other small indexes, which makes it less appealing to follow.
A Morningstar study showed that over the 10 years to June 2019, the Russell 2000 was beaten by the S&P SmallCap 600 and the CRSP US Small Cap indexes by more than 1.5% a year.
This study also concluded that over the 15 years to June 2019, the Russell 2000 index was not only beaten by the S&P SmallCap 600, but also by the US Small Cap CRSP, MSCI USA Small Cap, and Dow Jones U.S. Small Cap indexes by at least 97 basis points per year.
The popularity of the Russell 2000 index may help explain its poor performance.
As there is a lot of capital associated with this index, there is considerable pressure on prices when stocks are added or removed from the index. Prices go up when new constituents are added and are pressed down when stocks are removed, which can degrade index performance. And the movements of outputs and entries in the index are exclusively dictated by capitalization and made in a single day.
This issue is exacerbated by the fact that the Russell 2000 index contains less liquid companies and therefore with higher transaction costs, because it goes down more on the market capitalization scale than some of its peers, and has a lower requirement in terms of the value of shares admitted to the price or “free-float”).
Long historical performance and the last years of the Russell 2000 index
The following chart shows the performance of the Russell 2000 index in the 10 years to September 2020:
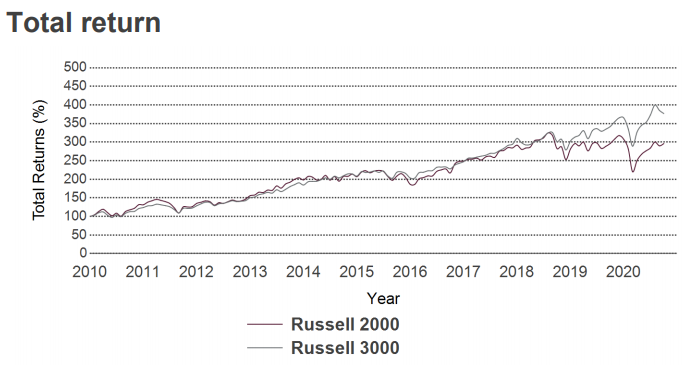
The following table shows the annualized returns for the 10 years prior to October 2020 for the Russell 2000 and Russell 3000, as well as the annual yields of the last 5 years:
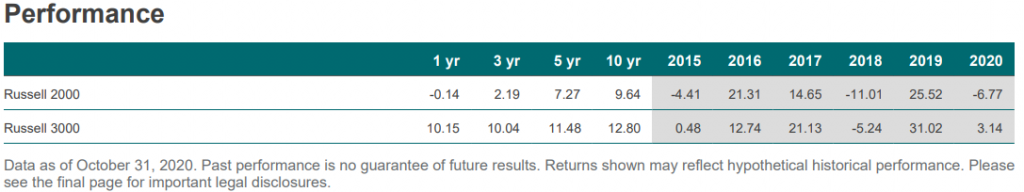
The annualized return of the Russell 2000 was 0%, +2.1%, 7.3% and 9.6% on investments made in for the 1, 3, 5 and 10 more recent years.
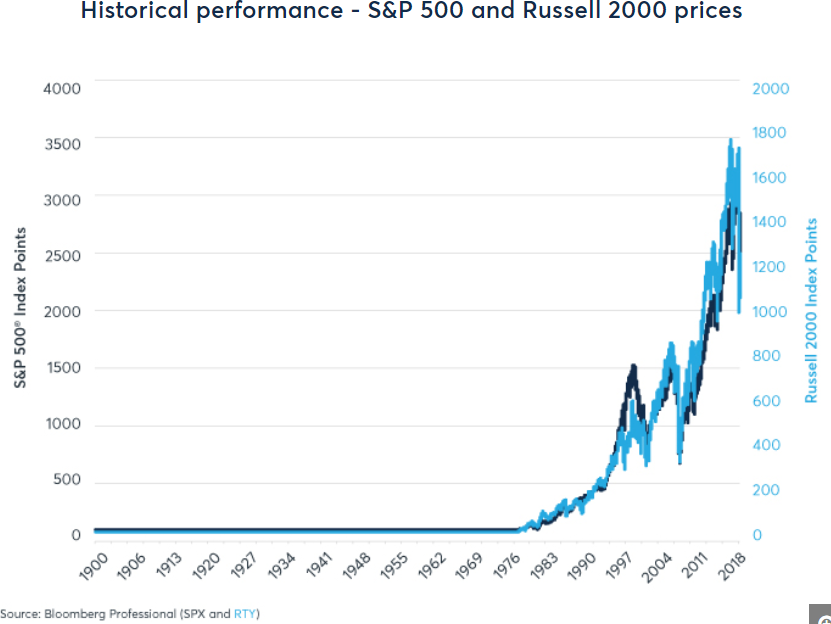
Comparison of Russell with S&P 500
Since the Russell 2000® began tracking the performance of small equity stocks in 1979, the stock index has had the same overall performance as the S&P 500® of large equity stocks:
Although the overall performance of the two stock indexes was similar in the period, there are times when one index was better than the other:
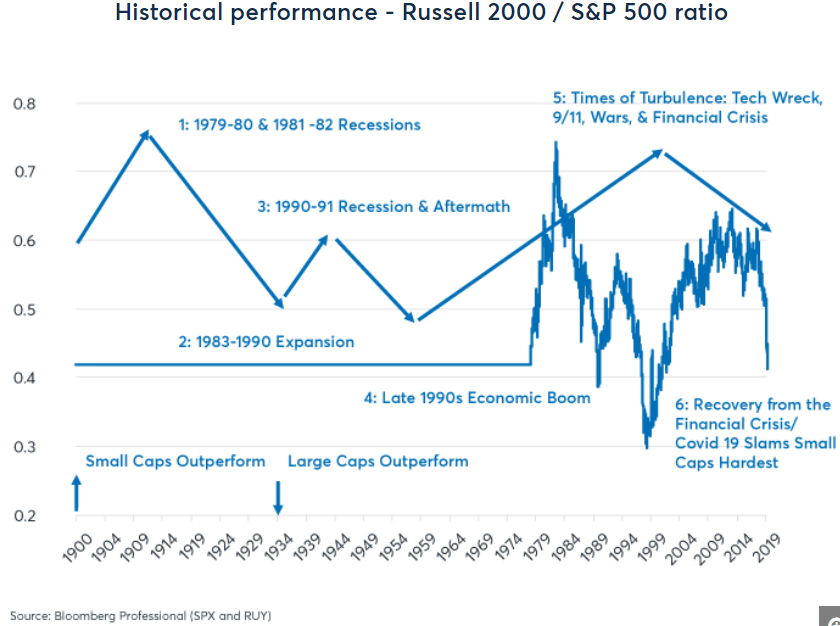
The evolution of the ratio between small and large capitalisations shows that large ones often outperform small ones in advanced stages of upmarket cycles and during the phases of strong economic expansion.
Although its correlation is generally high, being 0.8 on average and ranging from 0.6 to 0.96 on a one-year basis), they differed significantly a few times:
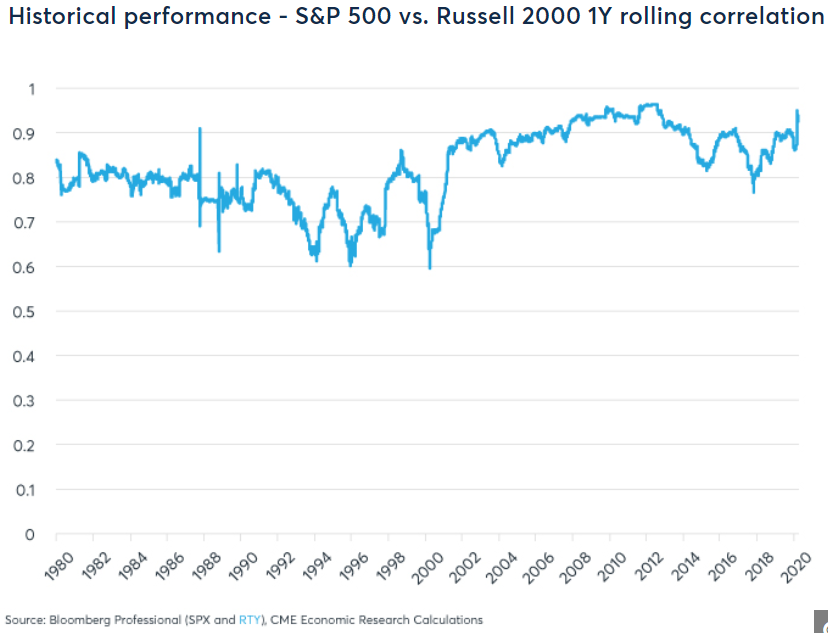
The fact that there is a high correlation between small and large capitalisations is somewhat frustrating for long-term investment managers, as it limits the benefits of diversification.
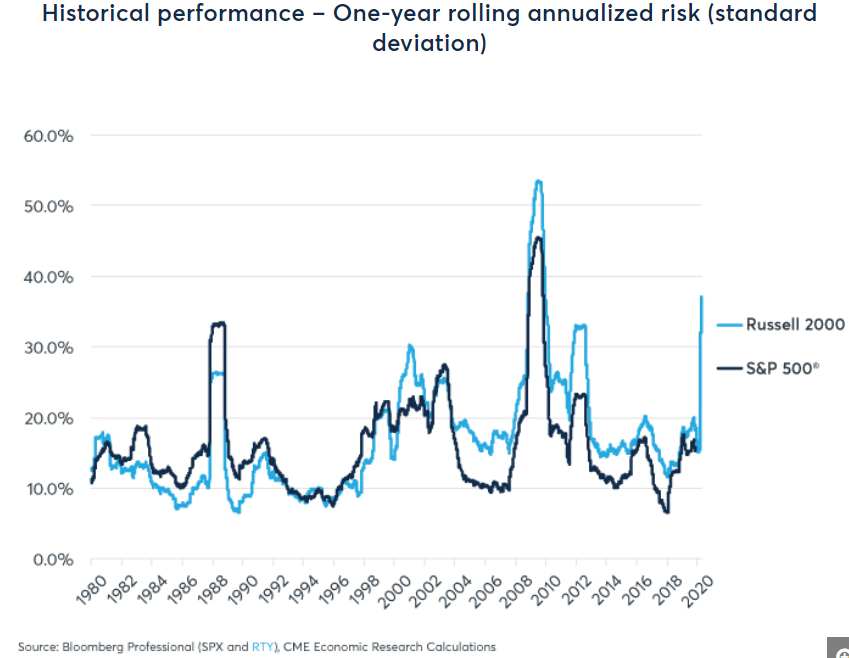
Since 2000, perceived volatility has been higher for small equity stocks than for large capitalizations, although this was not the case before the year 2000:
As we said in the beginning of this post there are many forms and investment products to invest in shares of small and medium capitalizations but this matter will be developed in a subsequent article.


