The main entities managing the indices of the stock and bond markets
The main global indices stock markets: MSCI ACWI (total world, comprising developed and emerging markets), MSCI World Index (developed markets only) and MSCI Emerging Markets (emerging markets only)
Long and recent historical performance of stock market indices
In this and other posts that will follow we will see the main indices of financial markets worldwide.
The main entities managing the indices of the stock and bond markets
These indices are managed and maintained by entities properly organised for this purpose and follow defined and made public calculation rules.
There are several global index management entities and the main ones are:
- In terms of shareholder markets, MSCI (Morgan Stanley Capital International), Stoxx Limited and FTSE, as well as national entities normally associated with the management of the exchanges.
- In terms of bond markets, Bloomberg Barclays (formerly Lehman Brothers), Iboxx and JP Morgan.
https://www.bloomberg.com/markets/rates-bonds/bloomberg-barclays-indices
https://ihsmarkit.com/products/iboxx.html
https://www.jpmorgan.com/country/US/EN/jpmorgan/investbk/research/indexresearch/vendor/packages
Before we look at the various stock indices, it is worth keeping in mind the weight of the different global stock markets that we saw in a recent post to get an idea of their relative importance:
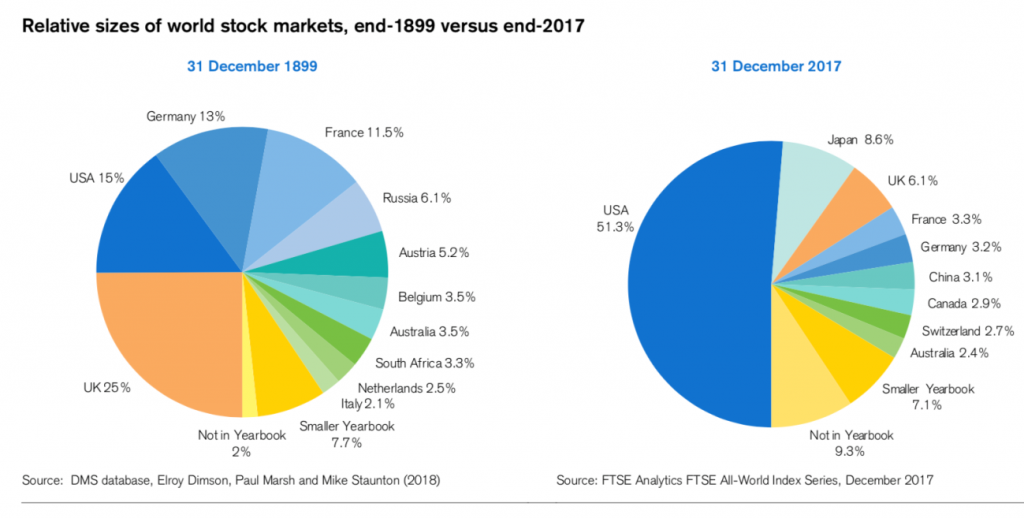
Currently, the US accounts for more than 50% of the world stock market, Japan 9%, the UK 6%, the Eurozone about 12%, the other developed markets 8% and emerging markets 14%.
The main global indices stock markets
Total or developed world market
MSCI, from Morgan Stanley Composite Index’s MSCI is the leading index management company in the world’s stock market, with its indices being used as a benchmark by the vast majority of asset, asset and investment management entities, as well as a large number of financial institutions around the world.
Currently, its indexes have the following constitution:
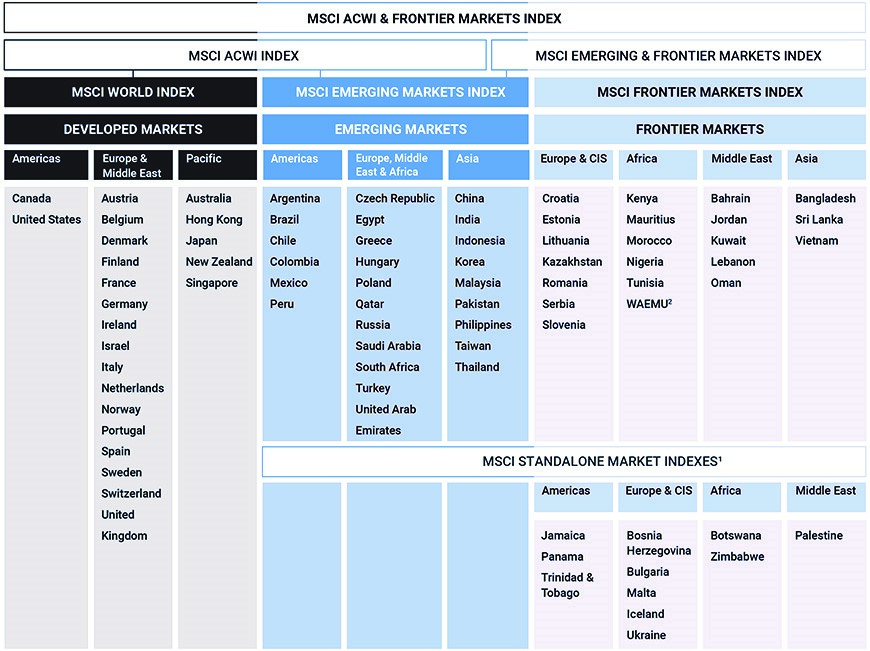
Frontier markets are very incipient and high-risk economies and markets, so in our opinion they should not be used by private investors in managing their investments (being reserved for professional investors) . For this reason, we will not look at these indices of the frontier markets.
In these terms, its main global indices are MSCI ACWI, MSCI World and MSCI Emerging Markets, which we will see next.
MSCI ACWI (total world, comprising developed and emerging markets)
The Morgan Stanley All Country World Index (MSCI ACWI) represents the overall and average capitalization of 23 Developed Markets (DM) countries and 26 Emerging Markets (MS).
As of February 2020, this index contains 2,853 shares of the largest companies in these countries and covers approximately 85% of the global set of tradable stock opportunities.
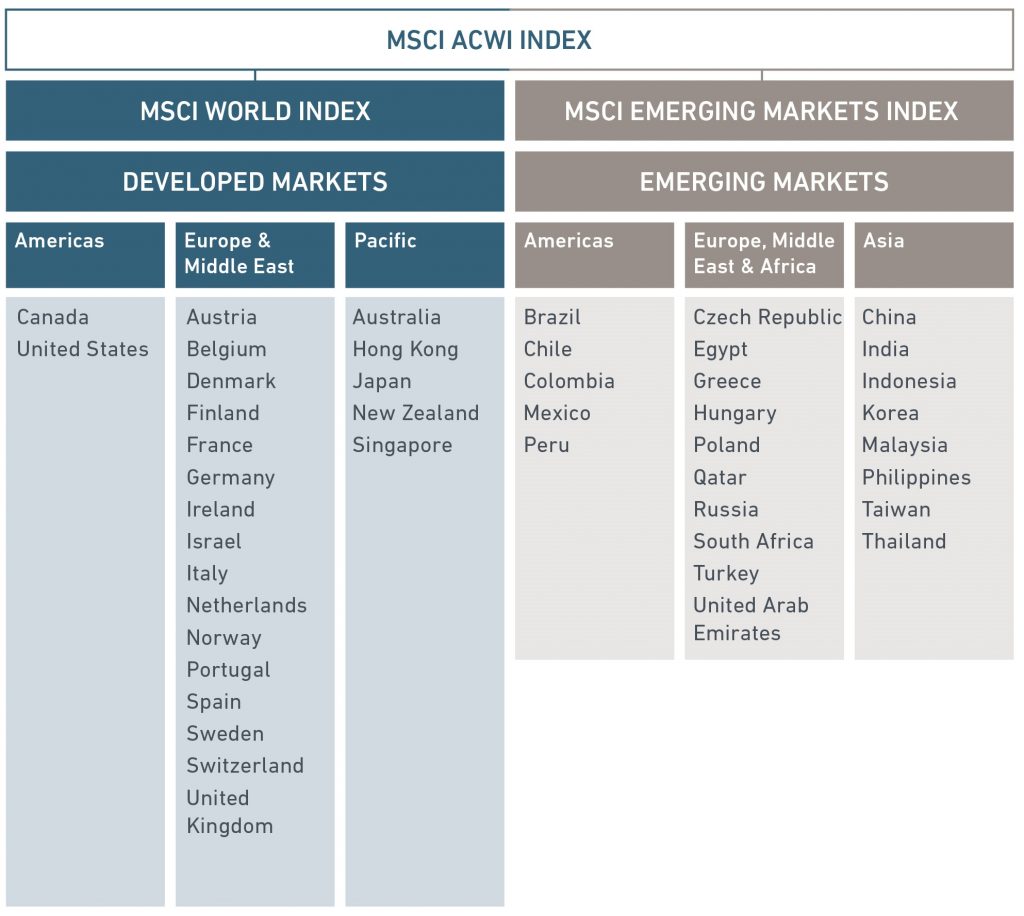
It covers a global stock market capitalisation of almost €50 billion.
Its composition is as follows:

The US accounts for 56% of the total, followed by Japan with 7%, the UK with 5%, China with 4%, France with 3% and the remaining countries with 25%.
The most important sectors are technology with a weight of 18%, financial with 16%, followed by health, durable goods and industry with 11% each, telecommunications and consumer goods of companies with 8%, and with less weight energy, basic materials, utilities and real estate.
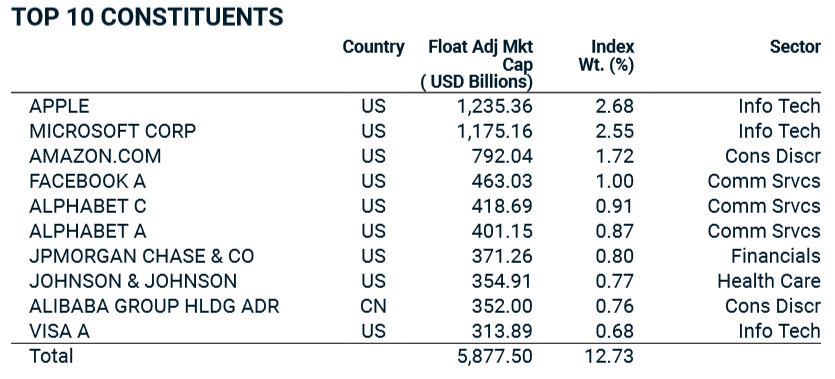
Its top 10 companies are as follows:
In the following link we have a brief feature of this index:
https://www.msci.com/documents/10199/8d97d244-4685-4200-a24c-3e2942e3adeb
World Index (developed markets only)
The MSCI World Index represents the capitalization of the largest companies in 23 Developed Markets (DM) countries.
As of February 2020, this index contains 1,653 shares of companies and covers approximately 85% of the market capitalization traded on the stock exchange adjusted to the market capitalization of each country.

It covers a global stock market capitalisation of around €42 billion.
Its composition is as follows:
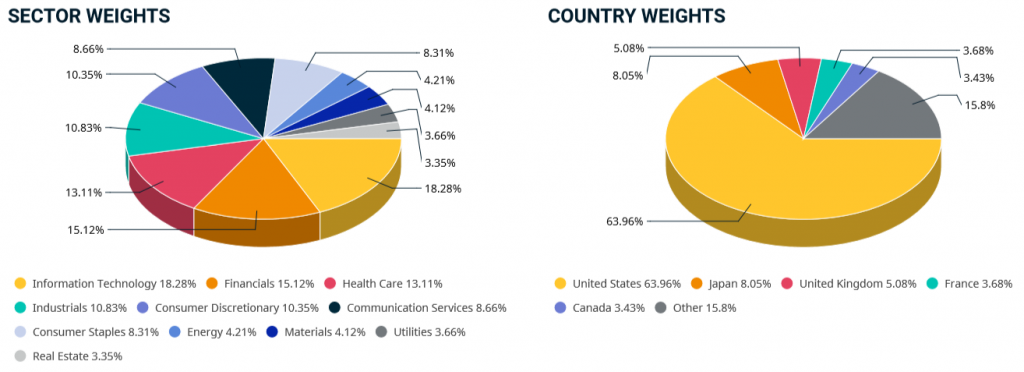
The most important sectors are technology with a weight of 18%, financial with 15%, health with 13%, industry and durable consumer goods with 11% each, followed by consumer goods of companies, telecommunications, energy, basic materials, utilities and real estate.
Its top 10 companies are the same as the previous index, but with higher weights:
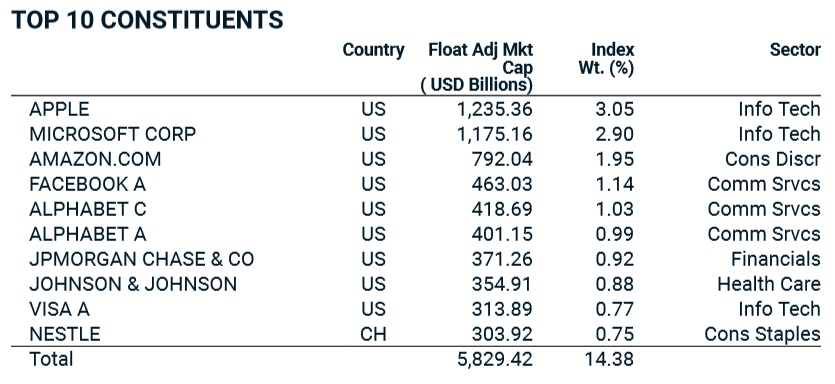
In the following link we have a brief feature of this index:
https://www.msci.com/documents/10199/149ed7bc-316e-4b4c-8ea4-43fcb5bd6523
Emerging Markets: MSCI Emerging Markets (emerging markets only)
The MSCI Emerging Markets Index contains an additional 1.200 shares of the largest companies in terms of stock capitalization in 26 emerging markets in February 2020.
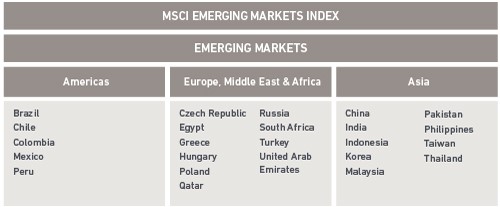
It covers a global stock market capitalisation of more than €5.5 billion.
Its composition is as follows:
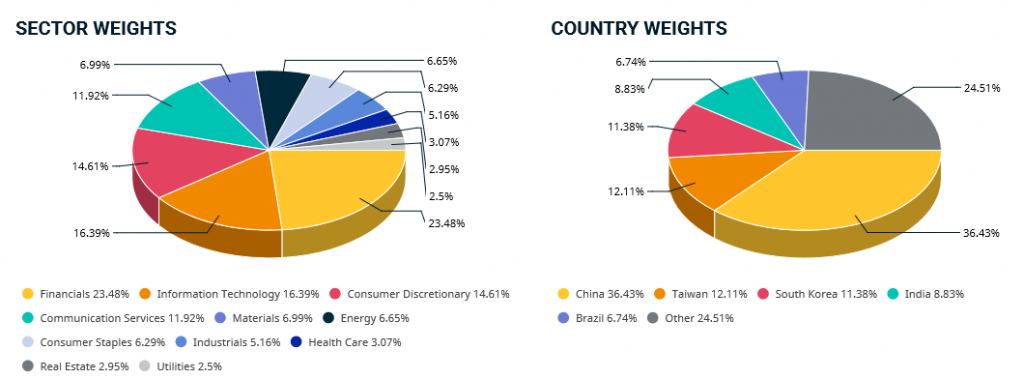
China represents 37% of the total, followed by South Korea and 13%, Taiwan with 12% to 13% each, India with 9%, Brazil with 7%, South Africa with 6%, Russia 4%, Mexico 3%, Thailand 2% and the remaining countries with 12%.
The most important sectors are the financial with 24%, the technology with 16%, durable goods with 14%, telecommunications 11%, energy, raw materials and consumer goods of companies with 7% each, industry with 5%, followed by public goods, real estate and health with 3% each.
Its top 10 companies are as follows:
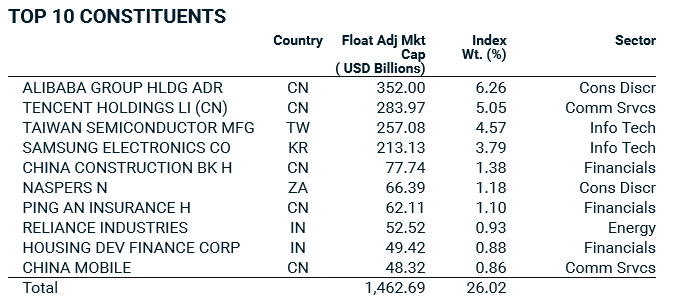
In the following link we have a brief feature of this index:
https://www.msci.com/documents/10199/c0db0a48-01f2-4ba9-ad01-226fd5678111
Long and recent historical performance of major stock market indices
The historical performance of the main shareholder markets between 1900 and 2017 was as follows:
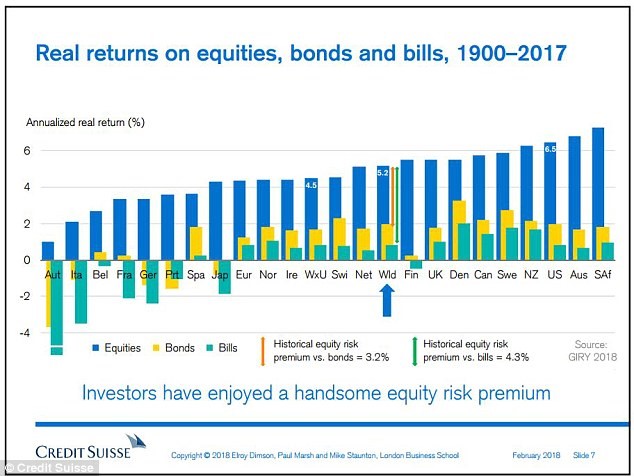
Annual real rates of return (deducted from inflation) were 5.2% for the world market and 4.5% for the World excluding the US.
The evolution of the main indices in recent years was as follows:
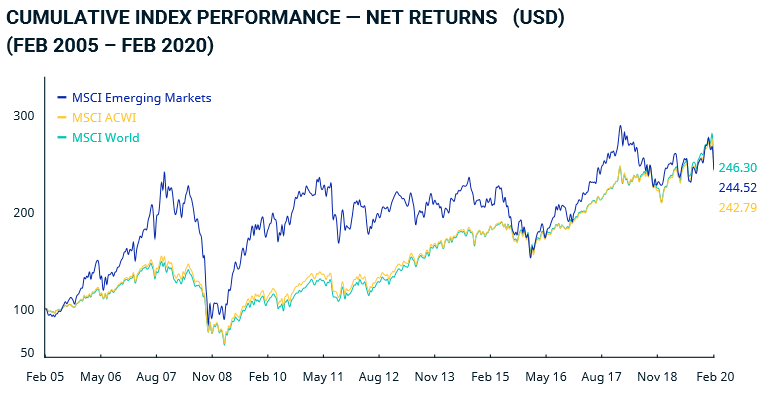
In the last 15 years these rates have recorded a similar appreciation of around 140%.
All these indexes had significant declines in the great financial crisis. Emerging markets were the first to recover in the post-crisis period and had higher gains until mid-2015, having since been surpassed by advanced markets.

Since December 2000, emerging markets have had average annual returns of 8.48%, compared with 4.95% of advanced markets.
Over the past 5 and 10 years, advanced markets have shown average annual returns of 5.9% and 8.8%, respectively, compared with 2 % and 3.2 % in emerging markets.


