#1 We must build our financial plan by defining the allocation of assets between the two main classes, stocks and bonds, and their subclasses, depending on our objectives and investor profile
An example of simple and efficient diversification: the traditional 60/40 portfolio
Naïve or Apparent Diversification happens when we try to do everything at the same time and without thinking about it, instead of using a logical plan, a method, a sequence, or reasoning
Naïve or apparent diversification consists of seeking to reduce risk but using only different sources.
This bias lies in the fact that when we are asked to make multiple choices at the same time, we tend to diversify more than when we make the same kind of decision sequentially.
Itamar Simonson showed, in the context of marketing and consumer decisions, that when people have to make simultaneous choices (for example, choosing now which of the six snacks to consume in the next three weeks), they tend to look for more variety (e.g., choosing more types of snacks) than when they make sequential choices (for example, choosing once a week which of the six snacks to consume this week over the three weeks).
Shlomo Benartzi and Richard Thaler studied whether the effect manifests itself among investors who make decisions in the context of defined contribution savings plans.
They found that some investors follow the “1/n strategy”: they divide their contributions evenly among the funds offered in the plan. As a result of this naïve notion of diversification, they found that the proportion invested in equities depends heavily on the proportion of equity funds in the plan.
A good image to retain on what is apparent or naïve diversification is that it is not because we eat different parts of the cow that our diet gets richer and healthier, without any prejudice for or against vegetarians.

This conclusion is particularly worrying in the context of lay people who make financial decisions, as they may think they are diversifying, but they do so in a sub-optimal way.
We often see similar manifestations of this bias in other contexts.
There are investors who have become accustomed to investing in a small set of securities, in some stocks, which they think they know better. In many cases these are specific stocks, either mainly domestic stocks for which the investor has become accustomed to investing, or sectorial stocks in which the investor has superior technical or professional qualifications and arises in particular in the fields of energy or oil, banking, biotechnology or technology, or even fashion or trendy stocks, such as technological ones in the 2000 bubble , bitcoin, etc.
To this extent, the home bias, which overweight’s domestic or regional securities over international or worldwide, is also an example of naïve diversification. To avoid being too thorough we will address this bias in a following post, as we are now focusing on other aspects.
How can we avoid this bias and make a correct diversification, that is, personally appropriate and efficient, of our investments?
#1 We must build our financial plan by defining the allocation of assets between the two main classes, stocks and bonds, and their subclasses, depending on our objectives and investor profile
In general, the logical and rational process of building the personal financial plan comprises the following steps:
- Setting our financial objectives
- Assessment of our financial resources and capabilities
- Determination of our investor profile
- Definition of diversified asset allocation and more appropriate to our situation in the two main classes, stocks and bonds, and their subclasses or segments (geographies, credit rating, currency, etc.)
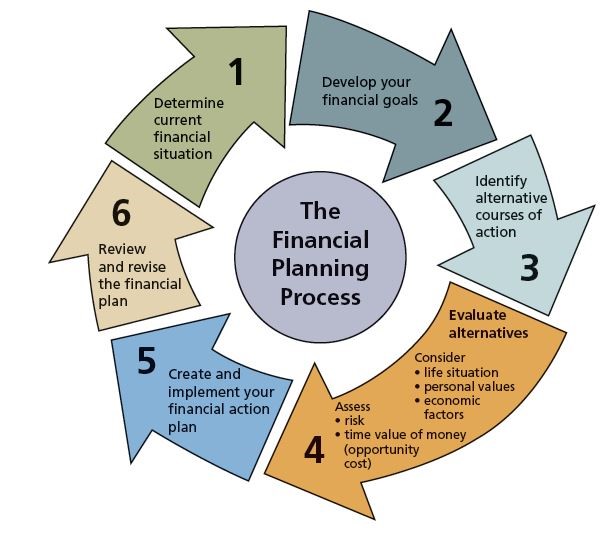
The diversification of asset allocation is based on the old saying of not laying all eggs in the same basket, combining the two main classes of assets, stocks and bonds, in their subclasses or segments (geographies, credit rating, currency, etc.) in proportions that are aligned with our objectives, interests, needs and financial capacities.
#2 We must try to make this proper diversification efficient, i.e. to maximise profitability for our level of risk or investor profile
We know that in finance there are no free lunches, that is, if we want more profitability, we will have to accept more risk, and vice versa.
Harry Markowiz, Nobel prize winner in Economics for studies published in 1952 on efficient investment diversification, has shown that it is possible to improve our expected return to a given level of risk if we diversify correctly.
What we must do is to eliminate the individual investment risk in each security so that we are reduced to the risk of the market in general, which is not diversifiable.
To this end, we must choose between the desired investments those that have a low correlation with each other.
The following chart shows the graph of efficient diversification for various levels of risk or investor profile in the case of equity investments (in the S&P 500 stock index, the main U.S. and global stock index) and in 10-year U.S. treasury bonds between 1970 and 2019:
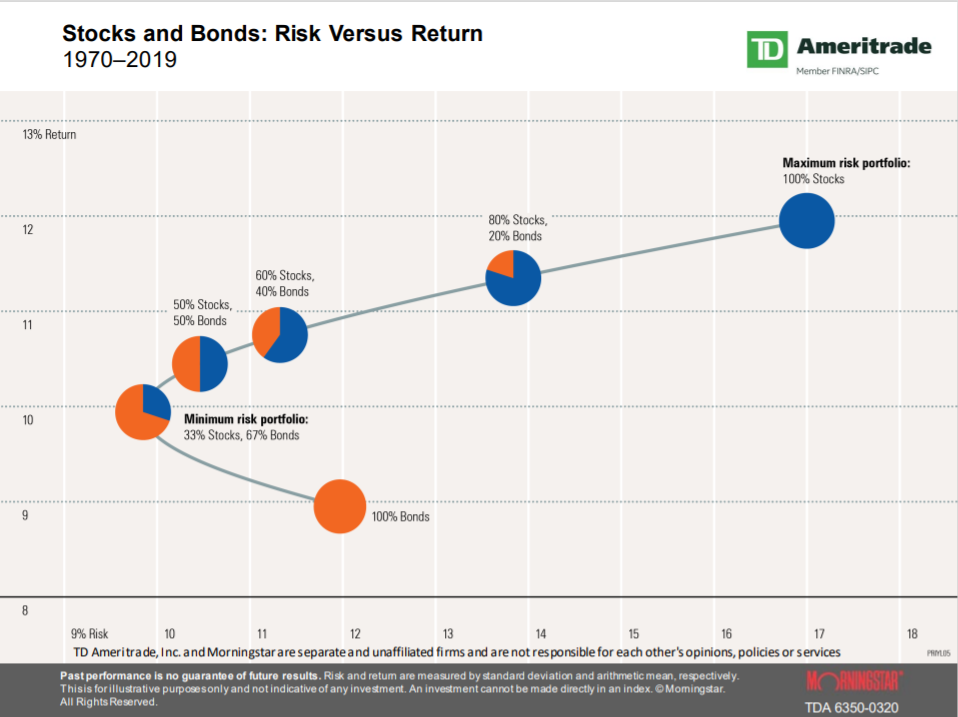
This chart shows all combinations of return and risk of investments for different combinations of stocks and bonds.
Each risk level or investor profile is represented on the horizontal axis by the standard deviation (deviations of return in relation to its average) of investment portfolios.
The curve is also called the efficient frontier of investments and takes the form of a V or a tick lying down.
We can choose N combinations of investments between stocks and bonds, which result in trade-off of return and risk on or inside the curve down to the horizontal axis.
The combinations of investments that are on the curve or at the border are efficient ones, i.e. those that maximize returns to a given level and risk. We see that through diversification we were able to increase returns without increasing risk, because by changing from 100% in bonds to a portfolio of roughly 60% in stocks and 40% in bonds we would have increased annual returns from 9% to more than 11%.
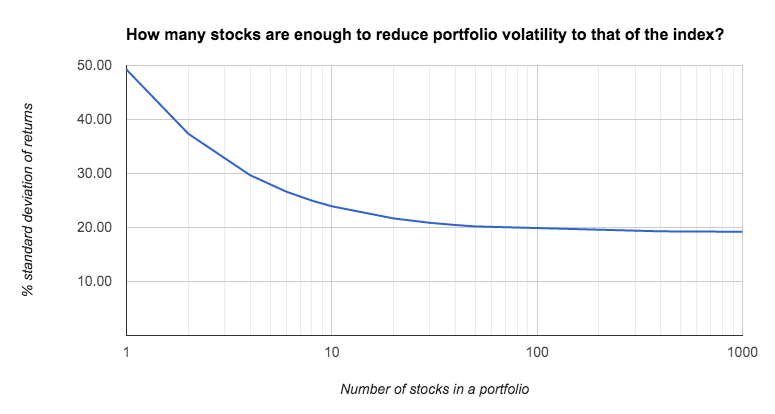
Years later, in the late 1970s, Elton and Gruber showed that if we invest in 30 stocks or more we can eliminate individual risk and be exposed only to market risk (William Bernstein disagrees stating that not even 100 stocks would be enough):
#3 We should select investments that are diversified and better reflect the subclasses or segments of the two main asset classes
The next step is to select the investments best aligned with asset allocation by previously defined subclasses or segments, and this selection has two dimensions: greater representativeness, and lower cost.
To that end, the first decision is to choose and invest directly and individually in the securities concerned, whether stocks or bonds, or to invest in a collective investment vehicle of the type of a mutual fund or equivalent product which is composed of a portfolio of several securities).
In this context, we prefer to invest in mutual funds or equivalent products, and among them, indexes or indexes.
We choose index or indexed funds or products because they are the ones that best reflect the asset subclasses of the intended asset allocation, which strengthens the rationale and logic of the process.
In addition, funds or investment products, as collective vehicles, are more economically efficient. That is, it is cheaper to invest in securities in these funds than to do so individually due to transaction and other costs, because we benefit from economies of scale.
In addition, index or indexed funds or investment products, also called passive management products, have provided better historical returns than active management funds, those which are managed by a professional manager.
The following chart shows the results of Morningstar’s most recent study for about 5,000 investment funds in the U.S.:
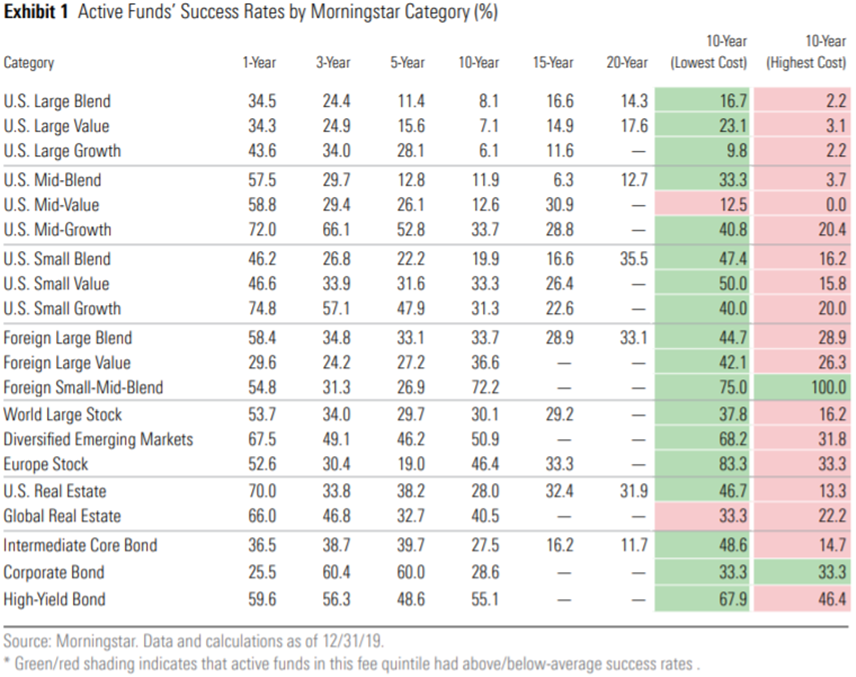
Even on a long-term horizon as 10-year investment periods, only less than 10 percent of active US equity fund managers beat the index. These percentages increase to 15% to 25% in cheaper funds, which also proves that the lower the costs the better the returns.
In the case of bond funds and for the same 10-year investment period, these percentages increase to 28% in treasury securities and investment grade companies, and 55% for speculative grade companies.
In all other categories, such as medium and small-sized US stocks, international stocks, real estate, etc., the percentages are in those ranges of US equity and bond funds.
In many cases, the best can be the enemy of the good: What are the limits for efficient diversification?
The other of the question is how far we should go and invest in efficient diversification. What are your limits and when it starts to be inefficient? The answer is that when efficiency gains are small and easily outweighed by complexity costs.
We know that efficient diversification does not increase future returns by itself. If we invest in one or a few securities with observed future returns higher than the efficient one, we have a higher capital appreciation. What diversification provides is the maximisation of expected profitability for a given level of risk or vice versa.
Put another way, if we knew which securities would provide the highest returns in the future would not be worth diversifying. The point is that we do not know, and we have seen that few know, so it is best to assume that we must maximise the expected profitability through efficient diversification.
This raises the question of how far to advance in maximization or optimization, because not only do many investors do not know what are the methods or models of backtesting or Monte Carlo simulations used by professionals in the exercise of diversification, as there are studies that show that complex approaches do not always provide gains (especially taking into account that the assumptions required by the models are many and have great impact).
That is, the most common decision making by individual investors to simply have some of this and some of that is less feasible? This is an extremely important issue and at the very heart of the investment.
Rabbi Issac bar Aha seems to have been the grandfather of all this, having proposed around the 4th century, that one should “put a third on land, a third in merchandise and a third in cash”. It’s good advice that’s still solid enough, 1600 years later!
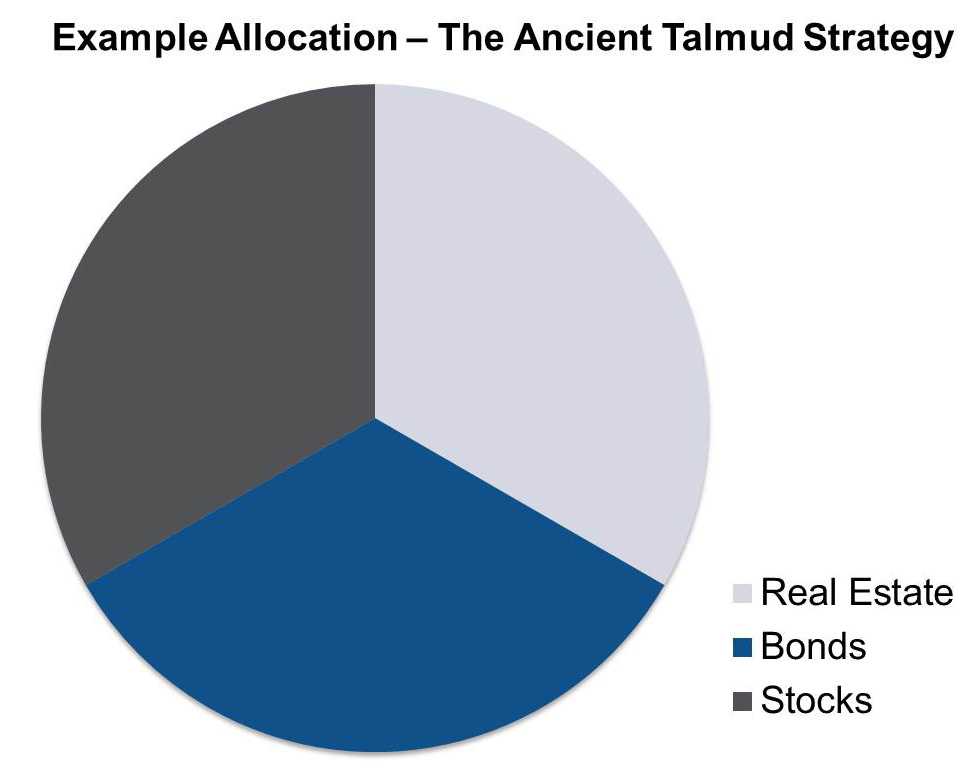
To some cynics and scientists, it seems too simple to be true, that one can achieve anything close to an optimum merely by putting one-third of your money in real estate, one-third in securities (the modern equivalent of merchandise) and the rest in cash. Alternatively, the classic pie charts that are divided into high-, medium- and low-risk portfolios are very straightforward, and there may be nothing wrong with them.
Even Harry Markowitz, who won the Nobel Memorial Prize in Economic Sciences for his optimization models, evidently just divided his money equally between bonds and equities, for “psychological reasons.” It was simple and transparent; in practice, he was happy to leave behind his own award-winning theories when it came to his own funds
In many cases the simplest is good, very good, excellent, or even almost perfect because it is easy to make and understand. And sophistication, maximization or optimisation is worse, if not bad, because it is complicated and not noticeable and inhibits or prevents us from making investments.
An example of simple and efficient diversification: the traditional 60/40 portfolio
A simple example of efficient diversification that applies to many cases is the traditional portfolio 60/40, 60% of stocks and 40% of bonds.
In the following chart, we see the comparative performance of 100% global equity (MSCI World), 100% global bonds (Barclays Global Aggregate) and the combined traditional and common portfolio of 60/40 of those stocks and bonds, respectively, between 1990 and 2019:
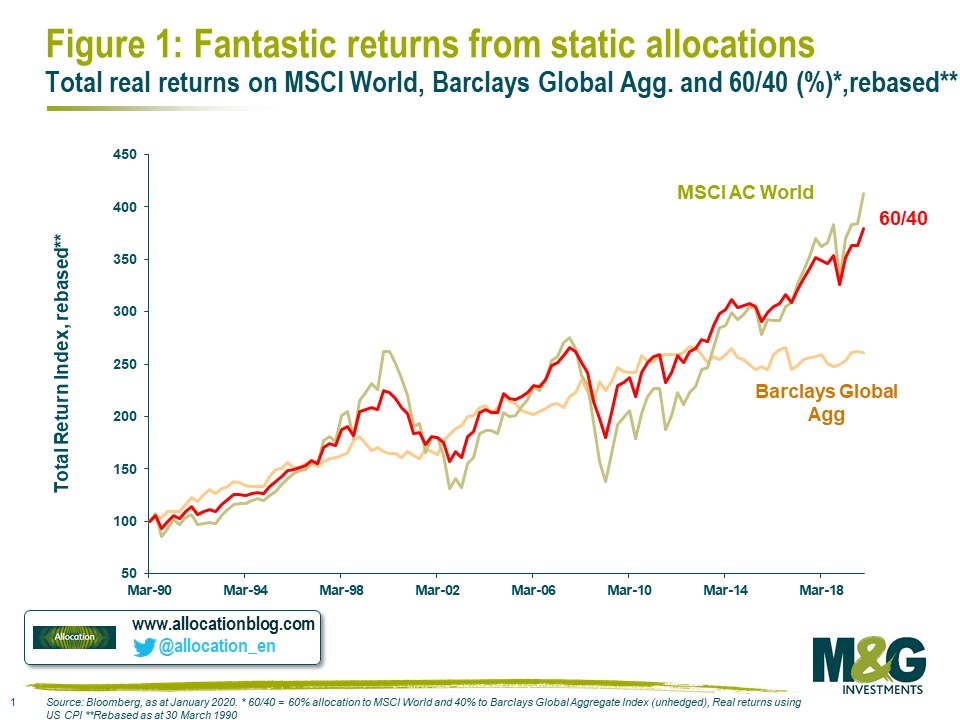
In terms of cumulative returns in real terms (adjusted for inflation or purchasing power measures), the 100% share portfolio or the combined 60/40 portfolio has virtually the same results, increasing its value by 300% in the period, double the 150% of the 100% bond portfolio.
The 60/40 mixed portfolio has the advantage of having shown lower volatility than the 100% in shares provided by the stabilizing or buffering function of the bond component, which is very important for investors especially in periods of heaviest stress or financial crisis.
It should be worth noting that even the mixed portfolio of 60/40 had some volatility:
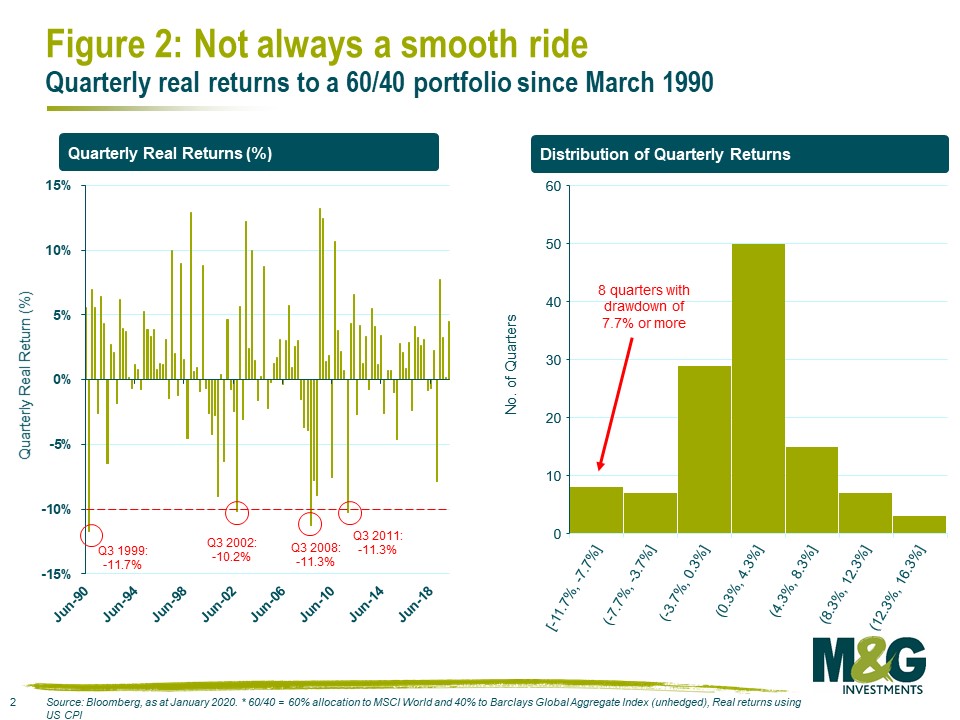
There were several quarters in which real yields were negative, of which 8 were higher than -7.7%. However, in most quarters the real returns were positive and, in many cases, very interesting, exceeding 4.3%. And in the end the capital appreciation was very meaningful.
https://thedecisionlab.com/biases/naive-allocation/
https://www.behavioraleconomics.com/resources/mini-encyclopedia-of-be/naive-allocation/


