How do we pass the financial active life baton to retirement? What is the value of public or social pensions paid in retirement?
How do you pass the active life baton to retirement in terms of income from work to pensions?
How does the pension compare to the last wage? The gross and net replacement rates of pensions in the OECD
The calculations we can make
How do you pass the baton of active life to retirement in terms of income from work to pensions?
Our life has similarities with the relay athletics test, but the longest. And the baton is passed on to us, even though with another route ahead.
The first question that many have when we think about retirement is how our pension compares with the value of the last salary at the time of retirement. No one likes to walk backwards or lose a standard of living. We know that our current spending is probably not as high as the ones we have while we work.
However, attention! Studies show that the savings are not that great. Several point to needing about 85% of the last salary. In addition, we want to have money for extra spending that will allow us to enjoy life.
So that question is very pertinent.
Not being able to guess the future, it is possible to know the present reality.
In Portugal, as in many of the most advanced countries, the estimated value of pensions can be obtained through electronic or face-to-face consultation with Social Security services.
A reasonable approximation to the value of the average citizens’ pension can be obtained through the statistics produced for OECD countries.
Two figures are published, the estimated value of pensions according to the last salary and the amount of annual salaries equivalent to the current value of pensions due, i.e.:
- The average gross replacement rate and more appropriately the net of pensions with average salaries;
- The current value of pensions due, measured in number of annual salaries, in gross and net terms.
How does the pension compare to the last wage? The gross and net replacement rates of pensions in the OECD
The so-called gross pension replacement rate is defined as the quotient between the value of the pension and the last wage.
This rate measures the pension system’s ability to provide a replacement of income for retirement age. This indicator is measured as a percentage of the last income from work and by gender.
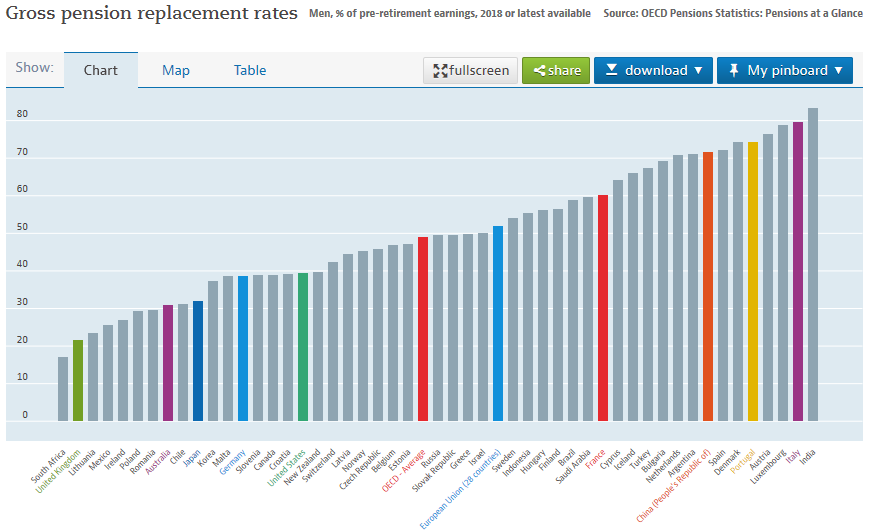
The following graph shows the rates of gross pension replacement for an average income earner in the various OECD countries, highlighting Portugal and some of the world’s largest regions or economies, such as the OECD, European Union, US, UK, China, Japan and Australia.

The average value of the pension in relation to the last gross wage or the gross replacement rate is 74% in Portugal, above the 58% of the average of the 28 countries of the European Union and 54% of the OECD average.
This rate is highest in China, India and Italy, among others, and very low in countries such as the UK (23%), Australia (30%), Japan (35%) and the USA (38%).
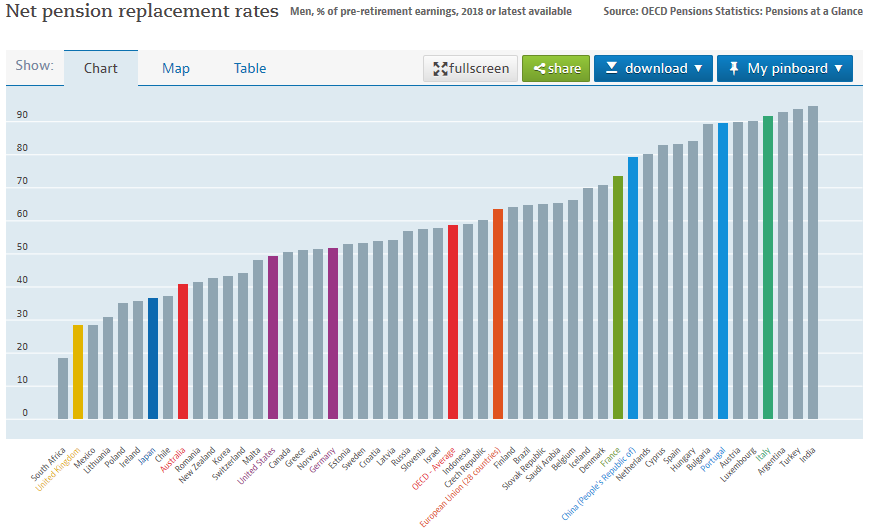
Even more relevant than the gross replacement rate is the net replacement rate of the pension, defined as the same quotient between the values of the last income from work and that of the pension, but in net terms of taxes and security contributions workers and pensioners.
O gráfico seguinte mostra as taxas de substituição da pensão líquida para um assalariado de rendimentos médios nos vários países da OCDE, com os mesmos destaques em termos de países e regiões:

The net replacement rate of pensions is more than 90% in Portugal, about 80% in China, 70% in the average of the 28 countries of the European Union and just over 60% in oecd countries.
It remains very low in the UK (30%), Japan and Australia (40%) and in the USA (50%).
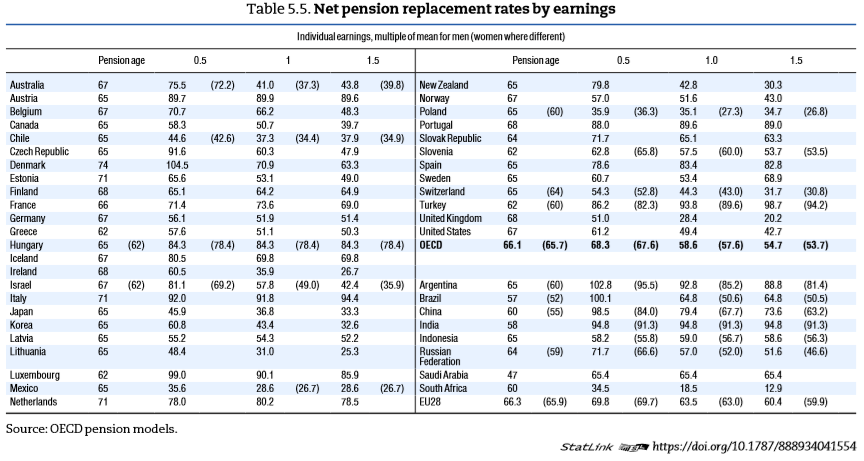
Moving from averages to various income brackets we have:

Typically, the net replacement rate is higher for lower income levels. For the average OECD countries this rate is 58.6% for an aggregate with average incomes, about 68.3% for households with half the average incomes and down to 54.7% for households with incomes 50% higher than average.
https://www.oecd.org/daf/fin/private-pensions/Pension-Markets-in-Focus-2021.pdf
The calculations we can make
This means that if we spend normally and on average 85% of our last wage at retirement age, in countries where the replacement rate is higher than this percentage, middle-income households will not have such a great need to set up many savings for retirement, but in countries where this rate is much lower than that, these people will have to supplement these pensions with other income.
However, households with higher than average incomes will normally need to make their own personal retirement fund.
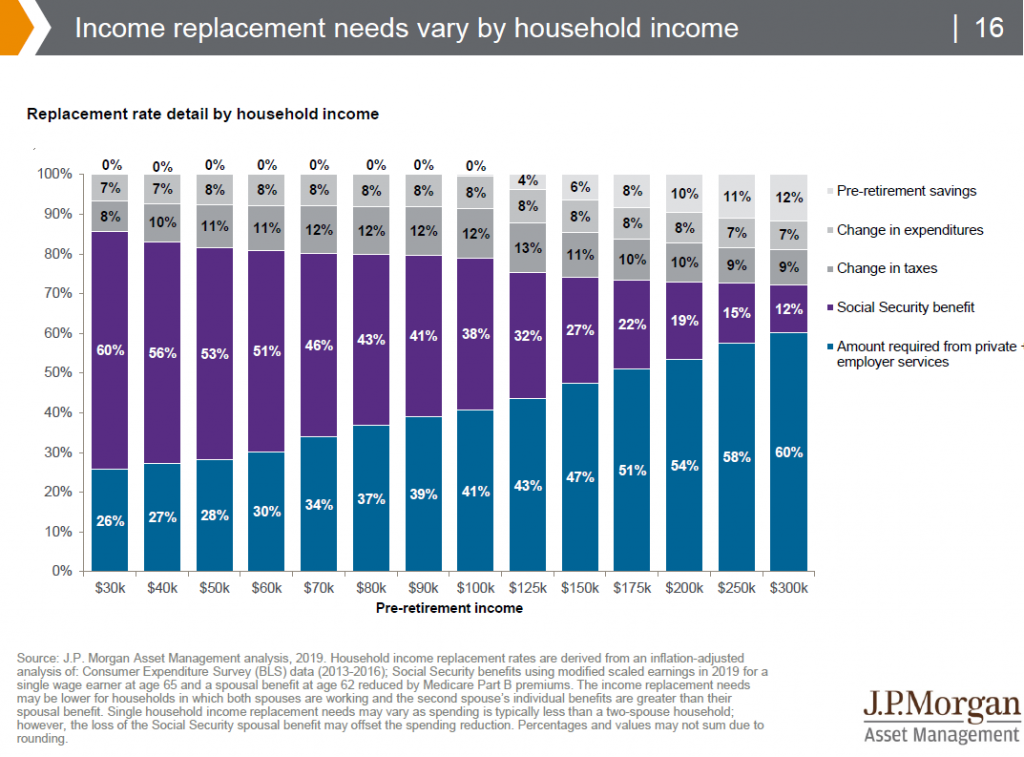
It is worth keeping in mind the following example of the US to have an idea of income coverage in retirement by income brackets in the asset:

Anything that does not come from Social Security has to come from pensions or private savings.


