There are three major methods of evaluating the value of stocks, that of fundamental or financial analysis, that of technical or graphical analysis, and that of quantitative or statistical analysis.
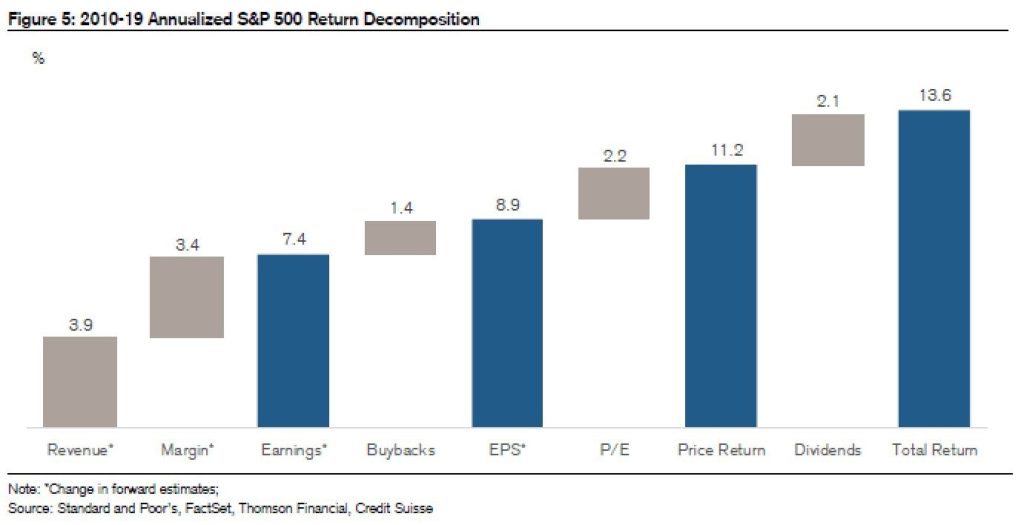
There are many key valuation indicators and metrics, so it’s very helpful to know which factors have contributed the most to the S&P 500’s stock yield in recent years.
The fundamental analysis is based on the company’s financial information and indicators and has as its main method of evaluation the discounted cash-flows model.
Gordon’s model as a simplification of the cash-flows or discounted dividend model
This article is part of a series on investing in stocks.
In the first article we presented the reasons for investing in individual stocks.
We have also seen how we can use a core and satellite strategy in managing our wealth, combining market-indexed and low-cost investments with investments in individual stocks.
In the second we addressed the topic of how we can select the universe of stocks to arrive at our list of stocks to invest in.
We have linked the purpose of this list to the lists of stocks that have performed excellently in the past.
We have also seen that although there are many lists made publicly available by the specialized media there is only one list that suits our individual case.
Then we move on to the principles of analysis and evaluation of the actions that will be part of our list.
In a previous article we analyzed the importance of investing in stocks with lasting or sustainable competitive advantages and what the analysis methodologies are to identify them.
But as important as the value of these companies with competitive advantages is the purchase price.
This article is the first to look at valuation methods in order to conclude whether a stock is at a reasonable and fair price or too expensive.
Warren Buffett follows three general rules when deciding which companies to invest in, as he wrote in Berkshire Hatthaway’s annual letter to shareholders in 2019:
“First, companies must get good returns on the net tangible capital required in their operation. Second, companies must be run by capable and honest managers. Finally, the shares of these companies should be available at a reasonable price.”
In this article, we begin by reviewing the three main methods of business valuation, fundamental, technical and quantitative analysis.
Next, we present the main model of fundamental analysis, that of discounted cash-flows and their simplification in the Gordon model.
The objective of presenting these methods and models is not so much to show how they can be used, but above all to raise awareness of their main variables and their importance.
This sensitivity and some intuition will allow to acquire useful knowledge to be able to evaluate and compare stocks, far beyond the purpose of building models that in most cases are not within the reach of the average investor.
In a next article we will present the technical and quantitative analyses.
There are three major methods of evaluation, that of fundamental or financial analysis, that of technical or graphical analysis, and that of quantitative or statistical analysis.
A company’s share price can be analyzed and evaluated in many ways.
There are three main methods of evaluating an action depending on the nature of the information used:
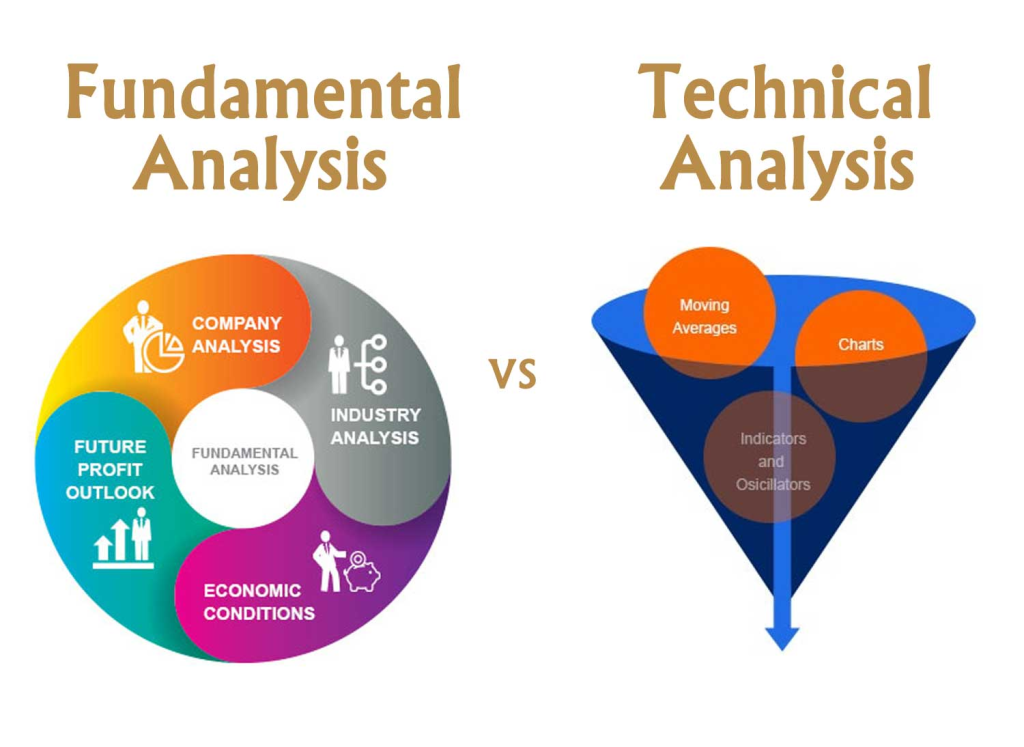
The fundamental analysis method uses the company’s financial information, revenues and costs, results, profit margins, revenue and earnings growth, asset value, debt and equity, debt ratios, and other indicators, to estimate the value of the company.
The technical analysis method aims to detect patterns in the behavior of the stock in the market, through graphical evolution or indicators related to prices and trading volumes.
The quantitative analysis method uses statistical science to find the most relevant measures and relationships between variables that best explain the historical evolution of the stock, with the aim of creating an algorithm of a winning investment strategy.
There are many key valuation indicators and metrics, so it’s very helpful to know which factors have contributed the most to the S&P 500’s stock yield in recent years.
As we will see below, the variables and assumptions of fundamental analysis are many.
In the following link we can already get an idea of some of the numerous indicators that are used in this analysis:
https://help.streetsmart.schwab.com/edge/1.6/Content/Research%20Metrics.htm
For this reason and before we get into the presentation of the models it is important to understand how the returns of the stock market are decomposed.
This analysis allows us to highlight the most decisive elements for the valuation of shares.
It is clear that the importance of these elements varies over time.
The following chart shows the relevance of several indicators for the performance of the S%P 500 in the decade from 2010 to 2019:
The fundamental analysis is based on the company’s financial information and indicators and has as its main method of evaluation the discounted cash-flows model.
In the following image we present the models of fundamental valuation of actions:

In economic and financial terms, the value of a stock is the value of the company to shareholders.
Shareholders hold stakes in the capital of companies that give them rights to future results and that are distributed to them through dividends or the repurchase of own shares (which are a form of dividends in kind).
The main valuation method used in fundamental analysis is the discounted cash flows (or cash-flows) method.
This method obtains the value of the company to the shareholder from the sum of the value of the future cash flows generated annually by the company and attributable to the shareholder, discounted at the rate of return required by them (that of equity).
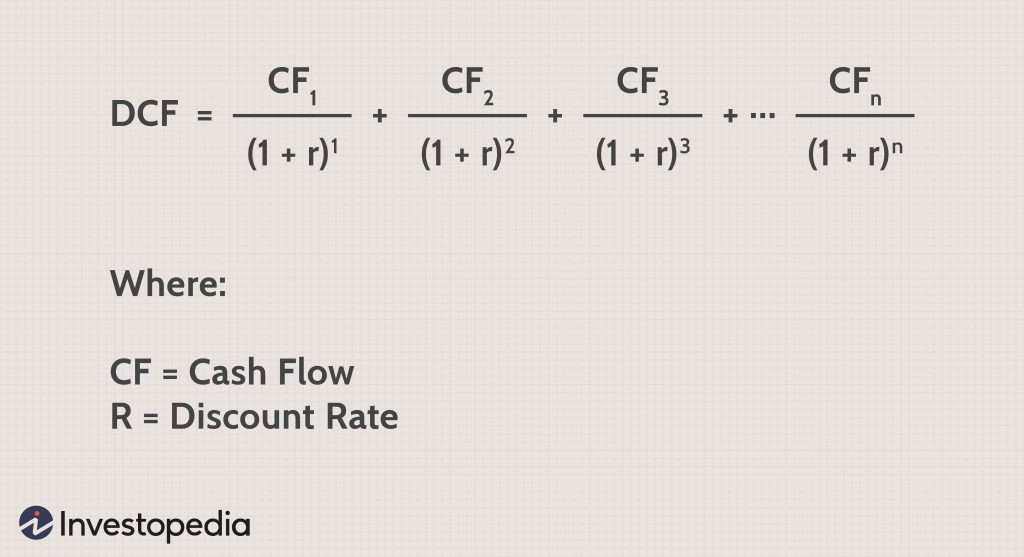
It uses cash-flows instead of results, insofar as they are, as their name implies, cash flows or means released net and distributable to shareholders, thus reflecting the true wealth generated by companies.
This model is very demanding in terms of information, mainly because it requires the estimation of future annual cash flows.
The free cash-flows to the shareholder or the net free means generated by the company represents the cash flows available for distribution to the shareholder after reinvestment in capital expenditures in the business.
It is obtained by adding the following 3 installments: the operating cash-flow (net income plus amortizations), the working capital needs and the investment in fixed assets.
Annual values are usually predicted for a period of between 5 and 10 years, after which the growth (at cruising speed) of a perpetuity is projected.
The discount rate used is that of the return sought by the shareholder which, on average, can be approximated by the average annual rate of return provided by the S&P 500 index from 1926 to date of about 10%.
Considering the requirement of this model, soon simpler versions appeared.
The most frequent version is the discounted dividend model that replaces cash flows with dividends.
This model is very useful in situations where companies distribute a good part of the results to shareholders through dividends and these are reasonably stable.
This model of discounted dividends can be simplified by an easier-to-use version that is known by the Gordon model.
Gordon’s model as a simplification of the cash-flows or discounted dividend model
The formula of Gordon’s model is quite simple:
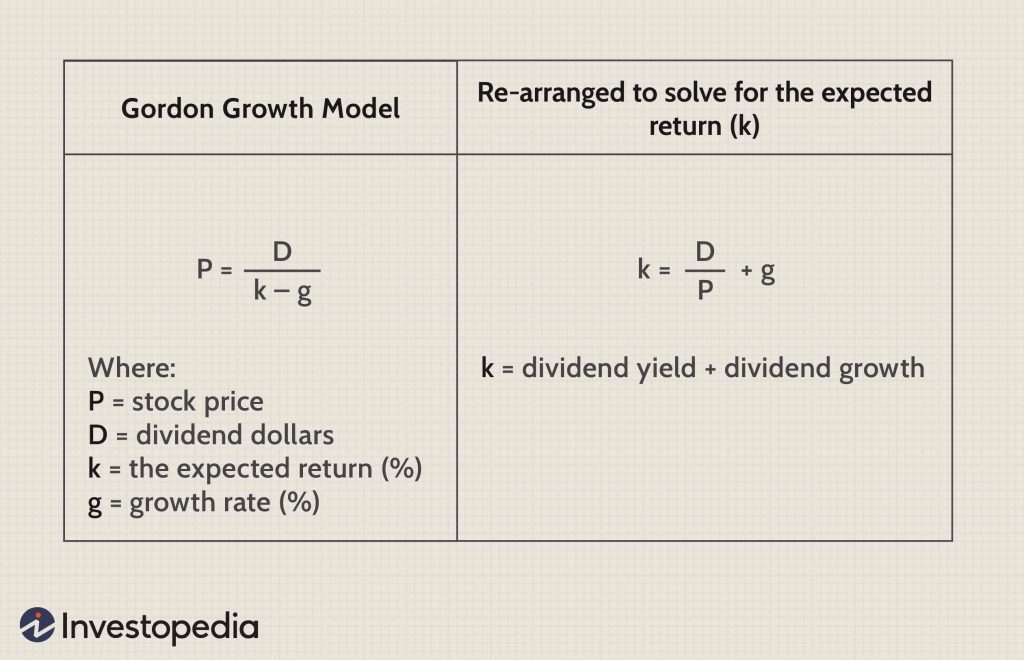
According to Gordon’s model the value of a stock is equal to the value of the dividend (D) and the difference between the rates of return required by the shareholder (k) and the dividend growth rate (g).
Gordon’s model introduces the following simplifications and assumptions.
First, as we said, it replaces cash-flows with dividends, which is not very important because dividends, paid in cash and through share repurchases, are effectively what the shareholder receives.
Second, it considers a linear growth of dividends.
Most companies do not have a linear growth dividend policy, not even the most mature ones.
There are even many companies, the so-called growth companies, that do not distribute dividends, either because they do not yet have positive results or because they reinvest all of them in the business to grow.
Regardless of these considerations, the model has the advantages of being quite simple, intuitive and easy to use, and of drawing attention to the 3 variables of the formula: the dividends of the first year, the required rate of return and the growth rate.
In a following article we will see the importance of return on invested capital or ROIC and how its influence can be measured in the formula of Gordon’s model.


