


Patterns of negative stock market cycles: major financial crises are linked to economic downturns and overvaluation of markets, while others are triggered by external or exogenous events
The best indicators that seek to anticipate stock market crises: signs of economic recession, either leading indicators of the economy or the inflection of the interest rate curve (or the New York recession probability review model)
The rise in volatility (or the VIX) can also be a good indicator for major crises, but the problem is to get the timing right, because the phenomenon can be confused between the cause and effect relationship
How should we act when faced with major crises in equity markets?
Patterns of negative stock market cycles: major financial crises are linked to economic downturns and overvaluation of markets, while others are triggered by external or exogenous events
The following chart, which shows the major crises of the post-war period, allows us to uncover patterns of crises:
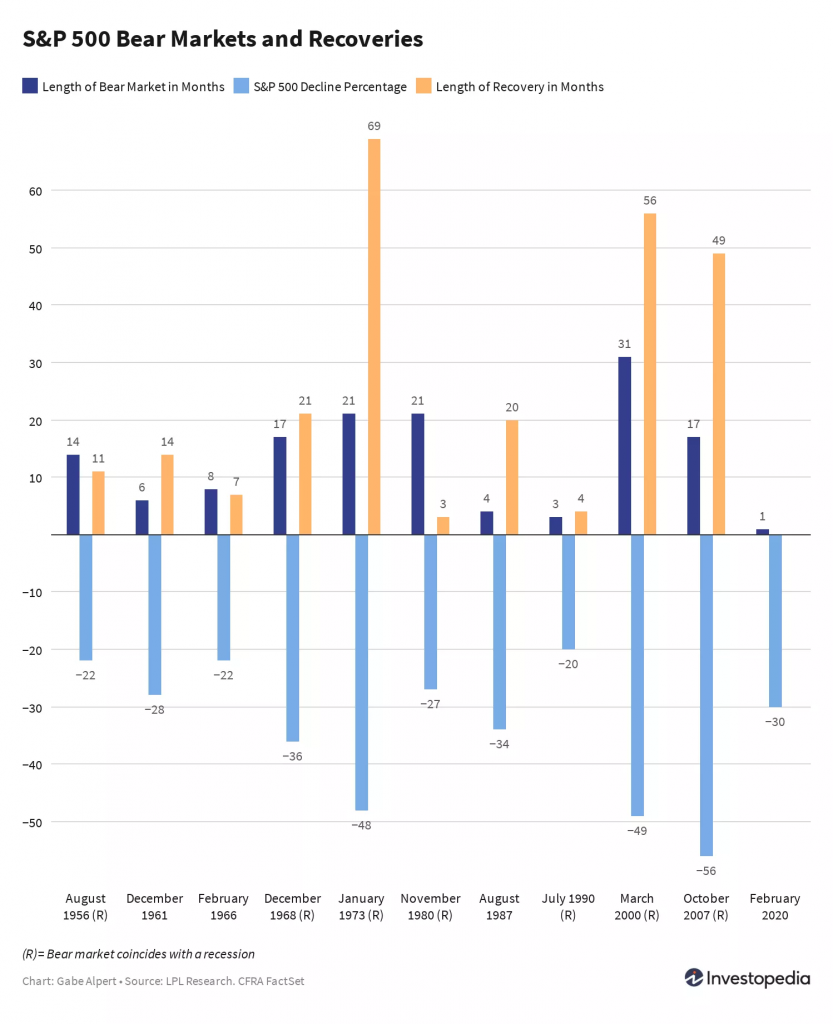
Of the 11 crises recorded, 7 coincided with economic recessions: in 1956, 1968, 1973, 1980, 1990, 2000 and 2007. The racks had other factors at the origin.
The vast majority of crises, but especially the deepest ones, are associated with economic recessions. The great crises of the 1973 1st oil shock with 48% devaluation, the technology bubble with 49% losses, and the Great Financial Crisis of 2007 were all marked by economic recessions. Not to mention the biggest crisis of all, the Great Depression of 1929, in which the index depreciated 83% in 2.8 years, which as the name implies was a huge recession, compounded with a preceding speculative bubble and subsequent restrictive central bank action to contain it that only made it worse.
In the remaining situations, the crises were caused by external events, be it the Cuba missiles of 1961, the credit contraction of the economy of 1966, the Black Monday of automated transaction algorithms of 1987, and the pandemic of March 2020.
The following chart shows us the overlap of crises with economic recessions between 1965 and 2019:
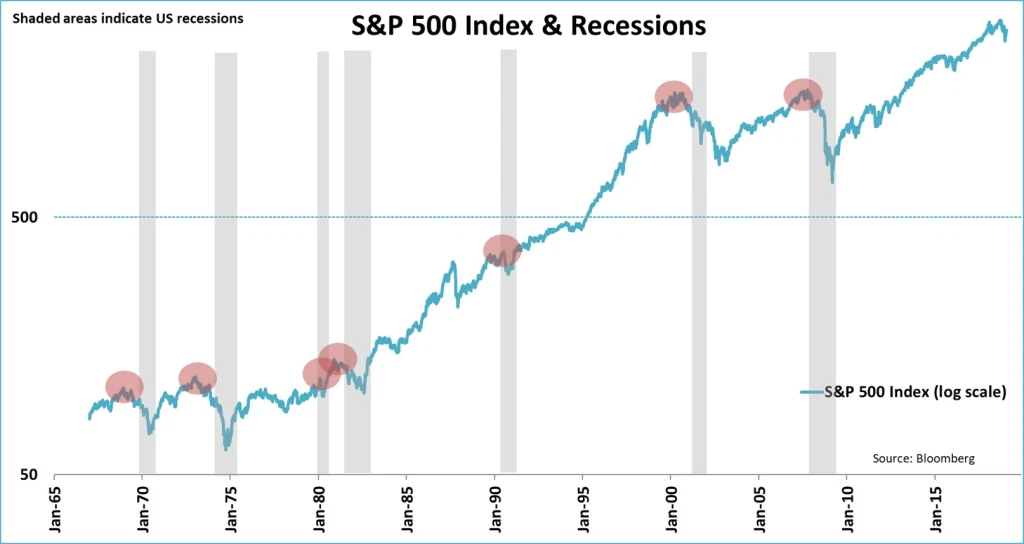
Almost all recent crises have coincided with, anticipated or preceded an economic downturn. Of the 7 crises, 3 occurred at the same time (1980, 1990 and 2007), and the remaining 4 occurred in anticipation of a recession (1968, 1973, 1983 and 2000).
Thus, economic contractions are a key determinant of market crises.
However, there is another factor that is even more frequent in market crises: all major crises without exception coincide with moments of market valuation excesses.
The following chart shows the evolution of the S&P 500 index and the multiple of the index price in terms of the earnings of its constituent companies adjusted to the business cycle proposed by Nobel laureate Robert Schiller, or CAPE for “Cyclically Adjusted Price Earnings” (with secular positive and negative cycles also being marked):
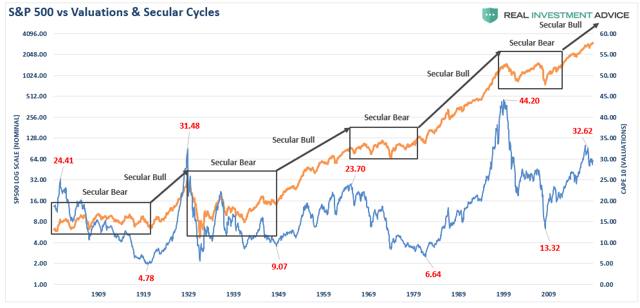
It is clearly seen that negative cycles are always preceded by abnormally high Schiller CAPE values. Schiller’s CAPE was 31x in 1929, 23x in 1968, 44x in 2000 and 25x in 2007. It’s currently at 32x.
Just as important as looking at the excesses up or euphoria is also looking at the excesses down or panic. The lowest values of Schiller’s CAPE range from 4.8x in 1919 to 13x in 2009.
The best indicators that seek to anticipate stock market crises: signs of economic recession, either leading indicators of the economy or the inflection of the interest rate curve (or the New York recession probability review model)
From the analysis of the patterns it was concluded that there are two events that we can control for in order to identify and even seek to anticipate major crises: on the one hand, recessions, and on the other, overvaluations.
As for the latter, we already know the preferred indicator, which is Schiller’s CAPE.
As for recessions, we always have their own defining element and technical indicator of 2 consecutive quarters of GDP contraction. However this may be fallible, as it is late and temporary.
In the case of measuring economic activity, it is preferable to follow leading indicators such as business surveys, ISM or PMI.
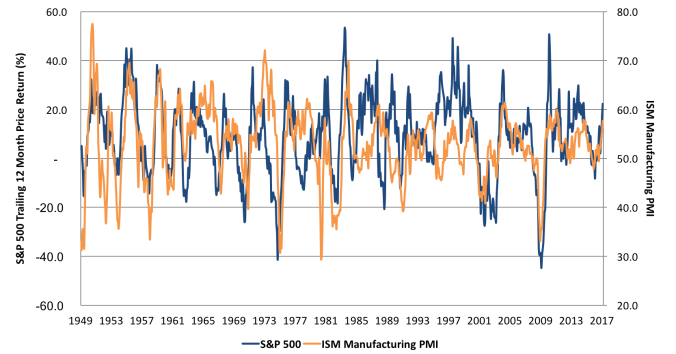
The following graph shows us the behavior of the ISM or PMI from 1963 to date, also noting the economic recessions:
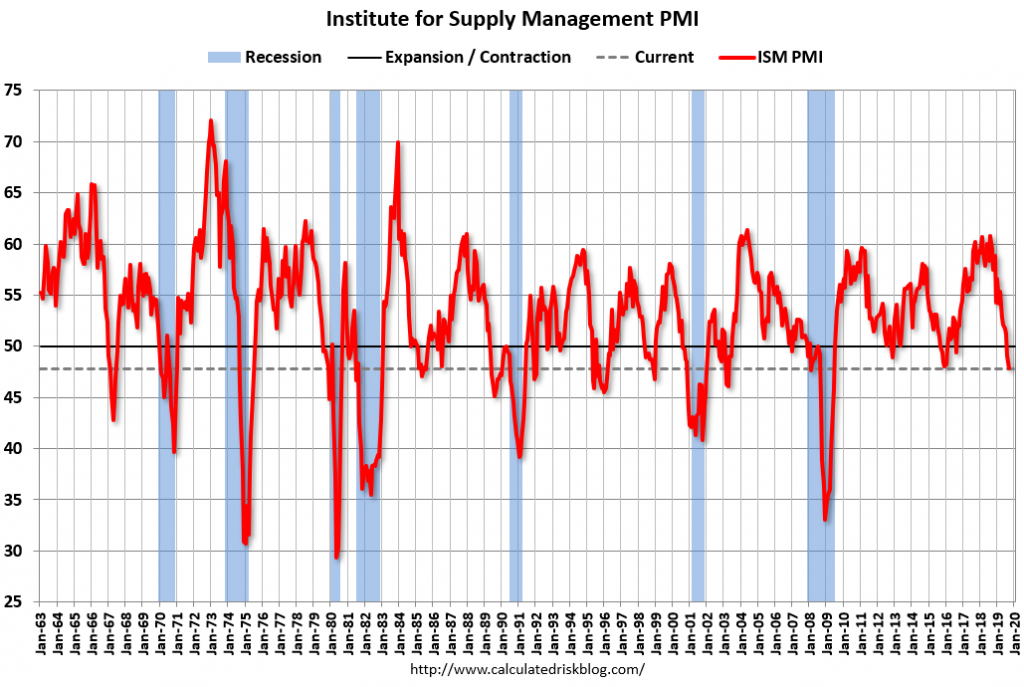
We know that the ISM or PMI is a coincident indicator of economic activity that results from a broad survey of entrepreneurs and managers of large North American industrial companies, and is published weekly. We also know that the 50 line marks the limit between contraction and expansion of economic activity.
However, there are many situations where this indicator falls below the 50 level and no recessions take place.
On the other hand, in all recessions, this indicator comes in below the level of 45. However, even more important is how often this indicator has been useful in anticipating recessions or more importantly sharp market declines.
The following chart shows that there is a good correlation between the ISM and the S&P 500 especially in major crises:
Another leading indicator that has proven very useful for anticipating crises is that of the NY Fed’s recession probability model which is based on the spread between long and short interest rates.
The following chart shows the evolution of the spread between long-term and short-term interest rates between 1965 and 2020, along with the recessions experienced and the S&P 500 peaks prior to them:
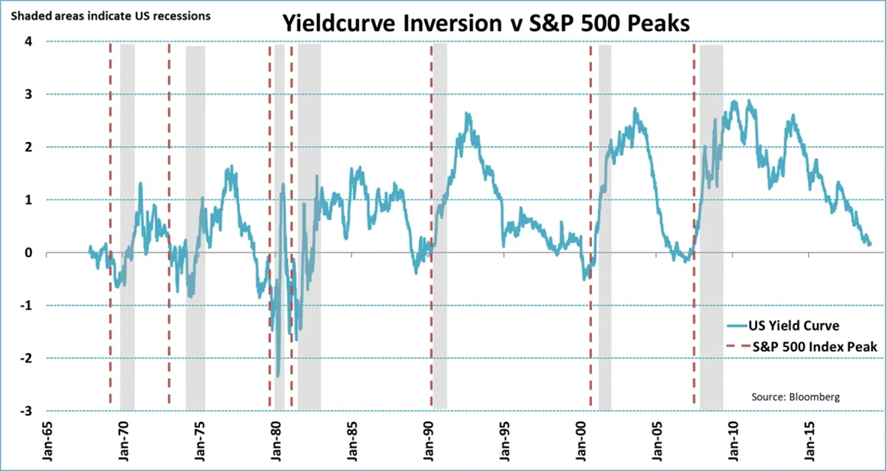
We see that whenever there is the interest rate differential and it reverses, that is, short-term interest rates exceed long-term interest rates, economic recessions arise.
In conclusion: Major market crises arise when there is overvaluation and are usually associated with economic downturns. The best indicators are Schiller’s CAPE and ISM.
The rise in volatility (or the VIX) can also be a good indicator for major crises, but the problem is to get the timing right, because the phenomenon can be confused between the cause and effect relationship
The following graph shows the evolution of the most followed stock market volatility indicator the VIX between 1928 and 2018:
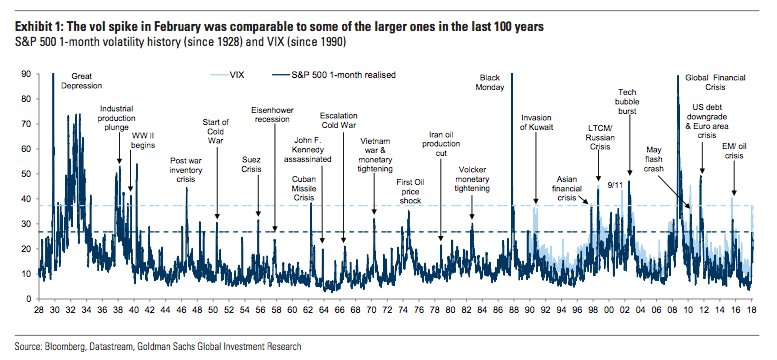
Every time the VIX spikes above 40 we have a crisis in the markets. The big question that remains to be answered is whether it is cause or consequence, i.e. whether it is a leading and useful indicator or a lagging and merely for the record.
How should we act when faced with major crises in equity markets?
First of all it must be stressed that despite some evidence or signs arising from the patterns of previous crises it is very difficult to anticipate a crisis, and even one of the major crises.
However, this situation should not cause concern about the attractiveness of investing in equity markets, precisely because their returns outweigh all the risks involved, including those of the most severe crises.
More importantly, the investment in the stock market is for the medium and long term, a period long enough for the passage of time to dilute those fluctuations. And since this investment should be diversified, at each moment aligned with our profile and financial situation, we will have the balanced and adequate exposure.
Secondly, and as we have seen in other articles, we should not change our course at all, even if we manage to anticipate the technical corrections of the markets or falls that do not exceed 20%, because they are very frequent and temporary, which makes it even more difficult to get right on the return to the market, with the gain of the momentum right.
Thirdly, what we should do on a regular basis, and especially during the most severe market crises where falls exceed 20%, is to re-evaluate our risk profile according to the financial situation and objectives at the time, and if this has changed, we should adjust the asset allocation and consequently the investments.
Fourthly and finally, in the face of a stronger correction or a crisis in the markets, what we must do is what must always be done, rebalancing. Obviously in a crisis rebalancing becomes even more important.
We must not allow the allocation of assets or investments to change excessively, especially in the face of major market swings. Rebalancing should be done periodically, preferably once a year, and whenever the composition of the two main asset classes, equities and bonds, deviates from the tolerance level of 5% or 10% of the initial allocation established.
The following chart prepared by UBS shows the effect of rebalancing on an investment portfolio of 60% S&P 500 stocks and 40% treasury bonds between 2007 and 2017 for a tolerance level (or “drift” of 5%):
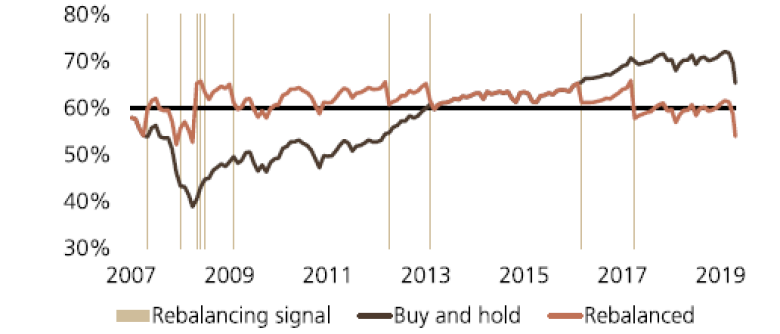
In this case, rebalancing is done whenever the 60/40 allocation deviates beyond 5 percentage points in absolute terms.
The following graph shows the impact of rebalancing on portfolio performance:
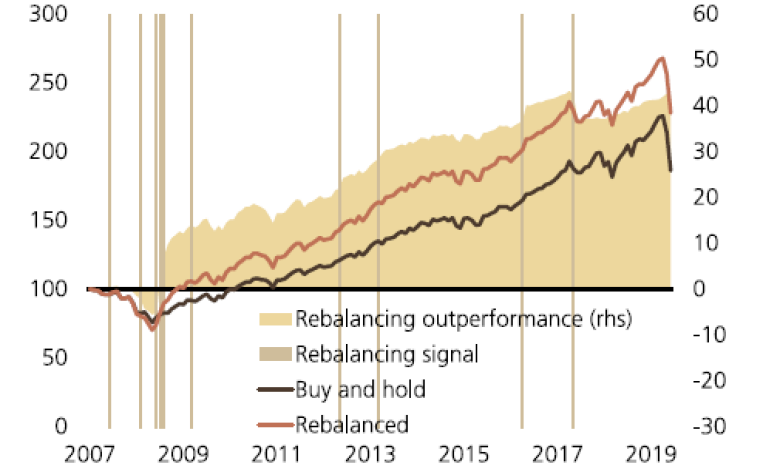
Rebalancing clearly has a stabilising or cushioning effect on the risk of major crises. In this case, it even provided better performance, although that is not your goal and doesn’t always happen. Its function is to reduce risk. And it does so by pursuing a winning investment strategy, buying cheaper and selling more expensive!


