Individual investors did not take advantage of the excellent performance of the long bull market of bonds
The less obvious implications of the long bonds bull market
The performance of the traditional portfolio 60/40
The assets correlations
For four decades, the bond market has had only one meaning, that of the rise.
Since 1981, interest rates have developed a downward trend, which has significantly raised bond prices.
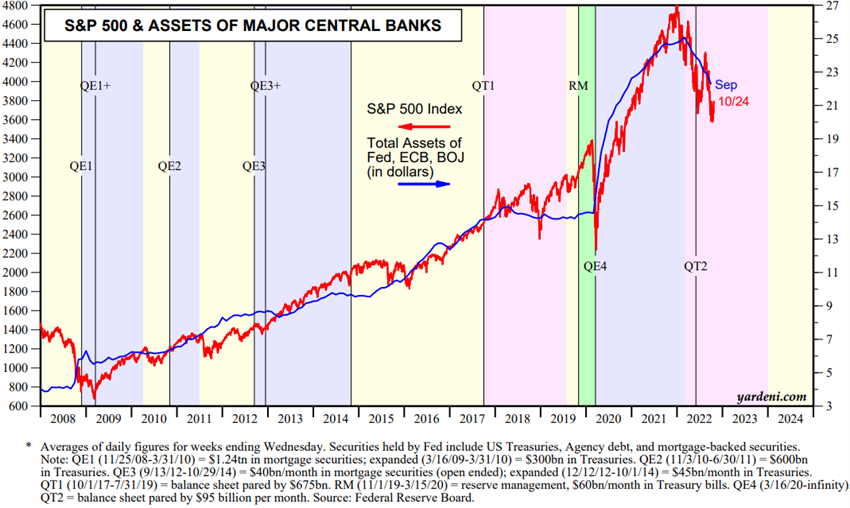
This was reinforced in 2020 by central banks’ response to the pandemic, bringing interest rates to low levels.
Therefore, this period became known as the long “bull market” of bonds, unheard of and impressive.
This period was also accompanied by a very positive stocks performance.
We addressed these topics in the first two articles of this mini-series.
At first we saw the origins of this long bull market of bonds and pointed out its creator, monetary policy
In the second, we saw that it was the strong unconventional monetary policies known as quantitative easing that prolonged the bull market for so long and led it to such great depth.
Long-term interest rates began to rise, first in anticipation, then in response, to the late performance of central banks raising official short-term interest rates and reversion of the asset purchase program.
This shift from an expansionary or accommodative monetary policy to a restrictive monetary policy has obvious implications and consequences, namely causing strong devaluations in bonds and also of stocks.
In this article, we will see other implications of the end of the bull market, how it gave way to a bear market and what may come from now on.
We begin by analyzing the extent to which most individual investors benefited from this ride.
Individual investors did not take advantage of the excellent performance of the long bull market of bonds
Despite this very positive cycle, both for bonds and for stocks, the average investor, both in bonds and stocks mutual funds and , did not obtained these returns:
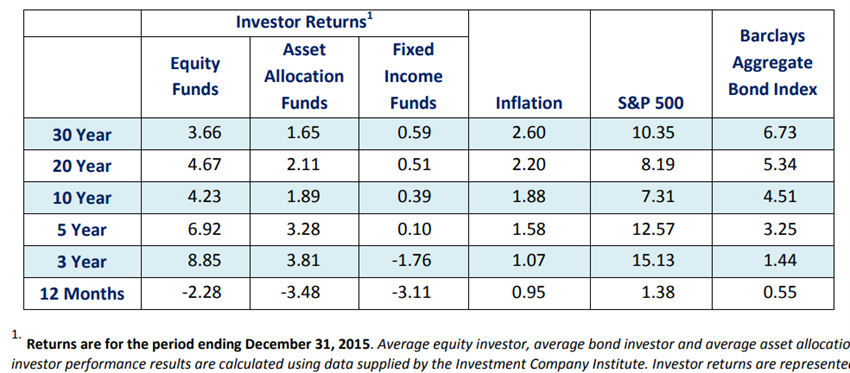
Over the past 20 years, the average bond investor’s annualized returns have been 0.51%, compared with 5.34% in the Barclays Aggregate Bond index.
The average investor’s annualized stock returns was 4.67%, compared with 8.19% in the S&P 500 index.
These differences are roughly equal to 5, 10 and 30 years.
These differences represent large losses for investors.
The main reason for these differences is the poor choice of investment funds, and the biases of the investor, in this case the manager.
Mutual funds have performed poorly against the index, and the commissions charged are very high, decreasing the net return of the investor.
The following chart shows the yields and volatility of investment in 10-year U.S. treasury bonds per decade:
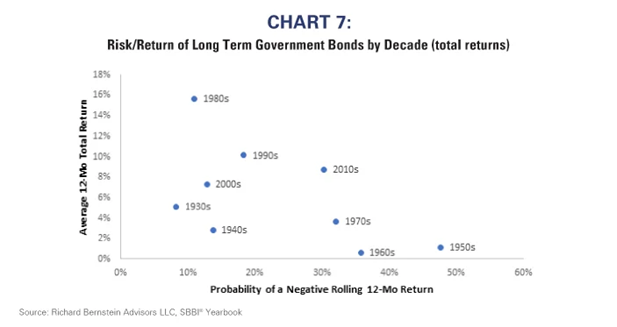
Bonds have delivered high returns with a relatively small probability of investment loss over the past 4 decades.
This makes the poor performance of active management worse.
However, bonds had weak returns during the 1960s and 1970s and a higher probability of negative returns.
And the question is whether these investors, who have had poor results with favourable markets, are able to improve the situation in a context that is more unfavorable.
The less obvious implications of the long bonds bull market
In the previous article, we saw that it was monetary policy that triggered and boosted the bull market of bonds, inflating the prices of all financial assets.
This policy has generated annual bond returns much higher than average, and very low risks.
The same policy resulted in higher than average stock returns, although more moderate in historically comparable terms.
But there are other less obvious implications of the possible end of this cycle, which is what we will see in this article.
Historical performance and impact of this end of cycle on the 60/40 portfolio
The traditional portfolio or 60/40, of 60% stocks and 40% bonds, is so called for being the most used and reference allocation for many individual investors.
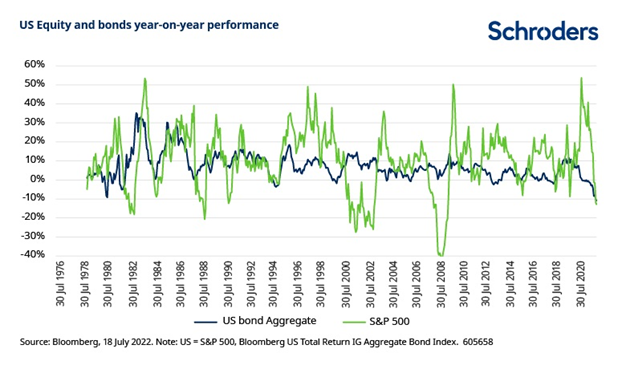
This portfolio showed that it is a good level of risk diversification in that the times when stocks and bonds performed poorly at the same time:
This portfolio gained precedence because it provided very attractive profitability to investors, with a moderate level of risk:
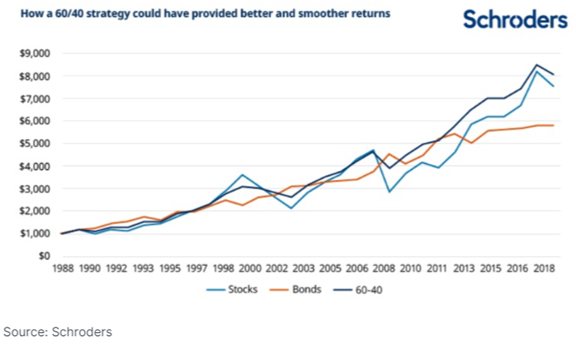
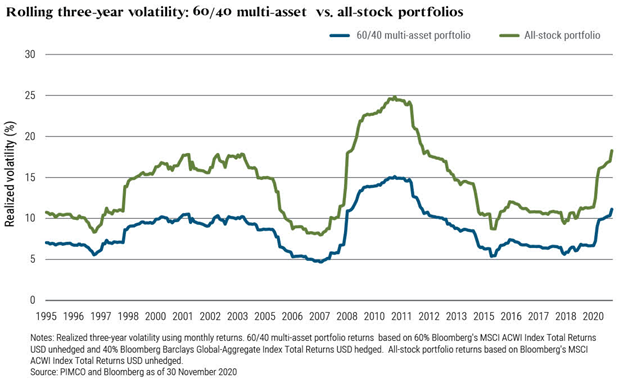
The returns of the traditional portfolio were similar to those of an exclusively stock portfolio, but with much lower fluctuations.
The annual returns of this portfolio have been very interesting for much longer (note: annualized in 2022):
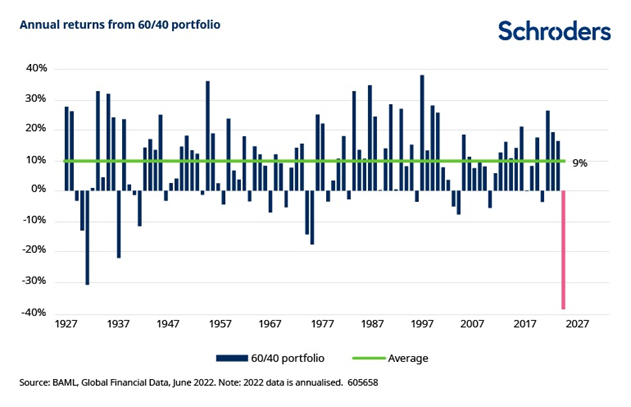
In fact, since 1926, average annual returns have been 9%.
The risk of the portfolio, measured by volatility, is much lower than an exclusively portfolio of stocks:
But the charts of the returns we showed above also allow us to anticipate an important development of the end of the bull market of bonds.
In 2022, with both stock and bond yields on very negative ground, both markets went into bear market, so the portfolio also went into bear market.
Since most investors use this portfolio, including pensioners, these losses have a big impact and give rise to great discussions.
Due to the continued rise in interest rates and losses, there are those who are watching the end not only of the bull market of bonds, but also of this portfolio.
We consider that this view is not correct.
We believe that at the end of this period of adjustment of interest rates and growth this portfolio will return to good performances, but we will develop this theme in another article.
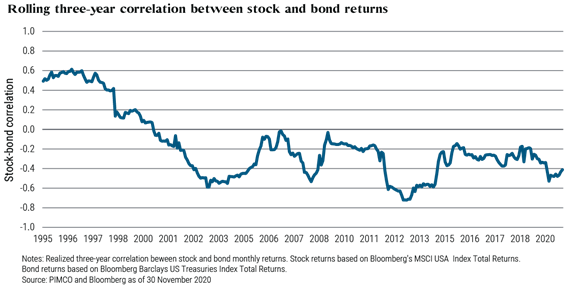
Changes in the correlation between stocks and bonds and effects on diversification
In this bonds bull market, the correlation between stocks and bonds has gone from positive to negative, reinforcing the attractiveness of asset diversification:
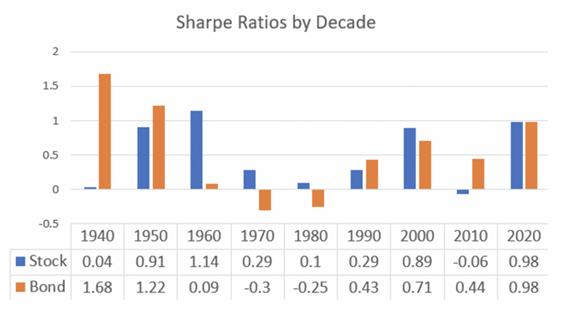
In this bull market period of bonds, the Sharpe ratio, an indicator that values the value of risk-adjusted profitability, benefited bond investments more than those in stocks:
