


The PER values of the S&P 500 market over the years
The PER of the market has been rising in recent years
The two most discussed indicators in stock market valuation are PER (ratio of market price to earnings per share) and EPS (earnings per share), because they are simple, accessible, objective and practical.
That is why we have approached this topic several times from multiple perspectives.
We did so in the article in which we describe and characterize stock investing.
We did this again when we presented the definition, evolution and importance of the EPS and also of the PER for the evaluation of the actions.
Later, we approached the PER from the perspective of assessing the fair value of the market.
Finally, in a more recent article, we looked at the relationship between interest rates and these two indicators.
The importance of these two indicators for equity investment means that they are the subject of an analysis developed in all quarterly perspectives of the financial markets published.
In a more recent article we focused on the topic of EPS of the market, showing how it is obtained and how it can be analyzed.
Subsequently, we published the first part of this article dedicated to PER, in which we showed its importance, usefulness, advantages and limitations.
This article analyzes the fluctuation bands of the PER over time, seeking to obtain reference values, in order to try to evaluate whether the market is at a fair, expensive or cheap price at any given time.
This assessment is very important for many investors in that knowing, as we have seen, that the PER determines long-term returns, investment strategies and allocations are influenced by the measurement of the degree of market valuation.
The analysis of benchmark market PERs is seen as one of the aspects, if not the most critical aspect, of equity market investments.
Note that by this we do not mean that one should do “market timing” according to the PER, that is, enter and exit the market depending on its values.
In previous articles we have seen that it is very difficult, if not impossible, to choose the investment times in the market in order to make money.
Even the best professional investors don’t get it. And this temptation and attempt can not only lead to losses but is considered the main reason for most investors to obtain returns much lower than those of the market.
However, this does not mean that investment allocations should remain static over time.
What we have also seen in other articles is that the various financial investments behave differently according to the economic cycles, namely in terms of growth, inflation rates and interest rates.
We have even seen which investments typically perform best in the recent context of high inflation rates and high interest rates.
In our opinion, we may adjust the exposure and asset allocation of investment portfolios to market cycles.
We can fine-tune the combination of stocks and bonds, equity investment strategies, e.g. value and growth, or sectoral, etc., or bond investment strategies, e.g. short-, medium- and long-term (or duration), or credit risk.
The PER values of the S&P 500 market over the years
Despite the volatility of PER it is possible to seek to define fluctuation bands that can be used as a reference to evaluate whether the market is expensive or cheap at any given time.
The following graph shows the evolution of the observed PER (“Trailing”) of the S&P 500 since 1872:
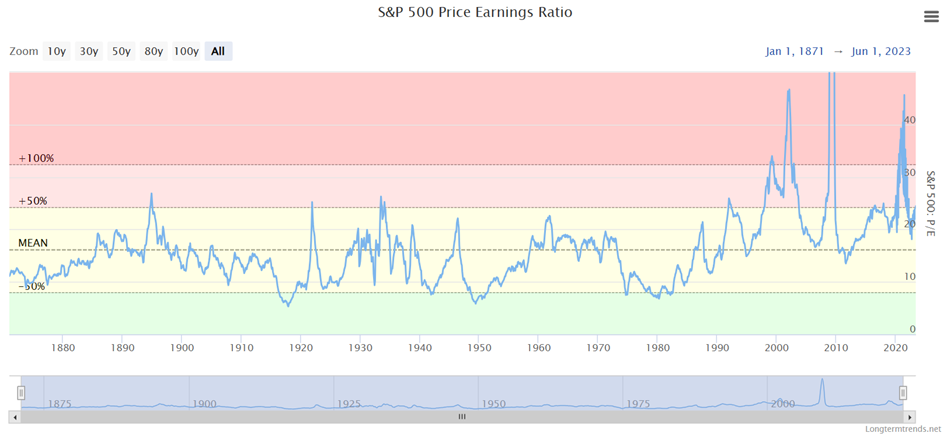
The most notable S&P 500 PER values are as follows (note: it is obvious that there are differences in reference PER values consonant with the various sources of information used):
Historical average 15.98x
Historical median: 15.24x
Min/Max history: 5.31x (1917) / 131.39x (2009)
Average of the last 25 years: 26.04x
Average over the last 10 years: 22.94x
Average of the last 5 years: 24.75x
The current value of the PER (6/29/23) is 24.91x.
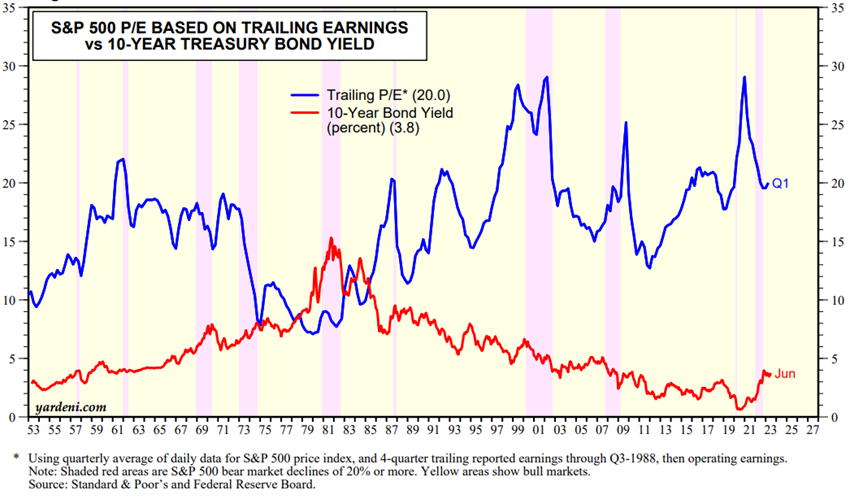
Historical data shows that the average annual PER for the S&P 500 was 13.34x between 1900 and 1980.
However, over the next 40 years, from 1981 to 2022, the average annual PER increased to 21.92x.
The typical range of annual PER values of the S&P 500 is 19.08x to 27.80x.
Another widely considered interval is the one that calculates the values of the PER with deviations taken as extremes, of plus and minus one standard deviation from the mean.
The PER of the S&P 500 with +1 standard deviation is 30x and with -1 standard deviation is 6x.
Considering the sensitivity of the observed PER “Trailing” to sudden and drastic changes in the market, two alterative indicators are used that have been shown to have greater predictability of long-term yields.
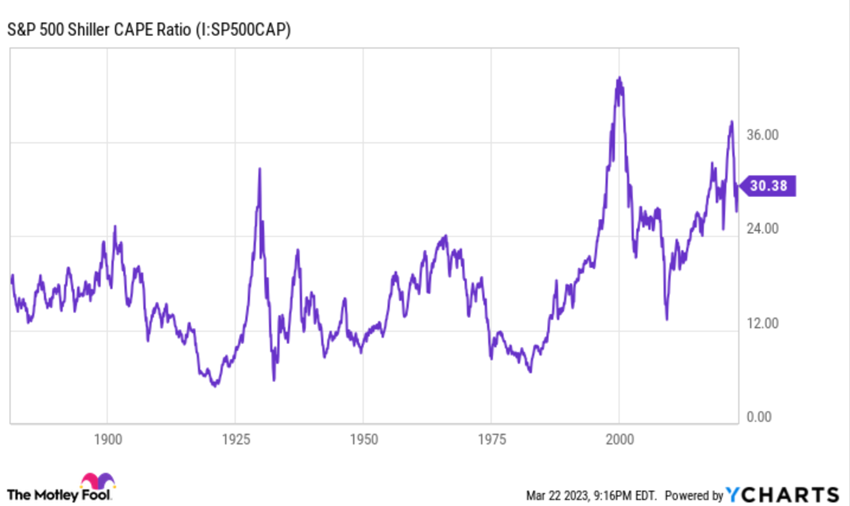
Since 1870, Shiller’s PER has averaged about 17x.
Over the past 25 years, Shiller’s PER has long been above 25x, due to historically low interest rates and ease of access to financial information, which has led investors to take risks and pay higher premiums for growth stocks.
Shiller’s PER signals problems is when it overtakes and stays above 30x. In a bull market, seven values have happened in just five years since 1870.
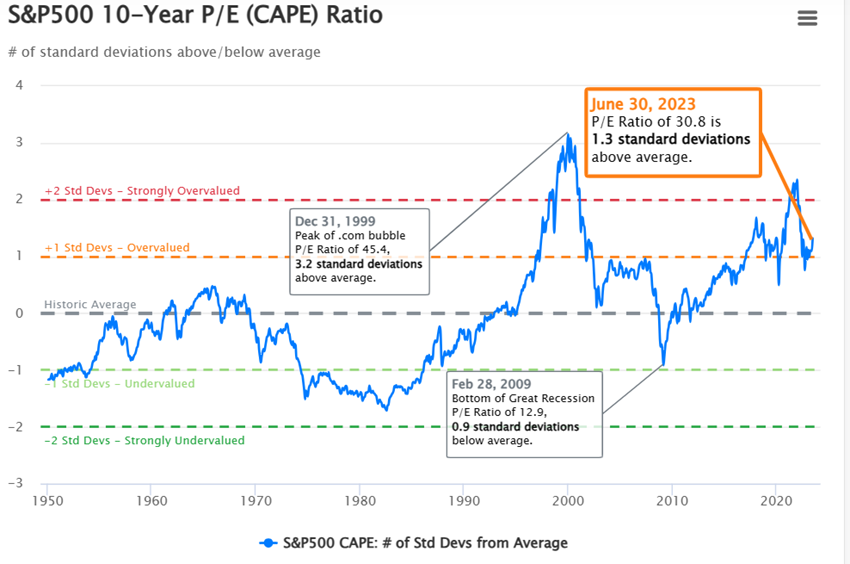
Shiller’s current PER ratio for the S&P500 is 30.1x.
This figure is 48.7% above the modern era (post 1950) market average of 20.2x, which puts it 1.2 standard deviations above the modern era average, which suggests that the market is overvalued.
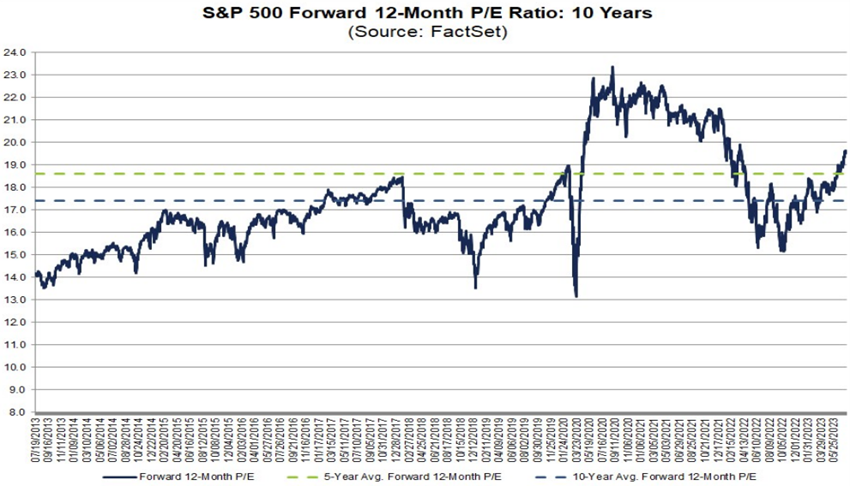
As we’ve seen, the forward PER compares a company’s stock price (or index) against the analysts’ consensus earnings estimate for the coming year (i.e., the forward).
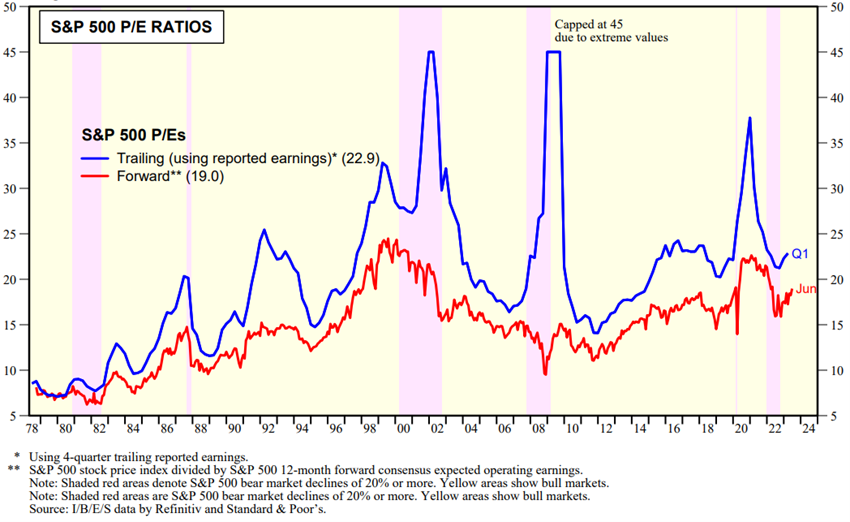
In this period, at no time did the forward PER fall below 13x to 14x, with the exception of the Great Financial Crisis of 2007-2009 and a correction in 2011.
Currently, the S&P 500’s forward PER is 18x, above the 25-year average.
Over the past 10 years, the forward PER of the S&P 500 has ranged from 13x in 2013 to 24x in 2020:
The PER of the market has been rising in recent years
In recent years, there has been an increase in the PER of the market.
This increase is due to three factors.
The growth of the investor base in the stock market, which has caused a decrease in the required risk premium.
The continued fall in interest rates between 1980 and 2021 (long bond bull market), which lowered the risk premium of bonds and made it less attractive to invest in bonds compared to stocks.
In fact, Ed Yardeni established a market valuation model that considers the level of interest rates known as the Fed model.
In addition, there was also a significant change in the sectoral composition of the market, with the increase in the weight of technology companies, companies with longer duration and higher cash flows and profits in the future, to the detriment of the financial and energy sectors, with lower PER.
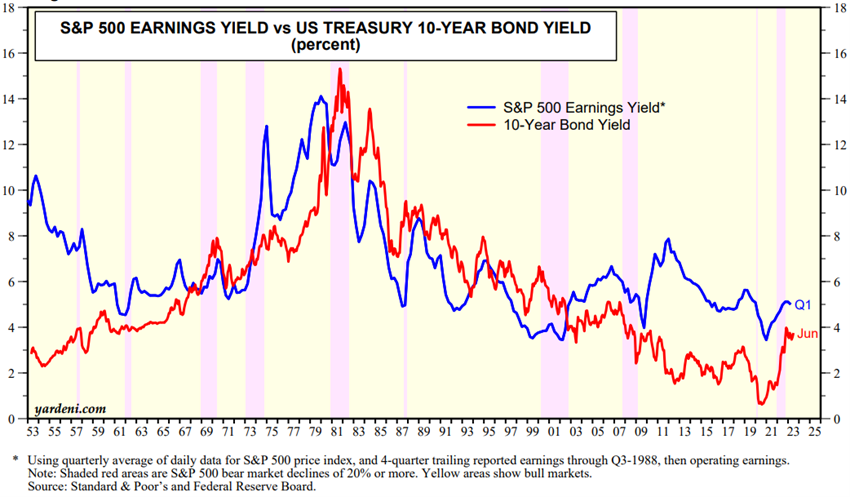
To that extent, the relationship between PER and market profitability is even stronger when relating PER to interest rates on 10-year bonds:
Investors are all the more demanding in assessing the market the higher the risk-free interest rates.
The following chart shows the correlation between the yield on risk-free bonds and S&P 500 stocks:
Finally, in terms of market valuation, we must not forget the effect of longer-term earnings growth.


